hep-ex/9701015
DESY 97-006
Design and Test of a
Forward Neutron Calorimeter
for the ZEUS Experiment
The ZEUS FNC Group
S. Bhadra1), I. Bohnet4), M. Cardy1), U. Dosselli2), C.-P. Fagerstroem1), W. Frisken1), K. Furutani1), D. Hanna3), U. Holm4), K. F. Johnson5), M. Khakzad1), G. Levman6), J. N. Lim3), B. Loehr7), J. F. Martin6), C. Muhl7), T. Neumann4), M. Rohde7), W. B. Schmidke1), D. G. Stairs3), H. Tiecke8), C. Voci2)
1) York University, Toronto, Canadaa
2) University of Padova, Padova, Italyb
3) McGill University, Montreal, Canadaa,c
4) I. Institute of Experimental Physics,
University of Hamburg, Hamburg, FRGd
5) Florida State University, Tallahassee, Florida, USA
6) University of Toronto, Toronto, Canadaa
7) DESY, Hamburg, FRG
8) NIKHEF, Amsterdam, The Netherlandse
| a | supported by the Natural Sciences and Engineering |
|---|---|
| Research Council of Canada (NSERC) | |
| b | supported by the Italian National Institute for Nuclear Physics (INFN) |
| c | supported by the FCAR of Québec, Canada |
| d | supported by the German Federal Ministry for Education and Science, |
| Research and Technology (BMBF) | |
| e | supported by the Netherlands Foundation for Research on Matter (FOM) |
Abstract
A lead scintillator sandwich sampling calorimeter has been installed in the HERA tunnel 105.6 m from the central ZEUS detector in the proton beam direction. It is designed to measure the energy and scattering angle of neutrons produced in charge exchange collisions. Before installation the calorimeter was tested and calibrated in the H6 beam at CERN where 120 GeV electrons, muons, pions and protons were made incident on the calorimeter. In addition, the spectrum of fast neutrons from charge exchange proton-lucite collisions was measured. The design and construction of the calorimeter is described, and the results of the CERN test reported. Special attention is paid to the measurement of shower position, shower width, and the separation of electromagnetic showers from hadronic showers. The overall energy scale as determined from the energy spectrum of charge exchange neutrons is compared to that obtained from direct beam hadrons.
1 Introduction
The ZEUS[1, 2] collaboration has installed a Forward Neutron Calorimeter (FNC) in the HERA tunnel 105.6 m from the central detector in the downstream proton direction. The calorimeter, which views the interaction point from zero degrees, is designed to study nucleon charge exchange reactions in collisions by detecting energetic neutrons produced at small scattering angles. The feasibility of the idea was tested successfully with two small test calorimeters in 1993[3] and 1994[4]. High energy neutrons were detected in both photoproduction and deep inelastic scattering[5, 6, 4].
Here we report on the design and construction of the FNC. We present results from the test and calibration studies at CERN, with special attention paid to the measurement of shower position, shower width, and the separation of electromagnetic showers from hadronic showers. At HERA the overall energy scale is determined from the energy spectrum of neutrons produced by charge exchange of beam protons with residual gas in the beam pipe. A test of this procedure was made at CERN by comparing the neutron energy spectrum from the charge exchange of beam protons in a lucite target with that obtained from the direct beam.
2 Design and Construction of the FNC
2.1 Introduction
The FNC detects neutrons produced at a scattering angle less than a milliradian and with energies as high as the HERA proton beam energy of 820 GeV. In physics studies of nucleon charge exchange, the energy transferred from the incoming proton (, the difference between the beam energy and the scattered neutron’s energy) is an important quantity. Excellent resolution on is needed to obtain good resolution on when is near the kinematical end point . The best energy resolution for high energy hadrons is obtained by the use of a ‘compensating’ calorimeter whose response to energy deposited by electromagnetic showers equals its response to energy deposited by hadronic showers (). The other physics requirement is a measurement of the transverse momentum, , of the neutron. This can be achieved by transverse segmentation of the calorimeter and its readout.
To minimize costs, as well as development and construction time, we chose to design the FNC as a lead-scintillator sandwich calorimeter read out by wavelength shifting light guides and photomultiplier tubes. A calorimeter of similar design built by the ZEUS calorimeter group was shown to compensate[7]. That calorimeter had a unit cell consisting of 1.0 cm of lead and 0.26 cm of scintillator. In hadron beams up to 100 GeV at CERN it proved to have an energy resolution of with a very small constant term. After correcting for transverse leakage of hadronic energy it had an electron to hadron ratio close to unity.
The containment of 95% of the energy of an 800 GeV hadronic shower requires 9-10 interaction lengths of absorber[8, 9]. To ensure this depth in the FNC we increased the ratio of lead to scintillator thickness from 4:1, which gives a compensating calorimeter, to 5:1, in order to meet the space restrictions in the HERA tunnel (see section 2.2). As a result, we expect the FNC to overcompensate (), at least for energies below 100 GeV; however, Monte Carlo studies[10] with FLUKA indicate that the ratio depends only weakly on the sampling fraction. Furthermore, FLUKA predicts a weak dependence of on the neutron energy. Hence the FNC should be close to compensating throughout the energy range up to 820 GeV.
Since the sampling term in the energy resolution function increases as the square root of the sampling fraction we expect a degradation of the energy resolution by 12%. More serious is the degradation due to transverse energy leakage. The Monte Carlo studies showed that the energy resolution of the calorimeter would be degraded to 60-70%/. This large sampling term will dominate the energy resolution even at the HERA kinematical end point of 820 GeV provided the constant term is held to 2% or better.
2.2 Description of the Calorimeter
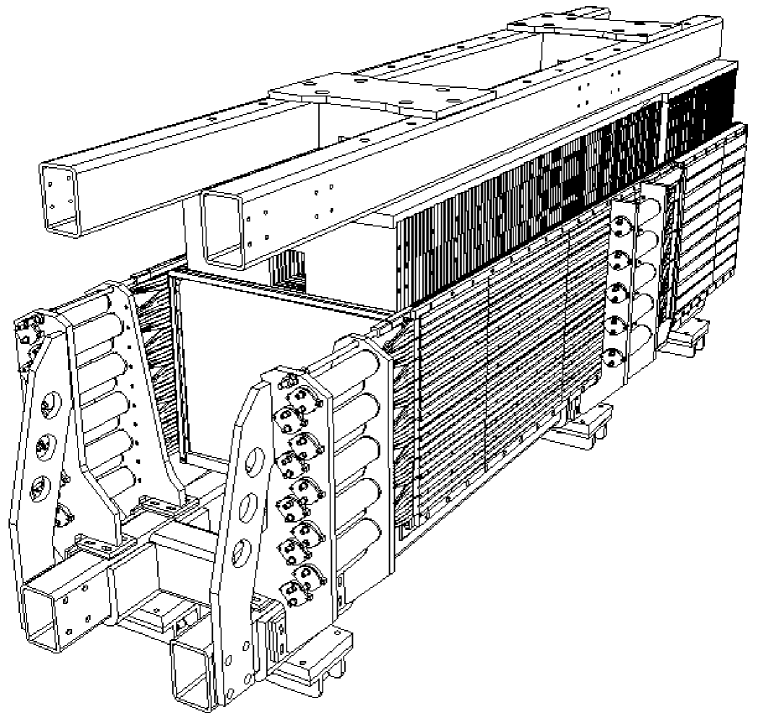
The FNC, built in two parts (Figs. 1 and 2), occupies a very restricted space in the HERA tunnel between the electron beam line and the tunnel wall, after the 6 mrad upward bend of the protons so that they can circulate above the electrons. It lies immediately in front of the beginning of the cold section of the proton machine. The available space beneath the proton beam pipe is limited in height to 50 cm. The zero degree line enters the calorimeter 16 cm below the beam pipe. The top part of height 20 cm was constructed to cap the bottom part by surrounding the beam pipe. The two parts together provide symmetrical up-down coverage, 35 cm in diameter. The total length, including readout and scintillation counters, is limited to 3 m. Since space is needed for PMT assemblies and scintillation counters both before and after the calorimeter, only about 2 m was available for the active calorimeter itself.
The calorimeter is 134 layers deep with a unit sampling cell as given in Table 1. The energy sampling fraction is 3% for minimum ionizing particles (mip) and 2% for electrons, as determined using GEANT. For readout, it is divided longitudinally into a front section of 95 layers and a rear ‘tail catcher’ of 39 layers. This division serves two purposes. By shortening the length of the wavelength shifter, it reduces the difficulty of ensuring the longitudinal uniformity of response (section 2.3). By having a shower tail catcher, late starting showers which have increased probability of large longitudinal energy leakage can be tagged. Since the rear is not needed for position measurements, its transverse segmentation is reduced.
| Material | Depth | Absorption Lengths |
| (cm) | ||
| Pb | 1.25 | 0.073 |
| scintillator | 0.26 | 0.003 |
| paper | 0.04 | 0 |
| air | 0.1 | 0 |
| total | 1.65 | 0.076 |
| 134 layers | 221.1 | 10.2 |
The calorimeter is read out on both sides by wavelength shifting light guides (WLS) and photomultiplier tubes (PMT). The sections of the calorimeter, namely, bottom front and rear, and top front and rear, have different widths. The maximum width of 74 cm was constrained by the presence of electron quadrupoles and radio-frequency cavities. Table 2 gives the nominal size of each section of the FNC.
| Section | layers | length | depth | height x width | tower size | PMT channels |
| (cm) | (cm x cm) | (cm) | ||||
| Bottom front | 95 | 156.75 | 7.2 | 50 x 70 | 5 | 20 |
| Bottom rear | 39 | 64.35 | 3.0 | 50 x 74 | 10 | 10 |
| Top front | 95 | 156.75 | 7.2 | 20 x 60.5 | 5 | 8 |
| Top rear | 39 | 64.35 | 3.0 | 20 x 64.5 | 10 | 4 |
The calorimeter readout is divided into vertical towers to permit a measurement of the impact position of the scattered neutron on the face of the calorimeter. This position is needed for the measurement of of the scattered neutron. The vertical position, , is determined by energy sharing between towers; the horizontal position, , by light (collected charge) division between the left and right sides; the HERA proton beam has an average angular spread at the interaction point of about 70 . This results in an intrinsic spread in the neutron impact position of 0.7 cm, independent of its . This intrinsic spread sets the limit for position resolution. With the assumption that the position resolution scales as , and the requirement that neutrons with 200 GeV have a position resolution better than 0.7 cm, we demand a resolution of 10 cm/. Experience with the uranium calorimeter[11] in ZEUS indicates that this can be achieved, vertically, with tower segmentation of 5 cm. The scintillator, SCSN-38, was cut into strips 4.94 cm high, and wrapped in white Tyvek paper. All the scintillator strips have the same height, including the ones in the rear section where vertical segmentation of the readout is 10 cm. Here each wavelength shifting light guide reads out two rows of scintillator strips.
The horizontal position resolution depends on , the number of photoelectrons collected, and on , the attenuation length of light in the scintillator strips. There is a contribution to the position resolution from shower fluctuations. For electrons, this is much less than the photostatistics contribution, while for hadrons we expect the fluctuation component to be larger, but the photostatistics component still dominant. The error on the horizontal position measurement is then [11]. The ZEUS uranium calorimeter collects 220 pe/GeV, and ZEUS tests[12] suggest that would be about 100 cm for the 70 cm x 5 cm x 0.26 cm scintillator strips. By assuming that the light collecting components of the FNC have similar optical properties to those of the ZEUS calorimeter, we estimate for the FNC from the ZEUS calorimeter number. Since the FNC has a smaller sampling fraction (3:9), longer tower widths (70:20), and transmission rather than backing masks for the WLS, we estimated the FNC would collect only 45 pe/GeV, for a resolution in of about 15 cm/.
2.3 Wavelength Shifter and Photomultipliers
An excellent wavelength shifting light guide material to match the SCSN-38 scintillator is Y7 in PMMA base (30 ppm doping); however, the manufacturer, Kuraray111Kurary Co., Tokyo, Japan., had only enough stock on hand for the rear section of the calorimeter, so the front section light guides were produced from similar material (BC-482A with 20 ppm doping) manufactured by Bicron222Bicron Corporation, Newbury Ohio, USA..
The WLS in FNC were made 0.4 cm thick to absorb as much as possible the light leaving the scintillator strips while still having the light guides match the size of the PMTs. So that longitudinal shower fluctuations do not degrade the energy response of the calorimeter, transmission masks were positioned between the WLS and the scintillator to correct for longitudinal attenuation of light along the WLS. The masks were a pattern of black lines printed on 3M overhead projector transparencies using a 300 dpi laser printer.
The attenuation lengths of the light guides were measured using equipment and procedures developed for the ZEUS calorimeter[2]. Figure 3 shows a comparison of the curves, before and after masking, for a sample light guide. For the front WLS the masking reduces the peak light yield at the PMT by 2.2; for the rear, the reduction is by 1.4. The transparency material itself accounts for some of this reduction since, as measured by a spectrophotometer, it transmits only 79% of incident light at a wavelength of 420 nm where the emission spectrum of SCSN-38 peaks.
After masking the response should be flat. A measure of the residual non-uniformity is the root mean square (rms) deviation from a constant of the corrected light curves. This averaged 2% of the mean.
Two types of photomultiplier tube were used: Phillips XP 2008/UB and Valvo XP 2011/03. Fifty pairs of tubes and resistive bases, which were spare from the ZEUS calorimeter tests at CERN, were obtained and tested in the ZEUS photomultiplier tube test facility to determine their characteristic gain and linearity.
2.4 Source Scans
We studied the FNC by scanning it with a 1 mCi 60Co source, a procedure developed by the ZEUS calorimeter group [13]. This allowed us to check the quality of the transmission masks, to look for construction problems, and to measure the relative gain of each channel.
A mechanical assembly equipped with a stepping motor moved the source through brass guide tubes fixed outside the calorimeter along the WLS. An IBM 486 PC containing an integrating ADC card controlled the stepping motors and measured current from the two PMTs viewing the tower along which the source was moving. Readings were taken about 0.15 cm apart.
Figure 4 shows a typical scan of a front tower, displaying the ADC output as a function of longitudinal position for the PMT on the side of the calorimeter opposite the source. Each scintillator layer is visible as a peak. As the source is withdrawn from the calorimeter, the response falls and flattens to become the pedestal which must be subtracted to obtain the gain. The steepness of the falloff at the edge of the calorimeter and the depth of the valley between peaks indicate that the general response is a superposition of several scintillator layers, as expected from the low energy (1.2 MeV) gamma rays emitted by 60Co.
To measure the pedestal and scintillation signals, a scan is projected onto the ordinate of the plot. The relative gain of a PMT, compared to all others, is obtained by comparing the fitted average peak position for its scan after subtraction of the pedestal. After correction for pedestal and relative gain, the projection of the peaks for all the scintillator layers in all towers is distributed approximately as a Gaussian, whose width to mean ratio (4.7%) is a measure of the uniformity of transmission of the optical system, including scintillator and masked WLS.
3 Test of the Calorimeter at CERN
Only the bottom part of the calorimeter was ready for testing at CERN in the summer of 1994. The calorimeter was installed in the H6 beam in the North Area of the SPS. This beam provided electrons, muons, pions and protons up to an energy of 120 GeV. The positively charged particle beam is mixed pions and protons with no particle identification[14]. Most of the data was taken at 120 GeV.
The calorimeter was placed on a table whose horizontal and vertical position were adjustable and measurable to cm. A pair of crossed finger counters in front of the calorimeter was used for triggering and to define the location of the beam (Table 3). Three large counters were also positioned in front of the calorimeter. The signal from the last dynode of each of the eight PMTs of the four central calorimeter towers was also available for triggering on calorimeter energy deposits.
| Counter | Description | Coverage |
|---|---|---|
| T1 | vertical finger counter | 1 cm x 0.5 cm |
| T2 | horizontal finger counter | 1 cm x 0.5 cm |
| T3 | 20 cm x 20 cm | |
| T4 | 15 cm x 15 cm x 5 cm | |
| T5 | muon counter | 20 cm x 20 cm |
| T6 | veto | 3 cm diameter hole |
The photomultipliers were read out with LeCroy 4300 charge integrating ADCs. The ADCs were gated so that 160 ns of the pulse from the calorimeter was integrated. During data taking the ADC pedestals were regularly measured, and the gains were monitored with an internal test function in the units. The gains were also checked daily using an external charge injector. Over the course of the beam test, which lasted one week, individual ADC gains varied less than 1 part per mil, and all gains were uniform to within 5 parts per mil.
3.1 Coordinate System
In the following we use a right-handed coordinate system with vertically up and into the face of the calorimeter. The origin (0,0) is taken to be between the two central towers halfway between the sides (the center of the face of the calorimeter). and are measurements of and based on the table position; and , measurements based on energy deposits in the FNC.
3.2 Measurement of Shower Position and Size
The vertical position of a shower is determined using the centroid method by taking an energy weighted average of the the tower positions:
| (1) |
where the sum is over towers in the front part of the FNC, and the weights are functions of the energy deposits, , in each tower. The weights are chosen to minimize bias and to maximize resolution in the position measurement. The simplest method of estimating corresponds to choosing weights which are linear in energy, . Awes et al.[15] have suggested that the weights be chosen to have instead a logarithmic dependence on the energy deposits:
| (2) |
where , and is a fractional cutoff. When the energy deposited in a tower satisfies , that tower is not used in the determination of the vertical position. The logarithmic dependence of the more closely matches the true transverse profile of energy deposits in a hadronic shower than the linear dependence. This estimator is simple, but it has an undetermined free parameter which may be a function of the deposited energy. In addition the optimal value of the cutoff parameter may depend on particle type, electron or hadron.
The vertical segmentation also allows us to estimate the size of the shower using the RMS vertical shower width:
| (3) |
Since the width of electromagnetic showers is much less than the width of hadronic showers, this estimator enables us to distinguish incident electrons from incident hadrons. The optimal weights for the width determination are not necessarily the same as those for the position measurement. Since we use the width to separate electromagnetic from hadronic showers, it is most convenient to have an estimator that does not depend on knowledge of the nature of the incident particle. Otherwise an iterative procedure must be employed. As we will discuss in more detail below, linear weights for the shower size measurement give a hadron-electron separation which is close to that obtained with logarithmic weights whose cutoff parameter has been optimized.
The horizontal position of a shower can be estimated from the division of scintillation light between the left and right sides of the calorimeter:
| (4) |
where is the effective attenuation length of the scintillator strips, and is the charge from the left(right) PMT. If the light attenuation behaves as
| (5) |
where , are constants, and is the displacement of the incident particle from the center of the tower, then is independent of and .
3.3 Electrons
The calorimeter was calibrated with 120 GeV electrons incident on the center of each tower. The high voltage for the tubes in the front was adjusted so that their mean response to 120 GeV electrons as measured in the Lecroy ADCs was 100 pC (400 counts). After lifting and rotating the calorimeter by 180 degrees to make electrons incident on the rear towers, the high voltage of each rear tube was set so that the response of the rear section to a muon passing through the calorimeter would approximately equal the response of the front section. Since the ratio of the number of front layers to the number of rear layers is 95/39, the gain is considerably higher in the rear; however, the energy deposits in the rear for electrons and hadrons are small, so there is no saturation problem for the very high energy particles at HERA. Figure 5a shows the distribution of deposited energy, after calibration, for 120 GeV electrons centered on towers 3 through 7, inclusive. Pion contamination has been removed be requiring that the vertical shower width be less than 3 cm (section 3.5). The energy resolution for electrons centered on a tower averaged 33%/ independent of tower. Electrons centered in the edge towers had an energy response reduced by 3% due to transverse energy leakage.
The response of the calorimeter to electrons is dependent on the position of the electron with respect to the gap between the scintillator strips. Figure 6a shows the energy deposited in tower 6 when the electron beam is scanned from tower 6 to tower 7. The total signal for electrons incident between two towers is 90% of the signal of an electron incident on the center of a tower. Moreover, the energy resolution is degraded to 60%/. These effects are due to the narrowness of electromagnetic showers compared to the width of the region between strips.
The small width of the shower compared with the strip width, combined with the reduction in response at the tower boundaries, is responsible for the large bias towards the tower center in the measured electron vertical position shown in Fig. 7. The bias grows with increasing cutoff parameter since for sufficiently large only the struck tower contributes to the sums in equations 1 and 3. The RMS deviation of the distribution also tends to increase. The variation with vertical position of the shower width (linear weights) of electrons is shown in Fig. 6b, and is small compared to the average width of hadronic showers (see Section 3.5).
Electrons were also used to determine the effective attenuation length for light in the scintillator strips. One half of each tower was scanned horizontally. For each position the response of the right and the left photomultiplier tubes was plotted as a function of the offset of the beam from the center of the calorimeter, positive representing an offset away from the PMT. Figure 8 shows the resulting attenuation curve for a typical tower. The response is well represented by equation 5. The tower-to-tower average value of was found to be 1.08 cm-1 with a 3% RMS spread, corresponding to an average effective attenuation length of 92 cm; averaged 9.60 cm-2 with a 20% RMS spread.
To compare the efficiencies of the wavelength shifting material in the front and rear section we measured the number of photoelectrons collected by the photomultiplier tubes, , which is related to the width, , of the difference distribution by
| (6) |
where is the mean of the sum. By rotating the calorimeter 180 degrees to make electrons incident both front and rear, we found that although in the rear we averaged 92 pe/GeV, in the front we obtained only 26 pe/GeV. This difference is due to different WLS lengths, WLS material, and optical geometry between front and rear, and it worsens the position resolution by a factor of compared to the estimate in section 2.2. Photostatistics makes only a small contribution to the energy resolution since, for 120 GeV electrons and 26 pe/GeV, the fluctuations are only about 2%.
3.4 Hadrons
Electron showers penetrate only about an interaction length into the calorimeter. To refine the calibration constants determined by electrons, 120 GeV pions were made incident on the center of each tower. Using these data, correction factors were determined which equalized the response of each PMT to hadrons. The correction factors for hadrons were forced to average 1.0, and had an RMS spread of 5%. The distribution of deposited energy for 120 GeV hadrons (pions and protons) incident on the center of the calorimeter, between towers 5 and 6, is shown in Fig. 5b. For pions incident in the center of each tower, the average response of the calorimeter is shown in Fig. 9. The curves are quadratic in . Leakage loss is important whenever the beam is outside the four central towers. When the beam is incident in the center of the calorimeter, between towers 5 and 6, about 2.5% of the energy is lost compared to the case when the beam is in the center of tower 5 or 6 because of the gap between the scintillator strips (see inset of Fig. 13). Parameterized as , the energy resolution for hadrons incident at the center of towers 5 and 6 is 0.70/ (Fig. 9). This improves to 0.62/ for hadrons incident at the center of the calorimeter, between towers 5 and 6.
These results can be compared to the results for electrons discussed above. The electron to hadron ratio is 0.96 when the beams are incident on the center of a tower, but it falls to about 0.9 when both are incident on the center of the calorimeter in the gap between towers 5 and 6. For electrons centered on a tower, but hadrons incident on the center of the calorimeter (see Fig. 5). If the electron calibration constants are used instead of the hadron calibration constants, changes by 0.01. As expected from the ratio of lead to scintillator thickness, the calorimeter is over compensating. This effect is magnified for electrons by the gap between the scintillator strips; however, since compared to the electrons the electromagnetic component of a hadronic shower is more spread out transversely, we expect the ‘effective’ to be higher.
In order to study energy leakage and position resolution for hadrons, the face of the calorimeter was scanned with 120 GeV pion over an grid. Using this grid the effective attenuation length of the scintillator was determined with hadronic showers. The resulting average attenuation length, 91.9 cm, was in good agreement with the electron scan results.
Figure 10 shows the true vertical position of the calorimeter as a function of its position determined using the centroid algorithm with linear weights (). The effect of the finite strip size is clearly evident in the oscillation superimposed on an average behavior. In addition, towards the edge of the calorimeter the measured value falls below the true value because of leakage. The average behavior can be parameterized conveniently as . The residuals, shown in the upper inset, follow an approximate sine curve with period 5 cm, the tower height.
The overall vertical resolution is determined by plotting the residuals for the centroid algorithm with the polynomial correction for all points of the grid. The residual distribution is well fit by a sum of two Gaussian (Fig. 11a). The largest component has a weight of 0.91 and an RMS width of 0.8 cm for 120 GeV pions. Because this width is larger than the size of the oscillation, the position cannot be corrected for the oscillation on an event by event basis.
In contrast to linear weights, logarithmic weights depend on an arbitrary cutoff parameter which may be chosen to optimize the position resolution, minimizing bias. Residuals for logarithmic weights with are shown in the lower inset in Fig. 10 and in Fig. 11b. The bias due to leakage has been considerably reduced (), and the resolution improved, compared with the use of linear weights.
A measure of the effective overall resolution is
| (7) |
where is the variance of Gaussian , and is its fractional contribution to the overall distribution. The resulting is plotted in Fig. 12 as a function of . The best vertical position resolution for 120 GeV pions is 8 cm/ for , where the curve has a minimum.
Like the residuals, the distribution of residuals is also well represented by a sum of two Gaussians: 97% with cm/, and 3% with cm/, giving cm/. The resolution in is much poorer than in ; nevertheless, it is close to the value expected since for 1 GeV incident energy
| (8) |
The energy response varies over the grid as a result of two competing effects: a) energy leakage, and b) light enhancement. As the beam is moved towards the edge of the calorimeter, energy is lost due to leakage, and the measured signal tends to decrease. On the other hand, as the beam moves horizontally away from the center the light collected by the PMTs increases because of the characteristic light attenuation of the scintillator strips:
| (9) |
The net result is that the signal increases for horizontal displacements at fixed . The increase is approximately linear in with
| (10) |
Figure 13 shows the energy response as a function of y for all grid values with the dependence removed. Energy loss due to the gap between the scintillator strips is clearly visible as is also loss due to leakage. The leakage component has a quadratic dependence in ; the loss due to the gaps between strips behaves as a superposed oscillation.
3.5 Electron-Hadron Separation
A calorimetric measurement with the capability of distinguishing between electromagnetic and hadronic showers is important for physics studies. Because electromagnetic showers are much narrower than hadronic showers, the measurement of the shower width allows a separation of particles by type. The use of logarithmic weights for the determination of the vertical shower position reduces the bias due to the finite strip size and lateral leakage, and improves the resolution; however, the optimal choice of the cutoff parameter depends on incident particle type. At 120 GeV, should be chosen to be about 10% for hadrons, but should be close to 0 (no cutoff) for electrons.
The choice of cutoff for the width measurement can be chosen to optimize the separation of electromagnetic and hadronic showers. To estimate the optimal value of we define
| (11) |
as a measure of the electron-hadron separation, where and are the means and standard deviations, respectively, of the width distributions for hadrons () and electrons (). All are implicitly functions of the cutoff , so the value of can be chosen to maximize .
The dependence of on for 120 GeV electrons and hadrons is shown in Fig. 14. is insensitive to at low values of , but falls approximately linearly for %. Linear weights give the result shown by the dashed line, , close to best values obtained with logarithmic weights, and have the advantage of being independent of , which may depend on the incident energy. As a result, we use linear weights for measurement of shower widths instead of the logarithmic weights chosen for the shower centroid measurement.
The vertical width distribution is plotted in Fig. 14b and c for 70 and 120 GeV electrons and pions incident on towers 2 through 9. Although the distributions do not change much with energy, there is a small reduction in spread and decrease in mean. Figures 14c and 15a show that mean and standard deviation of the shower width distribution for hadrons does not change significantly with the incident vertical position. A cut chosen in the range 2-4 cm will clearly separate electrons from hadrons. Only 2.3% of hadrons incident at the center of the calorimeter will be lost with a cut of 3.5 cm; the loss rises to 4.0% for hadrons incident at the center of a strip (Fig. 14).
The same analysis for electrons is complicated by pion contamination in the electron sample, which is shown as a broken line in Fig. 14. To subtract the pion contamination, we normalize the width distribution for pions to the raw (unsubtracted) distribution for electrons in the region cm. The result is shown in Fig. 15b for electrons incident in the center of a tower, and electrons scanned vertically from tower 6 to 7. The inset shows the tail of the distribution for centered electrons. About 1.5% of the electron showers have a width greater than 3.5.
3.6 Muons
Although the signal from penetrating muons is low because of their small energy deposits, they can be useful for calibrating and monitoring the FNC in HERA using either cosmic rays or beam halo muons. To study the response of the calorimeter to high energy muons, a special trigger was implemented for beam particles which penetrated the calorimeter. Figure 16 shows a typical energy distribution for a muon in the bottom front tower. The peak position is determined by fitting the distribution to a convenient functional form:
| (12) | |||||
and , , , and are parameters. When , is the Moyal function[16], an analytic approximation for the Landau distribution. The tower-to-tower spread of the peak position is 4%.
3.7 Neutrons
The absolute energy scale is best determined by making a beam of known energy incident on the calorimeter. If deuterons were to be accelerated at HERA, nuclear stripping reactions would make neutrons of known energy incident on the calorimeter. At present only protons are accelerated, and the absolute energy scale must be determined using beam gas interactions which produce leading neutrons by charge exchange. If deuterons were accelerated at HERA in order to test the feasibility of using charge exchange reactions to determine the absolute energy scale, a short experiment was performed.
Figure 17 shows the experimental arrangement. A lucite target was placed in the beam 20 m in front of the calorimeter. Immediately after the target a sweeping magnet was tuned to deflect beam particles downward. With the magnet tuned to full field beam particles ( protons and pions ) were deflected downwards by 11 cm at the calorimeter. It was necessary to devise a trigger that ensured that only events arising from the impact of a neutral particle in the central part of the calorimeter were accepted.
Crossed finger counters in front of the target defined the beam position (see Table 3 and Fig. 17). The trigger required a coincidence of these two counters and energy deposited in the center of the calorimeter For the trigger, the deposited energy was measured by summing and discriminating the signals from the last dynode of the PMTs of the four central towers. In order to veto charged particles, three scintillation counters were placed directly in front of the calorimeter. In addition, only showers near the center of the calorimeter were considered in order to reduce energy leakage. In summary the data were required to satisfy:
| (13) | |||
| (14) | |||
| (15) | |||
| (16) |
where
| (17) |
The shower position was determined by light division; , by the centroid method with logarithmic weights.
The observed energy distribution is shown in Fig. 18. In the same figure, the hatched histogram shows the response of the calorimeter to 120 GeV hadrons. The mean value of the latter distribution determines the energy scale for the figure.
The one pion exchange (OPE) model of the reaction predicts that the cross section, integrated over scattering angles, is given by
| (18) |
where is the flux of virtual pions associated with the incoming proton; is the total pion-target cross section for a virtual pion beam energy of . Any dependence of on the virtuality of the exchanged pion has been ignored in equation 18, so can be estimated using a parameterization ( GeV), or an interpolation table ( GeV)[17]. Several forms have been postulated for the flux factor in theoretical and phenomenological studies of OPE. They fall into two classes: Regge[18, 19, 20] and light cone[21].
Accordingly, to compare data and theory, we extended the HERWIG[22] Monte Carlo program to generate events according to OPE folded with the measured experimental resolutions. The predicted energy distribution, for the light cone flux factor[21], adjusted for resolution and acceptance is shown as the open histogram in Fig. 18. The OPE prediction is normalized to the data by the number of events. As can be seen, agreement is good for energies larger than 100 GeV.
The energy scale was varied and then compared with the OPE prediction for GeV by computing the of the difference distribution. The variation of with the scale factor is shown in the inset to Fig. 18. The minimum occurs for a scale factor of 0.985. If the Regge[19, 4] form for the flux factor is used instead, the same procedure yields a minimum at 1.003, in complete agreement with the incident proton beam; in this case, however, the minimum is worse (17 rather than 10). We conclude that using charge exchange neutrons the absolute energy scale can be determined to better than 1.5% with the chief source of error being the theoretical uncertainty on the form of the virtual pion flux factor.
4 Monte Carlo Studies of the FNC
Since the spring of 1995, the FNC has been operating in the ZEUS experiment at HERA where it is used in the study of leading neutrons produced at small angles with energies 100 GeV. Because the calorimeter has been calibrated and tested only in beams of energy up to 120 GeV, and because the top was not present for the beam tests, we must rely on a Monte Carlo simulation to predict the response of the calorimeter to high energy particles. We have modeled the FNC using the GEANT 3.13[23] program, upon which the simulation of the full ZEUS detector is based. In this section we present some results from the simulation which can be compared to our test beam data.
For 120 GeV electrons and pions incident on the center of towers 5 and 6 the GEANT simulation predicts an electron to hadron response ratio of 0.98, in agreement with the measured value of 0.96. The simulated response to pions incident on the center of each tower is shown in Fig. 19. The energy loss due to leakage when the beam is incident near the edge of the calorimeter is also in agreement with the data as is the degradation of the energy resolution (compare with the data shown in Fig. 9).
The Monte Carlo gives an energy resolution due to shower fluctuations alone, that is, neglecting fluctuations due to photostatistics, of 0.66/ for hadrons incident at the center of towers 5 and 6. We have also used the Monte Carlo to predict, at higher energies, the overall energy response of the calorimeter and its expected energy resolution due to shower fluctuations. The Monte Carlo predicts that for neutrons centered on the calorimeter without the top, the energy response is linear up 800 GeV. Fitting the energy resolution as a function of incident energy, we find
| (19) |
where is in GeV. If fluctuations due to photostatistics are added, the sampling constant 0.54 will increase to 0.58. The top section is present at HERA, but the neutrons are predominantly incident on towers 7 and 8.
Just as for data, 120 GeV pions were studied with a grid over the face of the calorimeter. Fig. 20 shows the predicted dependence of on , the vertical impact position, for three values of horizontal impact position, , 10.1, and 20.1 cm. is calculated with logarithmic weights and a cutoff parameter of f=10%. The simulation shows behavior and biases similar to the data (Fig. 10, lower inset); in particular, the value of is biased towards the nearest tower center. The residual distribution is Gaussian with mean 0 and width 7.3 cm/ (compare to the data width of 8.0 cm/). The residual distribution is Gaussian with mean 0 and width 10.3 cm/. This width is due to transverse shower fluctuations. If photostatistics fluctuations are also included, the width constant increases to 20.7 cm. This should be compared with the data value of 22.3 cm.
5 Summary
We have designed and constructed a lead scintillator sandwich calorimeter for the ZEUS experiment at HERA. The calorimeter is divided into 5 cm vertical towers read out on two sides with wavelength shifting light guides coupled to photomultiplier tubes. The calorimeter was tested in the H6 beam line at CERN with 120 GeV electrons, muons, pions and protons. Electrons can be cleanly separated from hadrons using the energy weighted vertical width of a shower. At 120 GeV the calorimeter is slightly over compensating, with an electron to hadron response ratio of 0.96 and an energy resolution 6% at 120 GeV. The horizontal position resolution, measured by charge sharing between the two sides, is 20 cm/, assuming a dependence; the vertical position resolution, measured by energy sharing between the towers, is 10 cm/. By using energetic neutrons produced by proton interactions in a lucite target, the overall energy scale was determined to 1.5%.
Since the spring of 1995, the calorimeter has operated successfully in the HERA tunnel 105.6 m downstream of the ZEUS detector on the zero degree line.
Acknowledgments
We thank T. Tymieniecka for modeling the FNC during the design stage, and using FLUKA to study its energy resolution and response. E. Borsato, F. Czempik, C. Fanin, R. Fernholz, T. Kiang, K. Loeffler, H. Stehfest, V. Sturm, and K. Westphal provided us with much help constructing the calorimeter, shipping it to CERN, and installing it in the HERA tunnel. M. Roseman helped with the PMT tests and at CERN. We thank M. Brkić for his assistance in setting up the computer readout system for the CERN tests. B. Racky kindly arranged for us the transport of our 60Co source to and from CERN. We also thank F. Dittus for making available the adjustable table on which we mounted the calorimeter, and K. Elsener for his invaluable assistance with the H6 beam. We are also grateful to CERN for making the beam test possible. J. Prentice helped with cosmic ray tests during the initial stages. The ZEUS collaboration has been continually enthusiastic and supportive, in particular, R. Klanner, G. Wolf and U. Koetz. We also thank the HERA machine group who helped install the FNC, and who provided the beam line modifications which greatly enhance the performance for physics of the FNC. Finally, we especially thank the DESY directorate for the continual interest they have shown in the project, and for the financial support they provided.
References
- [1] A. Caldwell, ZEUS Collaboration, Proc. of the XXVIth Int. Conf. on High Energy Physics, Dallas, August 1992.
- [2] ZEUS Collaboration, The ZEUS detector, status report, 1993, U. Holm, ed., DESY PRC 93-05.
- [3] S. Bhadra et al., Nucl. Instr. and Meth. A354 (1995) 479.
- [4] ZEUS Collaboration, M. Derrick et al., Phys. Lett. B384 (1996) 388.
- [5] ZEUS Collaboration, M. Derrick et al., Initial Study of Leading Neutrons in Collisions, ICHEP94, Glasgow, Ref 0692 (1994).
- [6] M. Brkić, A Study of Leading Neutrons in Collisions at HERA, Ph. D. thesis, University of Toronto, 1995, unpublished.
- [7] E. Bernardi et al., Nucl. Instr. and Meth. 262 (1987) 229.
- [8] D. Bintinger, in Proceedings of the workshop on calorimetry for the supercollider, Tuscaloosa, AL, March 13-17, 1989, R. Donaldson and M. G. D. Gilchriese, ed., (World Scientific, Teaneck, NJ, 1989), p. 91.
- [9] R. K. Bock, T. Hansl-Kozanecka, and T. P. Shah, Nucl. Instr. and Meth. 186 (1981) 533.
- [10] T. Tymieniecka, Simulation of hadronic showers in the Forward Neutron Calorimeter, 1994, unpublished.
- [11] A. Andresen et al., Nucl. Instr. and Meth. A309 (1991) 101.
- [12] G. D’Agostini et al. Nucl. Instr. and Meth. A274 (1989) 134.
- [13] U. Behrens et al., Nucl. Instr. and Meth. A323 (1992) 611.
- [14] H. W. Atherton et al., Precise measurements of particle production by 400 GeV/c protons on beryllium targets, CERN 80-07 (1980).
- [15] T. C. Awes, F. E. Obenshain, F. Plasil, S. Saini, S. P. Sorensen and G. R. Young, Nucl. Instr. and Meth. A311 (1992) 130.
- [16] J. E. Moyal, Phil. Mag. 46 (1955) 263.
- [17] Particle Data Group, L. Montanet et al., Phys. Rev. D50 (1994) 1335.
- [18] M. Bishari, Phys. Lett. 38B (1972) 510.
- [19] G. Levman and K. Furutani, Virtual pion scattering at HERA, DESY Report 95-142 (1995).
- [20] B. Kopeliovich, B. Povh, and I. Potashinikova, Deep-inelastic electroproduction of neutrons in the proton fragmentation region, HEP-PH/9601291 and DESY Report 95-11 (1996).
- [21] H. Holtmann, G. Levman, N. N. Nikolaev, A. Szczurek, and J. Speth, Phys. Lett. B 338 (363) 1994.
- [22] G. Marchesini et al., Comput. Phys. Commun. 67 (1992) 465.
- [23] R. Brun et al., GEANT3, CERN DD/EE/84-1 (1987).