Fermilab-Conf-96/353 November 1996
Electroweak Measurements from the Tevatron‡‡‡Invited talk given at the Workshop on New Directions for High Energy Physics (Snowmass 96), Snowmass, Colorado, June 25 – July 12, 1996.
Marcel Demarteau Fermilab
Batavia, IL 60510, USA
An overview of recent electroweak physics results from the Tevatron is given. Properties of the and gauge bosons using final states containing electrons and muons based on large integrated luminosities are presented. In particular, measurements of the and production cross sections, the -charge asymmetry and the measurement of the -mass are summarized. Gauge boson self interactions are measured by studying gauge boson pair production and limits on anomalous gauge boson couplings are discussed.
Abstract
An overview of recent electroweak physics results from the Tevatron is given. Properties of the and gauge bosons using final states containing electrons and muons based on large integrated luminosities are presented. In particular, measurements of the and production cross sections, the -charge asymmetry and the measurement of the -mass are summarized. Gauge boson self interactions are measured by studying gauge boson pair production and limits on anomalous gauge boson couplings are discussed.
1 Introduction
The Standard Model of electroweak interactions (SM) has taken a very prominent position in today’s description of experimental results. Perhaps the most compelling reason for this state of affairs is that the experimental results have reached a level of precision which require a comparison with theory beyond the Born calculations, which the SM is able to provide. It is widely anticipated, though, that the SM is just an approximate theory and should eventually be replaced by a more complete and fundamental description of the underlying forces in nature. Since the highest center of mass energies are reached at the Tevatron, the measurements at this accelerator provide natural tools to probe the SM at the highest energy scale.
In this summary the most recent electroweak results from the Tevatron will be described, with the emphasis on results from the collider experiments CDF and DØ. The CDF and DØ detectors are large multi-purpose detectors operating at the Fermilab Tevatron Collider [1, 2]. The DØ detector has a non-magnetic inner tracking system, compact, hermetic, uranium liquid-argon calorimetry and an extensive muon system. The CDF detector has a magnetic central detector, scintillator based calorimetry and a central muon system. During the 1992-1993 run, generally called Run 1a, the CDF and DØ experiments have collected 20 pb-1 and 15 pb-1 of data, respectively. For the 1994-1995 run (Run 1b) both experiments have collected 90 pb-1 of data. The CCFR experiment at Fermilab studies -nucleon interactions. The measurement of the ratio of charged and neutral current cross sections provides a direct measurement of the weak mixing angle. Results on the and production cross sections, the -width, -charge asymmetry and the mass of the -boson are presented. In the last section moments of the gauge boson are discussed.
2 IVB Production Cross Sections
In collisions intermediate vector bosons are produced predominantly by quark-antiquark annihilation. In approximately 80% of the interactions a valence quark is involved. Sea-sea interactions contribute 20% to the total cross section. The leptonic decay modes of the and -bosons are easily detected because of their characteristic decay signatures: for a decay a high lepton accompanied by large missing transverse energy (), indicating the presence of a neutrino, and two high leptons for -decays. The measurement of the and production cross sections probes the SM of electroweak and strong interactions and provides insight in the structure of the proton. With the large increase in integrated luminosity the new measurements have a significantly improved precision. A persistent uncertainty on any cross section measurement at a collider, however, is the large uncertainty on the integrated luminosity due to the uncertainty on the effective total cross section seen by the detectors. This uncertainty cancels completely in the ratio of the and production cross sections, a quantity that can be used to extract the width of the -boson, . The event selection is thus geared towards maximizing the cancellation of the different uncertainties in the ratio of the two cross section measurements.
| DØ | CDF | |||
|---|---|---|---|---|
| cand. | 59579 | 4472 | 13796 | 6222 |
| AW (%) | 43.4 1.5 | 20.1 0.7 | 34.2 0.8 | 16.3 0.4 |
| (%) | 70.0 1.2 | 24.7 1.5 | 72.0 1.1 | 74.2 2.7 |
| Bkg (%) | 8.1 0.9 | 18.6 2.0 | 14.1 1.3 | 15.1 2.2 |
| (pb-1) | 75.9 6.4 | 32.0 2.7 | 19.7 0.7 | 18.0 0.7 |
| cand. | 5702 | 173 | 1312 | 423 |
| AZ (%) | 34.2 0.5 | 5.7 0.5 | 40.9 0.5 | 15.9 0.3 |
| (%) | 75.9 1.2 | 43.2 3.0 | 69.6 1.7 | 74.7 2.7 |
| Bkg (%) | 4.8 0.5 | 8.0 2.1 | 1.6 0.7 | 0.4 0.2 |
| (pb-1) | 89.1 7.5 | 32.0 2.7 | 19.7 0.7 | 18.0 0.7 |
and events are normally recorded using a common single lepton trigger. The event selection for -bosons requires an isolated lepton with transverse momentum GeV and GeV. Leptonic decays of -bosons are selected by imposing the same lepton quality cuts on one lepton, and looser requirements on the second lepton. Table 1 lists the kinematic and geometric acceptance (AV), trigger and event selection efficiency () and background (Bkg) for the electron and muon decay channel for the two experiments ( or ) [3, 4, 5].
The vector boson inclusive cross section times decay branching ratio follows from the number of background subtracted observed candidate events, corrected for efficiency, acceptance and luminosity:
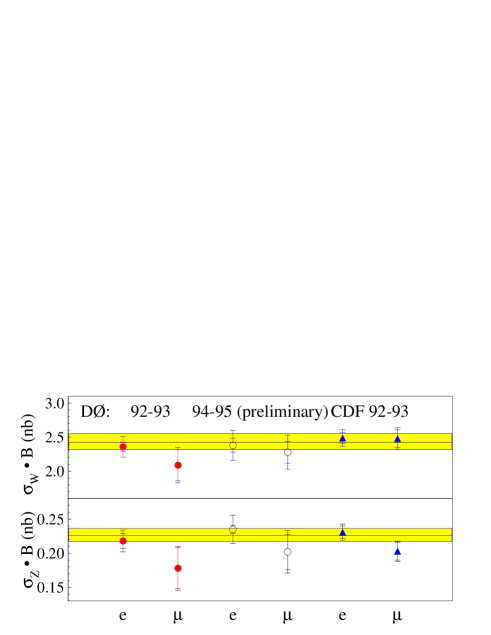
Here is the observed number of events and the number of expected background events. indicates the branching ratio of the vector boson for the decay channel under study. The measured cross sections times branching ratio are listed in Table 2 and are compared with the theoretical prediction in Fig. 1. The theoretical predictions for the total production cross section, calculated to [6], depend on three input parameters: the mass of the -boson, taken to be GeV/c2, the mass of the -boson, GeV/c2 [7], and the structure of the proton. Using the CTEQ2M parton distribution functions [8], the prediction for the total cross sections are = 22.35 nb and = 6.708 nb. Using the leptonic branching ratio , as calculated following reference [9] using the above quoted -mass, and as measured by the LEP experiments [10], the theoretical predictions for the total inclusive production cross section times branching ratio are nb and nb. The two largest uncertainties on the theoretical prediction are the choice of parton distribution function (4.5%) and the uncertainty due to using a NLO parton distribution function with a full theoretical calculation (3%). The experimental error is dominated by the uncertainty on the luminosity.
| 1992-1993 | ||
|---|---|---|
| DØ (e) | 2.36 0.02 0.15 | 0.218 0.008 0.014 |
| DØ () | 2.09 0.06 0.25 | 0.178 0.022 0.023 |
| CDF (e) | 2.49 0.02 0.12 | 0.231 0.006 0.011 |
| CDF () | 2.48 0.03 0.16 | 0.203 0.010 0.012 |
| 1994-1995 | ||
| DØ (e) | 2.38 0.01 0.22 | 0.235 0.003 0.021 |
| DØ () | 2.28 0.04 0.25 | 0.202 0.016 0.026 |
The ratio of the cross section measurements in which the error on the luminosity, common to both the and events, completely cancels measures the leptonic branching ratio of the -boson. It can be used, within the above framework, to extract the total width of the -boson:
which gives
Using the SM prediction [9] for the partial decay width the total width is given by
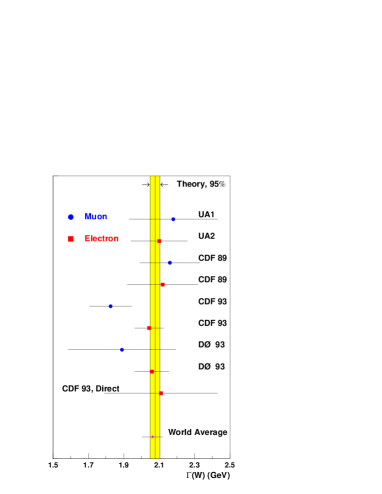
The ratio of the cross sections, using again the calculation of [6], is determined to be 3.33 0.03. The error is again dominated by the choice of parton distribution functions. Note that in the ratio the theoretical uncertainties also largely cancel. Using, as before, the measured branching ratio and the theoretical prediction for the partial decay width = 225.2 1.5 MeV [9] the leptonic branching ratio, as determined from the combined DØ electron and muon 1992-1993 data, is (11.02 0.5)%; the CDF measured branching ratio, based on the 1992-1993 electron data is (10.94 0.33 0.31)%. Using the calculated partial leptonic branching ratio, these measurements yield for the width GeV [5] and GeV [3], respectively. The CDF value differs from their published value due to the use of more recent experimental measurements in evaluating the input parameters. Figure 2 shows the world -width measurements together with the theoretical prediction [3, 5, 11, 12].
Taking into account that the ratio of the total cross sections is slightly different at a center of mass energy of 630 GeV ( GeV) = 3.26 0.09), and accounting for the correlation between the measurements at different center of mass energies through the choice of parton distribution functions, the different values of can be combined to give a world average of GeV, a measurement at the 3% level. This is in good agreement with the SM prediction of GeV. The comparison of the measurement with the theoretical prediction can be used to set an upper limit on an “excess width” , allowed by experiment for non–SM decay processes, such as decays into supersymmetric particles or into heavy quarks. Comparing the above world average value of with the SM prediction a 95% C.L. upper limit of MeV on unexpected decays can be set.
Since the intermediate vector bosons are produced through a Breit–Wigner resonance the line shape of the mass distribution contains information about the width of the boson. For -bosons, the high tail of the transverse mass distribution, where the Breit-Wigner shape dominates over the detector resolutions, can be used to extract . Using a binned log–likelihood method, CDF has fit the transverse mass111Transverse mass is defined as the invariant mass of the lepton and the neutrino of the -decay in the transverse plane (see section 5). () distribution far above the pole ( GeV/c2) to Monte Carlo generated templates with varying -width [13]. Using this method the -width has been determined to be GeV, where the systematic error (8%) is dominated by uncertainties in modelling the transverse momentum distribution (6%) and the resolution (5%). Although the precision of this method is currently not competitive with the extraction of the width from the ratio of cross sections, it has the advantage that it is relatively independent of SM assumptions.
3 Drell-Yan Production
One of the unique features of collisions is the large range of available partonic center of mass energies. This allows for a study of the line shape through the Drell-Yan process ( over a large di-lepton invariant mass region. The low invariant mass region allows access to the small region of the parton distribution functions down to , where is the fraction of the proton momentum carried by the parton. The region well above the pole is the region where the interference effects are strongest. A possible substructure of the partons would manifest itself most prominently in a modification of the interference pattern. Substructure of partons is most commonly parametrized in terms of a contact interaction [14], characterized by a phase, , leading to constructive () or destructive interference () with the SM Lagrangian, and a compositeness scale, , indicative of the energy scale at which substructure would be revealed. By fitting the di-lepton invariant mass spectrum to various assumptions for the compositeness scale and the phase of the interference, lower limits on the compositeness scale can be set.
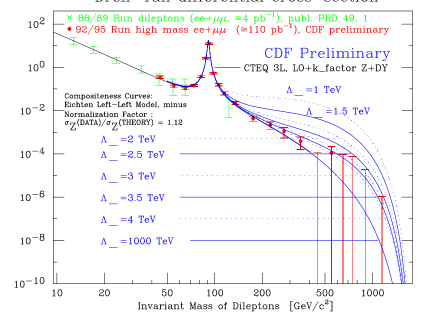
The CDF experiment has measured the double differential Drell-Yan cross section for electron and muon pairs in the mass range GeV/c2 for the Run 1a data [15], and GeV/c2 for the Run 1b data. The di-electron invariant mass spectrum is measured over the rapidity interval . Due to a more restricted coverage, the muon cross section has been determined only over the range . Figure 3 shows the measured cross section for electrons and muons combined. The curves correspond to a leading-order calculation of the Drell-Yan cross section with in addition a contact interaction of left-handed quarks and leptons with positive interference for different values of the compositeness scale. Higher order effects have been included through the use of a constant -factor of . The curve for TeV indicates the SM prediction. The data is clearly inconsistent with low values. Performing a maximum likelihood fit yields scale factors for the electron data of 3.4 TeV, 2.4 TeV and for the muon data of 3.5 TeV, 2.9 TeV. Combining both channels yields 2.9 TeV and 3.8 TeV. This implies that up to a distance of cm the interacting particles reveal no substructure.
4 Forward-Backward Asymmetry
Because the left-handed and right-handed coupling of fermions to the boson are not the same, the angular distribution of the outgoing fermion with respect to the incoming fermion in the parton center of mass frame, has a term linear in [16]. The angular distribution is thus asymmetric and will exhibit a forward-backward asymmetry, defined as
where is the cross section for fermion production in the forward hemisphere () and, correspondingly, for the backward hemisphere (). Due to the changing polarization of the boson as function of center of mass energy, has a strong energy dependence. Since the couplings of the fermions to the boson depend on the fermion weak isospin and charge, is different for different initial and final states. For the Drell-Yan process no distinction can be made between and initial states and therefore the asymmetry measured will be a convolution of both. It is interesting to note that this process is the time-reversal of the corresponding process at -machines and the measurements are complementary. At LEP and SLC the measurements are free from parton distribution function uncertainties, whereas at the Tevatron, the light quark asymmetries are free from fragmentation uncertainties.
The CDF experiment has measured using the full Run I data set for di-electron final states with and [17]. The data sample is divided into two invariant mass regions: a pole region, 75 105 GeV/c2 with 5463 events and a high mass sample, 105 GeV/c2 with 183 events. Figure 4 shows the event count in for the high mass sample. The dashed line is the raw data distribution and already shows a clear forward-backward asymmetry. The points are the corrected data compared to the SM prediction using the MRSA parton distribution function [18]. The background in the pole-region is dominated by QCD di-jet events where both jets either contain or fake an electron. It has been estimated to be events. In the high mass region the background is relatively small but has a large uncertainty, events, which dominates the systematic uncertainty on the measurement in this mass region. Because of the finite mass resolution, events will migrate between the two mass regions. The deconvolution of the mass resolution is performed with a Monte Carlo simulation and results in a correction on of in the high mass region and in the pole region. The corrections for angular acceptance have also been determined from Monte Carlo simulations. The analysis yields for 75 105 GeV/c2, and for 105 GeV/c2, compared to the SM predictions of and , respectively.

Even though in the high mass region the asymmetry is measured with a rather large error, these measurements still serve as a probe of extensions of the SM because models with additional heavy neutral gauge bosons can substantially alter . For example, Fig. 5 from [19] shows for as function of the partonic center of mass energy for the SM (solid line) and for various models with an additional neutral heavy gauge boson with a mass of 500 GeV/c2. A modest event sample at a center of mass energy of allowing an unambiguous sign determination of , would already put constraints on extended gauge sectors in the SM.

5 -mass
The mass of the -boson is one of the fundamental parameters of the SM. A precision measurement of the -boson mass allows for a stringent test of the radiative corrections in the SM. Combined with the measurement of the mass of the top-quark and precision measurements from and neutrino scattering experiments, inconsistencies between the different measurements can be looked for, possibly indicating processes beyond the SM.
In events produced in a hadron collider in essence only two quantities are measured: the lepton momentum and the transverse momentum of the recoil system. The latter consists of the “hard” -recoil and the underlying event contribution. For -events these two are inseparable. The transverse momentum of the neutrino is then inferred from these two observables. Since the longitudinal momentum of the neutrino cannot be determined unambiguously, the -boson mass is determined from the line shape in transverse mass, defined as
Here is the angle between the lepton and neutrino in the transverse plane.
Both the transverse mass and lepton transverse momentum are, by construction, invariant under longitudinal Lorentz boosts. The quantity transverse mass is preferred over the lepton transverse momentum spectrum because to first order it is independent of the transverse momentum of the . Under transverse Lorentz boosts along a direction , and transform as
with , and . The asterisks indicate quantities in the rest frame. The lepton transverse momentum depends linearly on whereas the dependence of the transverse mass is second order in . The disadvantage of using the transverse mass is that it uses the neutrino transverse momentum which is a derived quantity. The neutrino transverse momentum is equated to the missing transverse energy in the event, which is given by
where is the transverse momentum of the -recoil and the transverse energy flow of the underlying event, which depends on the luminosity. It then follows that the magnitude of the missing vector and the true neutrino momentum are related as . This relation can be interpreted as the definition of the neutrino momentum scale. Note that the underlying event gives rise to a bias in the measured neutrino momentum with respect to the true neutrino momentum. When there are more interactions per crossing behaves as a two-dimensional random walk and is proportional to , where is the number of interactions per crossing. The shift in measured neutrino momentum is thus directly proportional to the number of interactions per crossing. The resolution increases as . At high luminosities alternate methods to determine the -mass may therefore be advantageous [20].
Since there is no analytic description of the transverse mass distribution, the -mass is determined by fitting Monte Carlo generated templates in transverse mass for different masses of the -boson to the data distribution. This distribution exhibits a Jacobian edge characteristic of two-body decays which contains most of the mass information. For the -mass determination both the energy scale for the lepton and recoil system, which determine the peak position of the transverse mass distribution, as well as the resolutions on the measured variables, which control the steepness of the Jacobian edge, are crucial.
The CDF mass analysis discussed here is based on the Run 1a data [21]. The DØ mass analysis also includes a preliminary result from the Run 1b data [22]. In the CDF -mass analysis the momentum scale of the central magnetic tracker is set by scaling the measured -mass to the world average value using decays. Based on a sample of approximately 60,000 events a scale factor of 0.99984 0.00052 has been derived. The dominant contribution to the error comes from the uncertainty in the amount of material the muons traverse. This procedure establishes the momentum scale at the -mass, where the average muon is about 3 GeV/c, and needs to be extrapolated to the momentum range appropriate for leptons from -decays. The error due to possible nonlinearities in the momentum scale is addressed by studying the measured -mass as function of , extrapolated to zero curvature. This extrapolation, which includes an uncertainty on a possible non-linearity of the momentum measurement, increases the error on the momentum scale to 0.00058 at the -mass. This results in an error on the -mass of 50 MeV/c2.
Having established the momentum scale, the calorimeter energy scale is determined from a line shape comparison of the observed distribution with a detailed Monte Carlo prediction as shown in Fig. 6. A two-dimensional fit of Monte Carlo generated distributions in the energy scale and the electron momentum resolution is used to establish the absolute calorimeter energy scale. The scale factor is extracted from a fit over the range . Since the momentum measurement is very sensitive to bremsstrahlung effects, the energy scale determination is critically dependent on an accurate modelling of the amount of material the electrons traverse. Using the ratio of events in the region to the events in the range the amount of material is determined to be (8.90.9)% , consistent with independent checks using photon conversions and -events but slightly higher than from a direct accounting of the material. The limited statistics in the high region is the dominant source of the systematic error on the amount of material traversed by electrons and thus on the energy scale determination. The uncertainty of 10% on the amount of material in front of the calorimeter contributes a 70 MeV/c2 uncertainty on the -mass. The other two main contributions to the total energy scale error are a 65 MeV/c2 error due to the statistics in the -peak and a 50 MeV/c2 error from the uncertainty on the electron resolution. The total error on the -mass from setting the energy scale using the momentum scale is thus 110 MeV/c2 which, combined with the 50 MeV/c2 momentum scale uncertainty, gives a total energy scale uncertainty on the -mass of 120 MeV/c2 for the measurement using decays.

The energy and momentum scales are verified by measuring the masses of known resonances, the -mass and the masses of the resonances. They are all in good agreement with the world average values. The width of the -resonance provides a constraint on the momentum resolution that results in a systematic error on the -mass from the uncertainty on the momentum and energy resolution of 60 MeV/c2 and 80 MeV/c2 for the muon and electron measurement, respectively. The hadronic energy scale does not need to be determined separately since collider events are used to model the -recoil system.
At DØ the -mass is measured from decays. The electromagnetic (EM) energy scale is determined by calibrating to the resonance. Since the absolute energy scale of the EM calorimeter is not known with the required precision, the ratio of the measured and masses and the world average mass are used to determine the boson mass. The mass measured is de facto the ratio of the measured and mass, scaled to the LEP mass: . A number of systematic effects, common to both measurements, cancel in the ratio. Most notably, as shall be discussed in more detail below, the ratio is to first order insensitive to the absolute energy scale.
Test beam measurements have demonstrated the EM calorimeter to be linear to better than 0.5% for electron energies exceeding 10 GeV. To establish the energy scale with the precision required for this measurement, it is necessary to determine to which extent a potential offset in the energy response, as opposed to a scale factor, is responsible for the deviation of the ratio from unity. This was achieved by combining the measured mass with the measurements of and decays and comparing them to their known values [23]. If the electron energy measured in the calorimeter and its true energy are related by , the measured and true mass values are, to first order, related by . The variable depends on the decay topology and is given by , where is the opening angle between the two decay products and and are their measured energies.
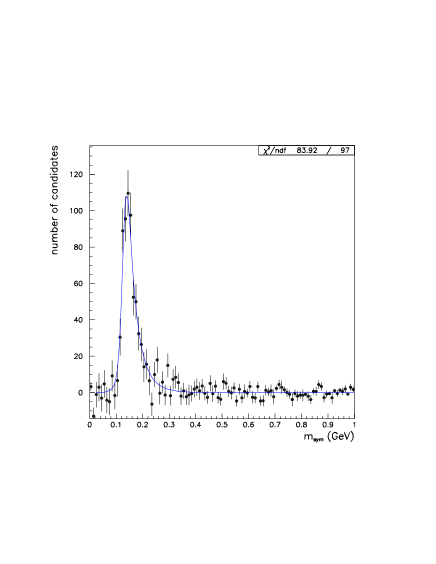
Figure 7 shows the background subtracted mass spectrum of the decay . The two photons in the decay of the neutral pion are not resolved in the calorimeter, but by selecting events in which both ’s convert into an -pair, and produce distinctive doubly ionizing tracks in the central detector, the opening angle can be reconstructed. The “mass” plotted in Fig. 7 (data points with error bars) is
| (1) |
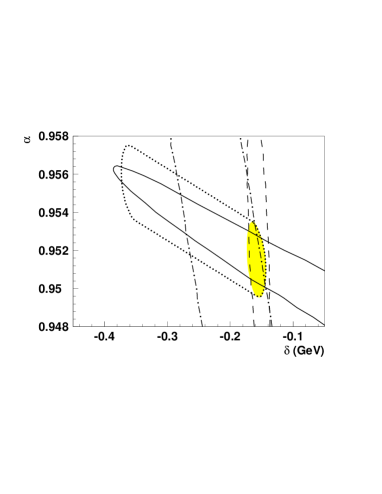
where is the cluster energy, equal to the sum of the photon energies, and is the opening angle of the two photons. is equal to the invariant mass for symmetric decays. The shape compares well with the Monte Carlo simulation shown as the solid line. The measured mass is MeV/c2. The sensitivity to the energy scale and offset is determined by varying both parameters in a Monte Carlo simulation and performing a fit to the data. This procedure maps out an allowed region in the ()-plane shown as the dashed line in Fig. 8.
Similarly, a signal with a significance of about 5 has been extracted from the data, which yields an additional, independent constraint on and (dashed-dotted line in Fig. 8). The strongest constraint on the energy scale uncertainty comes from the data. The fact that electrons from decays are not monochromatic is exploited by studying the invariant mass distribution as function of the variable . Small values of correspond to the decay of highly boosted bosons with, on average, higher energies. The dependence of the observed boson mass as function of thus directly translates into a constraint on the energy scale and offset, shown as the solid line in Fig. 8. Each of the mass states has a different sensitivity to and and, taken together, provide a powerful tool for establishing the energy scale in situ. When combined, these three constraints limit and to the shaded elliptical region. Test beam measurements permit a small nonlinear term in the energy response, which affects both and and alters the ratio largely through the effect on . The allowed region in the ()-plane when nonlinearities are included is indicated by the dotted line in Fig. 8.
Using the measured masses for the observed resonances, the energy scale factor determined for the Run Ia data is and the offset is GeV, where the asymmetric errors are due to possible calorimeter nonlinearities. The measured offset is consistent with that determined from test beam data, and has been confirmed by a detailed Monte Carlo study of energy loss in the central detectors. The dependence of the measured ratio of the mass to mass on and may be estimated from
It should be noted that the mass is insensitive to if . The offset results in a correction to the measured mass. The uncertainty on the absolute energy scale results, for the Run Ia data sample, in an uncertainty on of 160 MeV/c2, of which 150 MeV/c2 is due to the limited statistics. For the Run Ib data sample, with a total integrated luminosity of approximately 76 pb-1, the energy scale uncertainty on the mass is 80 MeV/c2.
The event sample is selected by placing very stringent kinematic and fiducial cuts. Both the CDF and DØ mass analyses are currently based on event samples with central leptons only. The main difference in event selection is the treatment of the hadronic activity in the event. The CDF event selection excludes events with jets with GeV. In addition is required to be less than 20 GeV/c, whereas DØ only requires GeV/c. These sets of selection criteria yield event samples of 8049 and 4663 events for the electron and muon decays, respectively, for CDF and 7234 decays for the Ia and 32856 for the Ib data set for DØ.
The -mass is then determined from a maximum likelihood fit of Monte Carlo generated templates in transverse mass to the data distributions. In the Monte Carlo model of -production, events are generated according to a relativistic Breit-Wigner resonance, with a longitudinal momentum distribution as given by the chosen parton distribution function. The CDF choice for nominal parton distribution function is the MRSD′- pdf [18]. In their model the transverse momentum of the is generated according to the measured distribution of -events. This procedure can be justified because of the similarity between and -production and because there are large uncertainties, both theoretical as well as experimental, on the -distribution. The procedure has an added advantage that the recoil system does not need to be modeled independently, since it is taken directly from -events with the two leptons removed. This recoil distribution from -events is corrected for the lepton removal and modified to match data and Monte Carlo with respect to the width of the distribution of the projection of the of the recoil system perpendicular to the lepton direction. The disadvantage of the method is that very few events (555 events to be precise) are used to model the recoil with a slightly different acceptance than for -events, and it ignores the correlation between the transverse and longitudinal momenta and the difference in mass between the and -bosons.
The DØ experiment generates bosons using the double differential production cross section in and rapidity calculated at next to leading order [24] using the MRSA parton distribution functions [18], thus including the correlation between the longitudinal and transverse momentum. Minimum bias events are used to model the underlying event, mimicking the debris in the event due to spectator parton interactions and the pile-up associated with multiple interactions, and including the residual energy from previous beam crossings. The relative response of the hadronic and EM calorimeters is established by studying events. To ensure an equivalent event topology between the and events, decays in which one electron is in the end calorimeter are included in this study. The transverse momentum balance in events is given by . One finds for the average assuming , where is the transverse momentum of the measured from the two electrons. The cross term on the right hand side averages to zero since the underlying event vector is randomly distributed with respect to the recoil system. Figure 9a shows the distribution of versus . The data shows a linear relation between the EM and hadronic energy scale, and yields . The intercept yields the magnitude of the underlying event vector, , consistent with the value obtained from minimum bias events. The uncertainty on due to the uncertainty on the hadronic energy scale is 50 MeV/c2 for the Run Ia data.
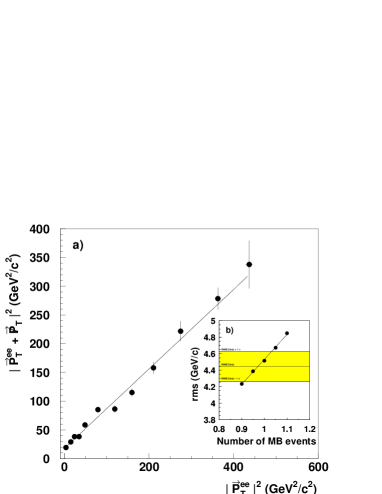
The modeling of the recoil and underlying event are verified and constrained by comparing the of the obtained from the two electrons, , to that obtained from the rest of the event: . To minimize the contribution from the electron energy resolution, the vector sum of these two quantities is projected along the bisector of the two electron directions. Since is randomly oriented and has a magnitude , the width of the distribution is sensitive to the underlying event contribution while the mean is largely unaffected. The sensitivity of the width of this distribution to the mean number of minimum bias events that mimic the underlying event is determined by varying the number of minimum bias events in the Monte Carlo, as shown by the points in Fig. 9b. For the Ia data, the number of minimum bias events preferred is , consistent with one. The uncertainty on from the underlying event model is 60 MeV/c2.
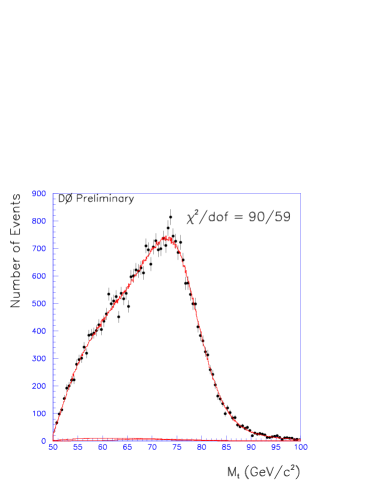 |
The mass of the is obtained from a maximum likelihood fit over the transverse mass range GeV/c2 ( GeV/c2) for CDF (DØ). Figures 10 and 11 show the transverse mass distributions for the data together with the best fit of the Monte Carlo for the Run Ib electron data for DØ and for the muon and electron channel for Run 1a for CDF, respectively. The -mass is determined to be GeV/c2 based on 3268 events in the mass fitting window and GeV/c2 based on 5718 events for CDF. DØ finds GeV/c2 based on 5982 events in the mass fitting window using the Ia data, and GeV/c2 based on 27040 events for the Ib data. Table 3 lists the systematic errors on the individual measurements and the common errors.
 |
| CDF | DØ | |||||
| e | common | Ia | Ib | common | ||
| Statistical | 145 | 205 | — | 140 | 70 | — |
| Energy scale | 120 | 50 | 50 | 160 | 80 | 25 |
| Angle scale | — | — | — | 50 | 40 | 40 |
| or resolution | 80 | 60 | — | 70 | 25 | 10 |
| and recoil model | 80 | 75 | 65 | 110 | 95 | |
| pdf’s | 50 | 50 | 50 | 65 | 65 | 65 |
| QCD/QED corr’s | 30 | 30 | 30 | 20 | 20 | 20 |
| -width | 20 | 20 | 20 | 20 | 10 | 10 |
| Backgrounds | 10 | 25 | — | 35 | 15 | — |
| Efficiencies | 0 | 25 | — | 30 | 25 | — |
| Fitting procedure | 10 | 10 | — | 5 | 5 | — |
| Total | 230 | 240 | 100 | 270 | 170 | 80 |
| Combined | 180 | 150 | ||||
The dominant theoretical uncertainty in this measurement comes from the model and the uncertainty on the proton structure. Parton distributions and the spectrum in are correlated. The DØ experiment has addressed this correlation in the determination of its uncertainty on the mass. In their analysis new parametrizations of the CTEQ 3M parton distribution function were obtained that included in the fit the CDF asymmetry data from Run Ia [25], where all data points had been moved coherently up or down by one standard deviation. In addition one of the parameters, which describes the -dependence of the parametrization of the non-perturbative functions describing the spectrum [24], was varied. The constraint on this parameter was provided by the measurement of the spectrum. The uncertainty due to parton distribution functions and the input spectrum was then assessed by varying simultaneously these new parton distribution function and the parameter describing the non-perturbative part of the spectrum. A total error on the -mass of 65 MeV/c2 has been assigned due to these uncertainties.
The CDF experiment uses their measurement of the charge asymmetry as the sole constraint on the uncertainty due to the and parton distribution functions. Figure 12 shows the correlation between and the significance of the deviation of the theoretical prediction for the -asymmetry and the data for the electron and muon channel separately (cf. eq. (2)). The uncertainty on is taken to be the symmetrized spread in masses for , being 50 MeV/c2.
Combining [26] these measurements with previous mass measurements [27], assuming the only correlated uncertainty between the measurements is due to the parton distribution functions, gives a world average of GeV/c2.

An indirect measurement of the -mass, through the measurement of the weak mixing angle , is obtained from the study of N deep inelastic scattering experiments. The CCFR experiment studies -nucleon interactions and the ratio of charged and neutral current cross sections provides a direct measurement of the weak mixing angle. The cross sections have large contributions from electroweak radiative corrections. In the “on shell” scheme, however, where is defined as to all orders, these corrections largely cancel in the ratio, thus reducing the dependence on the top mass and Higgs mass significantly and providing an indirect measurement of . A preliminary value of has been reported [28], corresponding to a mass value of GeV/c2. The largest contribution to the systematic uncertainty comes from the uncertainty on the flux of background ’s. The model uncertainty is dominated by the turn-on of the charm quark production cross section. The latter uncertainty is expected to be reduced substantially with the follow-up experiment NuTeV, which will be able to measure the cross sections with neutrino and anti-neutrino beams separately.
6 -charge Asymmetry
As Fig. 12 shows, the mass is strongly correlated with the parton distribution functions. The parton distribution functions can be constrained at the appropriate -scale by measuring the charge asymmetry in -production itself. The two, partly compensating, sources that contribute to the -charge asymmetry are the production and decay processes. Since on average a -quark carries more momentum than a -quark, more -bosons are produced along the proton direction than along the anti-proton direction resulting in a production charge asymmetry defined as
The -rapidity, , however, cannot be reconstructed unambiguously because of the two-fold ambiguity in the longitudinal momentum of the neutrino. The quantity that is measured experimentally is the decay lepton charge asymmetry, defined as
where is the number of positively (negatively) charged leptons detected at pseudorapidity . Since the rapidity of the decay lepton is measured, there is an additional contribution from the coupling of the . Since -bosons are produced through annihilation they are almost fully polarized and the lepton from, for example, the -decay is preferentially emitted along the anti-proton direction, which partially undoes the production asymmetry. Because of symmetry, , the measured asymmetries at positive and negative rapidities can be combined to get a statistically more powerful measurement. The structure of the -decay is very well understood. Thus, the charge asymmetry measurement can be used to probe the structure of the proton in the range 0.007 to 0.27 .
The CDF experiment, based on an integrated luminosity of about 20 pb-1 measured the charge asymmetry for -decays into electrons and muons and constrained the then current parton distribution functions [25]. The lepton pseudorapidity range in that analysis was for muons and for electrons. It was limited by the rapidity coverage provided by the central tracking chamber. The analysis has been updated [29] using the full Run 1 data set with a total integrated luminosity of 110 pb-1. The rapidity coverage for muons has been extended by utilizing the forward muon toroids [30] covering , which collected 72 pb-1 of data. The efficiency for electrons in the plug calorimeter () was also substantially improved. In the previous analysis only the central tracking chamber was used in the electron identification. Because of the limited coverage of this tracking system almost no tracks were reconstructed beyond . In the new analysis, utilizing the silicon vertex detector (SVX) and the vertex chamber, an average track finding efficiency of 60%, almost uniform in , has been obtained out to rapidities of . For the high region, though, the electron charge cannot be determined by the tracking system alone. In this region the charge is determined from a comparison of the -angle as determined from the SVX track, and from the calorimeter energy deposition. At the location of the calorimeter an average displacement of 0.5 cm is expected in the pseudorapidity range , which is measured with a resolution of 0.15 cm.
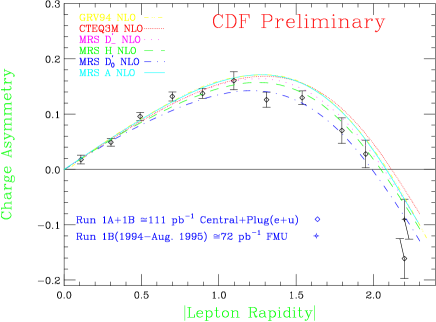
Figure 13 shows the measured asymmetry as a function of the lepton rapidity together with the theoretical prediction for different parton distribution functions. The predictions were obtained using the DYRAD NLO Monte Carlo [31]. Compared to the previous analysis the new measurements at high rapidity should be noted. Since the measurement is a ratio measurement, many systematic errors cancel and the total systematic error is about 20% of the statistical error.
The asymmetry measurement provides an independent discriminant between different parton distribution functions. The disagreement between theory and experiment can be quantified by defining the significance of the disagreement between the weighted mean asymmetry () from theory and experiment as
| (2) |
The values listed in Table 4 seem to prefer the recent MRS parton distribution functions [18] over other distributions [8, 32]. The constraint which the charge asymmetry provides on the uncertainty on the mass measurement, however, is not expected to scale with event statistics, since the measurement is mainly sensitive to the slope of the ratio of the and parton distribution functions and does not probe the full parameter range describing them.
| PDF Set | |
|---|---|
| CTEQ3M | 1.16 |
| MRS A, G | 1.75 |
| MRS H | -0.51 |
| MRSD′- | 0.68 |
| GRV 94 | 2.59 |
| GRV 92 | 4.13 |
7 Rare Decays
The study of rare decays provides a precision test of the underlying theory since in general the predictions of rare decay rates involve higher order calculations. decays into a pseudoscalar meson and a photon, , are particularly attractive since they are sensitive to new physics which affects the vertex. A search for decays thus complements di-boson analyses described in detail in the following section.
Currently, experiments have only looked for the rare decay [33, 34, 35] with the strongest limit coming from the latest CDF analysis. In this analysis, based on an integrated luminosity of 16.7 pb-1, events were selected with an energetic photon and a single central jet with GeV with a matching isolated track. The track was required to have GeV/c with no other charged tracks with GeV/c in a cone of radius . By initially not placing a cut on the electromagnetic fraction of the pion jet, the sample is dominated by isolated electrons and permits measurement of many of the efficiencies from the data itself. In the final selection the electromagnetic fraction of the jet is required to be less than 80% of the total jet energy, and a sample of 79 events remains (see Fig. 14) with one event in the search region GeV/c2.
The background, primarily coming from jet production with the jet opposite the photon candidate fragmenting into a single charged particle, possibly associated with neutrals, has been estimated to be events in the mass window. The one event observed is thus consistent with background. Without background subtraction, the 95% confidence level limit is 4.9 events. Using the measured production cross section, this results in a 95% CL upper limit on the partial decay width of
to be compared with the theoretical prediction of [36] .

8 Gauge Boson Pair Production
Similar to a study of rare decays of vector bosons, a study of the magnetic dipole and electric quadrupole moments of the boson probes the interaction vertex. The non-Abelian gauge symmetry of the SM implies that the gauge bosons self-interact. These self-interactions give rise to very subtle interference effects in the SM and the couplings are uniquely determined by the gauge symmetry in order to preserve unitarity. The magnetic dipole and electric quadrupole moments of the are, in the SM at tree level, given by:
The most general effective electroweak Lagrangian, invariant under , however, contains eight independent coupling parameters, the –conserving parameters and and the –violating parameters and , where = or . The –conserving parameters are related to the magnetic dipole () and electric quadrupole () moments of the boson, while the –violating parameters are related to the electric dipole () and the magnetic quadrupole () moments [37]:
In the SM the couplings at tree level are given by (=-1=0), ===0. Because of the similarity of the –conserving and –violating terms in the Lagrangian, the kinematic behavior of these terms is similar and the limits on both sets of anomalous couplings will be approximately the same. Therefore -violating terms will not be discussed explicitly. Also, unless stated, it will be assumed that and .
A direct measurement of the moments of the boson, and thus of the gauge boson self-interactions, is possible through the study of gauge boson pair production. The cross sections for di-boson production, however, are all extremely small. For example, the predicted cross section times branching ratio for -pair production with () is about 0.5 pb and large integrated luminosities would be needed for a significant measurement of the gauge couplings. The SM process of -pair production, however, is characterized by large cancellations between the and channel production processes. The contributions from the channel diagrams by themselves would violate unitarity. This implies that if the couplings deviate even modestly from their SM values, the gauge cancellations are destroyed and a large increase of the cross section is observed. Moreover, the differential distributions will be modified giving rise to gauge bosons with a large transverse boost since the largest gauge cancellations occur for highly boosted bosons.
A interaction Lagrangian with constant anomalous couplings would thus violate unitarity at high energies and therefore the coupling parameters must be modified to include form factors [38], that is, and , where is the square of the center of mass energy of the subprocess. is a unitarity preserving form factor scale and indicates the scale at which the SM predictions are probed. In the next subsections different types of gauge boson pair production will be discussed.
8.1 Pair Production
DØ has searched for -boson pair production [39]. The standard selection criteria for -events have an overall efficiency for -pair production of 0.07 and with an integrated luminosity of 14 pb-1 events are expected from SM processes. The most significant background to this process is production. Because of the additional two -jets in events, this background can be eliminated in a straightforward way by a cut on the hadronic activity in the event. DØ applies a cut on the of the -system, , which is required to be less than 40 GeV. This requirement rejects about 75% of the background and has an efficiency of 95% for the expected signal. The searches in the , and channels yield one signal event with an anticipated background of 0.56 0.13 events. An upper limit on the -pair production cross section of pb-1 has been set at 95% CL.
With larger integrated luminosities it is possible to measure the -pair production cross section. Based on an integrated luminosity of 108 pb-1 CDF has done an analysis similar to the DØ analysis searching for -pairs in the di-lepton channel using a jet veto, that is, events with jets with GeV are rejected. The selection yields 5 signal events on a background of 1.2 0.3 events. The measured -pair production cross section is ( pb, where the SM predicts ( pb. It should be pointed out that the smallness of the cross sections in itself is a beautiful demonstration of the gauge cancellations in the SM.
Since the cross section increases very rapidly when the couplings deviate from their SM values, the measured 95% CL upper limit on the cross section can be used to set limits on anomalous couplings. Figure 15 shows the CDF 95% CL exclusion contours in and for two different form factor scales, assuming and . It is customary to quote limits on only one coupling, keeping the other couplings fixed to their SM value. These, so called, axis limits for a form factor scale of TeV are , for the CDF analysis, under the assumption that and .

8.2 and Production
Searches for particle production requiring two leptons in the final state always suffer in rate because of the small leptonic branching ratios. When in the analysis described in the previous subsection only one lepton is required, a substantial increase in event rate is obtained though at the cost of a much larger background. The background from +jet production to these processes is about 30 times higher than for the signal production. Given the distinct characteristics of anomalous couplings, this background can be dealt with. Anomalous couplings modify the differential distributions dramatically, especially the transverse momentum distribution of the -boson. The ratio is about , whereas for only modest deviations from SM couplings () this ratio is about 0.5. By requiring the vector boson to have high transverse momentum the background is completely eliminated and a good sensitivity to anomalous couplings is retained. One completely loses sensitivity, however, to SM -production.
Both CDF and DØ have looked for and -production using hadronic decay channels [40, 41]. The CDF analysis proceeds by selecting events with one high lepton, large and 2 jets with GeV. Since the jets come from the hadronic decay of the gauge boson, their invariant mass is required to be consistent with the gauge boson mass, GeV/c2. Since no distinction can be made between and -production in this selection, the sensitivity of the study was increased by including events, requiring the di-lepton invariant mass to reconstruct to the -boson mass. In the data sample, corresponding to a total integrated luminosity of 110 pb-1, no events are observed with GeV/c in the search region GeV/c2. A background of 0.8 events from +jet events is expected and 0.1 events are predicted from SM processes. Limits on anomalous couplings can then be set based on the event rate yielding, for TeV,
| . |
The DØ experiment has performed a similar analysis based on their Run 1a data sample of 14 pb-1, using only decays. The leptonic decays of the are not considered in this analysis. Since gauge bosons produced from anomalous self-interactions tend to have high , the jets from such a high or boson may not be well separated in space. In order to maximize the detection efficiency of and bosons with high , a small jet cone size of was used in this analysis. The detection efficiency for hadronic decays of and bosons was estimated as a function of using Monte Carlo. The detection efficiency was found to be 60%, approximately constant up to GeV/c. Differences in the estimated efficiencies from different Monte Carlo generators were included in the systematic uncertainty. The spectrum of the final event sample of 84 events is of course dominated by background. The total number of background events was estimated to be , with events coming from QCD multi-jet events and from W+jet events. The remaining small background is mainly due to production. The SM prediction for production was events.
Because anomalous couplings not only affect the event rate but also significantly alter differential distributions, better limits on anomalous couplings are obtained when utilizing the full spectrum. DØ has performed a maximum likelihood fit to the spectrum and, assuming equal and couplings, obtained the following limits at 95% confidence level:
| , |
using TeV. Comparing these limits to those obtained by CDF for the same process, but with five times the statistics using both electron and muon decays, shows the additional constraint that can obtained from the shape of the distribution.
Since this analysis probes both and couplings, information can be obtained on the coupling alone by setting the couplings to their SM values. Fig. 16a shows the contour limits when SM couplings are assumed, whereas the coupling was set to its SM value in Fig. 16b. The contours indicate that the analysis is more sensitive to the coupling than the coupling as expected from the larger coupling strength of the vertex. Also noteworthy is the observation that the data confirms the existence of the vertex.
 |
 |
8.3 Production
The study of the production of photons in association with a also permits a study of the -vertex [42, 43, 44]. Most photons produced in association with a , however, are radiated off the initial or final state fermion. The only channel that allows for a direct probe of the triple gauge boson vertex is the -channel contribution of a photon radiated from a . In the analyses events are selected by requiring, in addition to the regular selection criteria, an isolated photon with transverse energy GeV for DØ (CDF). Photons are detected in the pseudo-rapidity range for CDF and or for DØ. The photon identification efficiencies are approximately 80% for CDF and 75% (58%) for DØ for the central (end) region. To reduce the contribution from radiative events the photon is required to be well separated from the lepton from the -decay, .
| DØ | CDF | |||
|---|---|---|---|---|
| 87 pb-1 | 67 pb-1 | |||
| 57 | 70 | 75 | 34 | |
| 15.2 2.5 | 27.4 4.7 | 16.1 2.4 | 10.3 1.2 | |
| 43.6 3.1 | 38.2 2.8 | |||
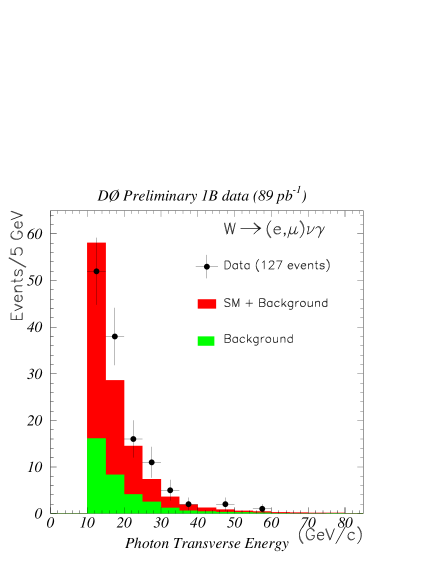
The number of signal events, after background subtraction, and the number of expected events from SM processes are listed in table 5 for the electron and muon channels separately. Figure 17 shows the distribution of the photon -spectrum for DØ, together with the SM expectation. Good agreement with the prediction is observed and limits could be set based on the event rate. As seen in the previous section, if the event statistics allows it, better limits on anomalous couplings are obtained by performing a maximum likelihood fit to a differential distribution. For production a binned maximum likelihood fit is performed to the -spectrum as function of the coupling constants. The last data bin is explicitly taken to be a zero-event bin. The limits thus obtained for a form-factor scale TeV are
| (DØ) | ||
| (CDF) | ||
| (DØ) | ||
| (CDF). |
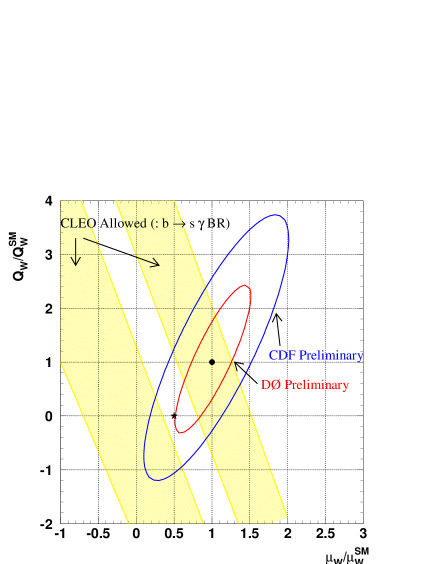
The corresponding contours in magnetic dipole and electric quadrupole moment, in units of the SM prediction for the moments, are shown in Fig. 18. A vanishing magnetic dipole moment and electric quadrupole moment of the , corresponding to and is excluded at 99% CL.
The decay rate for can also be used to set limits on anomalous couplings since the process is sensitive to photon radiation off the -boson in the penguin diagram. The branching ratio has been measured by CLEO to be [45]. The upper limit on this branching ratio excludes the outer regions in Fig. 18. The narrow region between the two allowed CLEO bands is excluded by the lower limit.
8.4 Combined Result on Coupling
The studies of and production are both sensitive to the same coupling. The analyses can thus be combined to improve on the limits on anomalous couplings. When combining results, the correlation between the different analyses needs to be addressed. Some of the dominant common systematic uncertainties are due to the method of estimating the background and the uncertainty in structure functions and photon identification. The DØ experiment has carried out a combined fit to the three data sets corresponding to the , and analyses from Run 1a. The significantly improved limits are:
| , |
where it was assumed that the couplings and the couplings were equal. Note that this combined result is more stringent than the result from the DØ analysis using the complete Run 1 data sample, showing the reach when all Tevatron results are combined.
8.5 Production
The and trilinear gauge boson couplings are described in a way analogous to the couplings. These couplings, absent in the SM, are suggested by some theoretical models which imply new physics [46]. The most general Lorentz and gauge invariant vertex is described by eight coupling parameters, , where [47]. Combinations of the –conserving (–violating) parameters and ( and ) correspond to the electric (magnetic) dipole and magnetic (electric) quadrupole transition moments of the vertex. Partial wave unitarity of the general process restricts the couplings uniquely to their vanishing SM values at asymptotically high energies [48]. Therefore, the coupling parameters have to be modified by form-factors , where is the square of the invariant mass of the system and is the form-factor scale. The energy dependence of the form factor is assumed to be for and for [49]. Such a choice yields the same asymptotic energy behavior for all the couplings.
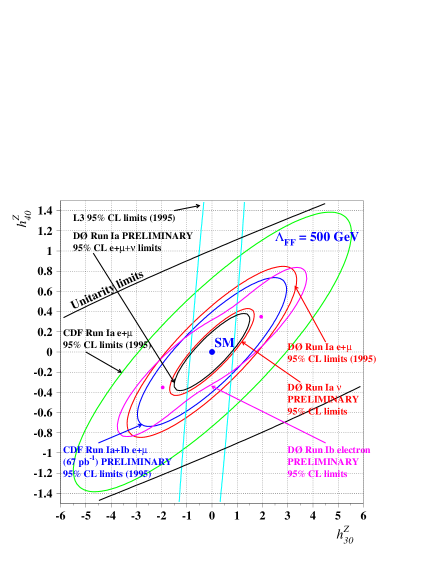
The study of anomalous couplings in the process follows the same lines as the analysis [50, 51]. Table 6 lists the expected and observed number of signal events for both experiments. The total cross section is seen to be in good agreement with the SM prediction. The sensitivity to anomalous couplings lies in the high region. Three events with GeV/c are observed, one by CDF and two by DØ. For DØ, the probability to observe at least two events with GeV/c, given a total of 14 events observed, is 8.2% and the events are consistent with a signal or background fluctuation within two standard deviations. Because of these high events, however, small non-vanishing anomalous couplings are preferred in the DØ analysis. Their resulting exclusion contour from the Run 1b electron data is therefore slightly distorted (see Fig. 19). Preliminary limits on anomalous couplings for a scale factor GeV from the di-electron analysis by DØ and the di-lepton analysis by CDF are, at 95% CL,
| (DØ) | ||
| (CDF) | ||
| (DØ) | ||
| (CDF) |
| DØ | CDF | |||
|---|---|---|---|---|
| 89 pb-1 | 67 pb-1 | |||
| 14 | 18 | 13 | ||
| 1.6 0.5 | 0.9 0.3 | 0.5 0.1 | ||
The DØ experiment has recently performed a new analysis looking for the decay . This channel has previously been studied only in -collisions [52]. Sensitivity to anomalous couplings in this channel is much higher than in the di-lepton decay modes due to the higher decay rate into neutrinos and the absence of radiative decay background. The overall background, however, is still extremely high, leading to very stringent event selection criteria. To reduce the background from +jet events with the electron or jet being misidentified as a photon the and were required to exceed 40 GeV. In addition, events with at least one jet with GeV were rejected. The remaining background was dominated by cosmic rays and muons from beam halo which radiated in the calorimeter. This background was suppressed by rejecting events with a reconstructed muon or a minimum ionizing trace in the calorimeter close to the photon cluster. The residual background, which had roughly equal contributions from decays and muon bremsstrahlung, was derived from data.
Four candidate events are observed on an expected background of events and a SM prediction of events. Although the signal-to-background ratio is less than one, the sensitivity to anomalous couplings is still high, since the background is concentrated at low while the anomalous coupling contribution is almost flat in up to the kinematic threshold of the reaction. Limits on anomalous couplings were set at 95% CL by a fit to the spectrum and gives , . This represents a factor of two improvement compared to the combined DØ Run 1a limits from the di-lepton analysis, based on the same luminosity [51]. A summary of all the limits is shown in Fig. 19 [50, 51, 52]. The L3 contour has a different orientation because of the different subprocess center of mass energy at which the events are produced.
9 Conclusions
A wide variety of properties of the and -bosons are now being studied at hadron colliders with ever increasing precision, at the highest energy scales achievable. All results, including the results from colliders [53, 54], are in good agreement with the SM. It is widely anticipated, though, that the SM is just an approximate theory and should eventually be replaced by a more complete and fundamental description of the underlying forces in nature. With the new data from LEP 2, SLD and the Tevatron, and with the planned upgrades of the accelerators as well as the experiments, the projected uncertainties [55] on some fundamental parameters should provide the tools to take another ever more critical look at the SM, without any theoretical prejudice.
10 Acknowledgements
I would like to thank Debbie Errede, Paul Grannis, Young-Kee Kim and Darien Wood who have been very helpful.
References
- [1] S. Abachi et al. (DØ Collaboration), Nucl. Instr. Meth. A338, 185 (1994); H. Aihara et al. (DØ Collaboration), Nucl. Instr. Meth. A325, 393 (1993); S. Abachi et al. (DØ Collaboration), Nucl. Instr. Meth. A324, 53 (1993).
- [2] F. Abe, et. al. (CDF Collaboration), Nucl. Instr. Meth. A271, 387 (1988).
- [3] F. Abe, et. al. (CDF Collaboration), Phys. Rev. Lett. 73, 220 (1994); F. Abe et al., Phys. Rev. D52, 2624 (1995).
-
[4]
W. F. Badgett, “Proceedings of the 8th DPF
Meeting”,
August 2-6 (1994), 431, Albuquerque, New Mexico
F. Abe, et. al. (CDF Collaboration), FERMILAB-PUB-95-301-E (1995) (submitted to Phys. Rev. Lett.) - [5] S. Abachi et al. (DØ Collaboration), Phys. Rev. Lett. 75, 1456 (1995)
- [6] R. Hamberg, W. L. van Neerven and T. Matsuura, Nucl. Phys. B359, 343 (1991); W. L. van Neerven and E. B. Zijlstra, Nucl. Phys. B382, 11 (1992).
- [7] Although these mass values have been updated recently [53], these are the averages used for the published results.
- [8] H. L. Lai et al., Phys. Rev. D51, 4763 (1995).
- [9] J. L. Rosner, M. P. Worah and T. Takeuchi, Phys. Rev. D49, 1363 (1994).
- [10] Particle Data Group, R.M. Barnett et al., Phys. Rev. D 54, 1 (1996).
- [11] C. Albajar et al. (UA1 Collaboration), Phys. Lett. B253, 503 (1991).
- [12] J. Alitti et al. (UA2 Collaboration), Phys. Lett. B276, 365 (1992).
- [13] F. Abe et al. (CDF Collaboration), Phys. Rev. Lett. 74, 341 (1995).
- [14] E. Eichten, K. Lane, M. Peskin Phys. Rev. Lett. 50 (1983) 811.
- [15] F. Abe et al. (CDF Collaboration), Phys. Rev. Lett. 67, 2418 (1991); F. Abe et al., Phys. Rev. D 49, 1 (1994)
- [16] The angle is the polar angle of the outgoing fermion with respect to the incoming proton beam. Pseudorapidity is defined as . An asterisk indicates quantities in the parton center of mass frame.
- [17] F. Abe et al. (CDF Collaboration), Phys. Rev. Lett. 77, 2616 (1996).
-
[18]
A. D. Martin, R. G. Roberts and
W. J. Stirling, Phys. Lett. B306, 145 (1993);
B309, 492(E) (1993);
A. D. Martin, R. G. Roberts and W. J. Stirling, Phys. Rev. D50, 6734 (1994) - [19] J. Rosner, Phys. Rev. D 54, 1078 (1996).
- [20] For alternate methods see the contributions by S. Keller and S. Rajagopalan, these proceedings
- [21] F. Abe et al. (CDF Collaboration), Phys. Rev. Lett. 75, 11 (1995); F. Abe et al. Phys. Rev. D52, 4784 (1995).
- [22] S. Abachi et al. (DØ Collaboration), Phys. Rev. Lett. 77, 3309 (1996); M.L. Kelly et al. Fermilab-Conf-96/236.
- [23] The reference mass values used are = 91.1884 0.0022 GeV/c2, = 3.09688 0.00004 GeV/c2 and = 0.1350 0.0006 GeV/c2, Particle Data Group, L. Montanet et al., Phys. Rev. D 50, 1173 (1994).
- [24] G. Ladinsky and C.-P. Yuan, Phys. Rev. D 50, 4239 (1994).
- [25] F. Abe et al. (CDF Collaboration), Phys. Rev. Lett. 74, 850 (1995)
- [26] M. Demarteau et al., Combining W Mass Measurements, CDF/PHYS/CDF/PUBLIC/2552 and DØ NOTE 2115.
- [27] J. Alitti et al. (UA2 Collaboration), Phys. Lett. B276, 354 (1992); F. Abe et al. (CDF Collaboration), Phys. Rev. Lett. 65, 2243 (1990), Phys. Rev. D 43, 2070 (1991);
- [28] CCFR Collaboration (C. Arroyo, B.J. King et al.) Phys. Rev. Lett. 72, 3452 (1994); K. McFarland in “Proceedings of the XXXI Rencontres de Moriond, Electroweak Interactions and Unified Theories, 16-23 March, 1996, Les Arcs, Bourg Saint Maurice, France (ed. Jean Trân Thanh Vân), Fermilab-Conf-96/227
- [29] A. Bodek (CDF Collaboration) FERMILAB-CONF-96/381-E, to appear in “Proceedings of the Cracow International Symposium on Radiative Corrections (CRAD96)”, Cracow, Poland, August 1-5, 1996.
- [30] CDF’s “Aha Erlebnis”.
- [31] W. Giele, E. Glover, D. A. Kosower, Nucl. Phys. B403, 663 (1993).
- [32] M. Glück, E. Reya, A. Vogt Z. Phys. C67, 433 (1995).
- [33] F. Abe et al. (CDF Collaboration), Phys. Rev. Lett. 69, 2160 (1992)
- [34] J. Alitti et al. (UA2 Collaboration), Phys. Lett. B277, 203 (1992).
- [35] F. Abe et al. (CDF Collaboration), Phys. Rev. Lett. 76, 2852 (1996).
- [36] L. Arnellos, W.J. Marciano and Z. Parsa, Nucl. Phys. B196, 378 (1982).
- [37] K. Kim and Y-S. Tsai, Phys. Rev. D 7, 3710 (1973).
- [38] U. Baur and E.L. Berger, Phys. Rev. D 41, 1476 (1990).
- [39] S. Abachi et al. (DØ Collaboration), Phys. Rev. Lett. 75, 1023 (1995)
- [40] F. Abe et al. (CDF Collaboration), Phys. Rev. Lett. 75, 1017 (1995)
- [41] S. Abachi et al., Phys. Rev. Lett. 77, 3303 (1996).
- [42] J. Alitti et al., Phys. Lett. B277, 194 (1992).
- [43] F. Abe et al. (CDF Collaboration), Phys. Rev. Lett. 74, 1936 (1995)
- [44] S. Abachi et al. (DØ Collaboration), Phys. Rev. Lett. 75, 1034 (1995).
- [45] M.S. Alam et al. (CLEO Collaboration), Phys. Rev. Lett. 74, 2885 (1995) 2885.
- [46] H. Aihara et al., in “Electroweak Symmetry Breaking and Beyond the Standard Model”, report from the DPF Long-Range Planning Study, eds. T. Barklow, S. Dawson, H. Haber and J.Siegrist.
- [47] K. Hagiwara et al., Nucl. Phys. B282, 253 (1987).
-
[48]
K. Hagiwara and D. Zeppenfeld,
Nucl. Phys. B274, 1 (1986);
U. Baur and D. Zeppenfeld, Phys. Lett. 201B, 383 (1988). - [49] U. Baur and E.L. Berger, Phys. Rev. D47, 4889 (1993).
- [50] F. Abe et al. (CDF Collaboration), Phys. Rev. Lett. 74, 1941 (1995)
- [51] S. Abachi et al. (DØ Collaboration), Phys. Rev. Lett. 75, 1028 (1995)
- [52] M. Acciarri et al. (L3 Collaboration), Phys. Lett. B346, 190 (1995).
- [53] M. Demarteau, Fermilab-Conf-96/354, to appear in the “Proceedings of the Meeting of the Division of Particles and Fields”, Minneapolis, MN, August 10 – 15, 1996.
- [54] M. Swartz, these proceedings.
- [55] See, for example, U. Baur, M. Demarteau, these proceedings.