DESY 96-055
April 1996
Photoproduction of Mesons in Electron-Proton Collisions at HERA
H1 Collaboration
At the electron-proton collider HERA the inclusive meson photoproduction cross section has been measured with the H1 detector in two different, but partly overlapping, kinematical regions. For the first, where GeV and , the result is . The second measurement for yields at GeV and at GeV, respectively. The third error accounts for an additional uncertainty due to the proton and photon parton density parametrizations. Differential cross sections are presented as a function of the transverse momentum and rapidity. The results compare reasonably well with next-to-leading order QCD calculations. Evidence for diffractive photoproduction of charm quarks is presented.
S. Aid14, V. Andreev26, B. Andrieu29, R.-D. Appuhn12, M. Arpagaus37, A. Babaev25, J. Bähr36, J. Bán18, Y. Ban28, P. Baranov26, E. Barrelet30, R. Barschke12, W. Bartel12, M. Barth5, U. Bassler30, H.P. Beck38, H.-J. Behrend12, A. Belousov26, Ch. Berger1, G. Bernardi30, R. Bernet37, G. Bertrand-Coremans5, M. Besançon10, R. Beyer12, P. Biddulph23, P. Bispham23, J.C. Bizot28, V. Blobel14, K. Borras9, F. Botterweck5, V. Boudry29, A. Braemer15, W. Braunschweig1, V. Brisson28, D. Bruncko18, C. Brune16, R. Buchholz12, L. Büngener14, J. Bürger12, F.W. Büsser14, A. Buniatian12,39, S. Burke19, M.J. Burton23, G. Buschhorn27, A.J. Campbell12, T. Carli27, M. Charlet12, D. Clarke6, A.B. Clegg19, B. Clerbaux5, S. Cocks20, J.G. Contreras9, C. Cormack20, J.A. Coughlan6, A. Courau28, M.-C. Cousinou24, G. Cozzika10, L. Criegee12, D.G. Cussans6, J. Cvach31, S. Dagoret30, J.B. Dainton20, W.D. Dau17, K. Daum35, M. David10, C.L. Davis19, B. Delcourt28, A. De Roeck12, E.A. De Wolf5, M. Dirkmann9, P. Dixon19, P. Di Nezza33, W. Dlugosz8, C. Dollfus38, J.D. Dowell4, H.B. Dreis2, A. Droutskoi25, D. Düllmann14, O. Dünger14, H. Duhm13, J. Ebert35, T.R. Ebert20, G. Eckerlin12, V. Efremenko25, S. Egli38, R. Eichler37, F. Eisele15, E. Eisenhandler21, R.J. Ellison23, E. Elsen12, M. Erdmann15, W. Erdmann37, E. Evrard5, A.B. Fahr14, L. Favart28, A. Fedotov25, D. Feeken14, R. Felst12, J. Feltesse10, J. Ferencei18, F. Ferrarotto33, K. Flamm12, M. Fleischer9, M. Flieser27, G. Flügge2, A. Fomenko26, B. Fominykh25, J. Formánek32, J.M. Foster23, G. Franke12, E. Fretwurst13, E. Gabathuler20, K. Gabathuler34, F. Gaede27, J. Garvey4, J. Gayler12, M. Gebauer36, A. Gellrich12, H. Genzel1, R. Gerhards12, A. Glazov36, U. Goerlach12, L. Goerlich7, N. Gogitidze26, M. Goldberg30, D. Goldner9, K. Golec-Biernat7, B. Gonzalez-Pineiro30, I. Gorelov25, C. Grab37, H. Grässler2, R. Grässler2, T. Greenshaw20, R.K. Griffiths21, G. Grindhammer27, A. Gruber27, C. Gruber17, J. Haack36, T. Hadig1, D. Haidt12, L. Hajduk7, M. Hampel1, W.J. Haynes6, G. Heinzelmann14, R.C.W. Henderson19, H. Henschel36, I. Herynek31, M.F. Hess27, W. Hildesheim12, K.H. Hiller36, C.D. Hilton23, J. Hladký31, K.C. Hoeger23, M. Höppner9, D. Hoffmann12, T. Holtom20, R. Horisberger34, V.L. Hudgson4, M. Hütte9, H. Hufnagel15, M. Ibbotson23, H. Itterbeck1, A. Jacholkowska28, C. Jacobsson22, M. Jaffre28, J. Janoth16, T. Jansen12, L. Jönsson22, K. Johannsen14, D.P. Johnson5, L. Johnson19, H. Jung10, P.I.P. Kalmus21, M. Kander12, D. Kant21, R. Kaschowitz2, U. Kathage17, J. Katzy15, H.H. Kaufmann36, O. Kaufmann15, S. Kazarian12, I.R. Kenyon4, S. Kermiche24, C. Keuker1, C. Kiesling27, M. Klein36, C. Kleinwort12, G. Knies12, T. Köhler1, J.H. Köhne27, H. Kolanoski3, F. Kole8, S.D. Kolya23, V. Korbel12, M. Korn9, P. Kostka36, S.K. Kotelnikov26, T. Krämerkämper9, M.W. Krasny7,30, H. Krehbiel12, D. Krücker2, U. Krüger12, U. Krüner-Marquis12, H. Küster22, M. Kuhlen27, T. Kurča36, J. Kurzhöfer9, D. Lacour30, B. Laforge10, R. Lander8, M.P.J. Landon21, W. Lange36, U. Langenegger37, J.-F. Laporte10, A. Lebedev26, F. Lehner12, C. Leverenz12, S. Levonian29, Ch. Ley2, G. Lindström13, M. Lindstroem22, J. Link8, F. Linsel12, J. Lipinski14, B. List12, G. Lobo28, H. Lohmander22, J.W. Lomas23, G.C. Lopez13, V. Lubimov25, D. Lüke9,12, N. Magnussen35, E. Malinovski26, S. Mani8, R. Maraček18, P. Marage5, J. Marks24, R. Marshall23, J. Martens35, G. Martin14, R. Martin20, H.-U. Martyn1, J. Martyniak7, T. Mavroidis21, S.J. Maxfield20, S.J. McMahon20, A. Mehta6, K. Meier16, T. Merz36, A. Meyer12, A. Meyer14, H. Meyer35, J. Meyer12, P.-O. Meyer2, A. Migliori29, S. Mikocki7, D. Milstead20, J. Moeck27, F. Moreau29, J.V. Morris6, E. Mroczko7, D. Müller38, G. Müller12, K. Müller12, P. Murín18, V. Nagovizin25, R. Nahnhauer36, B. Naroska14, Th. Naumann36, P.R. Newman4, D. Newton19, D. Neyret30, H.K. Nguyen30, T.C. Nicholls4, F. Niebergall14, C. Niebuhr12, Ch. Niedzballa1, H. Niggli37, R. Nisius1, G. Nowak7, G.W. Noyes6, M. Nyberg-Werther22, M. Oakden20, H. Oberlack27, U. Obrock9, J.E. Olsson12, D. Ozerov25, P. Palmen2, E. Panaro12, A. Panitch5, C. Pascaud28, G.D. Patel20, H. Pawletta2, E. Peppel36, E. Perez10, J.P. Phillips20, A. Pieuchot24, D. Pitzl37, G. Pope8, S. Prell12, R. Prosi12, K. Rabbertz1, G. Rädel12, F. Raupach1, P. Reimer31, S. Reinshagen12, H. Rick9, V. Riech13, J. Riedlberger37, F. Riepenhausen2, S. Riess14, E. Rizvi21, S.M. Robertson4, P. Robmann38, H.E. Roloff36,†, R. Roosen5, K. Rosenbauer1, A. Rostovtsev25, F. Rouse8, C. Royon10, K. Rüter27, S. Rusakov26, K. Rybicki7, N. Sahlmann2, D.P.C. Sankey6, P. Schacht27, S. Schiek14, S. Schleif16, P. Schleper15, W. von Schlippe21, D. Schmidt35, G. Schmidt14, A. Schöning12, V. Schröder12, E. Schuhmann27, B. Schwab15, F. Sefkow38, M. Seidel13, R. Sell12, A. Semenov25, V. Shekelyan12, I. Sheviakov26, L.N. Shtarkov26, G. Siegmon17, U. Siewert17, Y. Sirois29, I.O. Skillicorn11, P. Smirnov26, J.R. Smith8, V. Solochenko25, Y. Soloviev26, A. Specka29, J. Spiekermann9, S. Spielman29, H. Spitzer14, F. Squinabol28, R. Starosta1, M. Steenbock14, P. Steffen12, R. Steinberg2, H. Steiner12,40, B. Stella33, A. Stellberger16, J. Stier12, J. Stiewe16, U. Stößlein36, K. Stolze36, U. Straumann15, W. Struczinski2, J.P. Sutton4, S. Tapprogge16, M. Taševský32, V. Tchernyshov25, S. Tchetchelnitski25, J. Theissen2, C. Thiebaux29, G. Thompson21, P. Truöl38, J. Turnau7, J. Tutas15, P. Uelkes2, A. Usik26, S. Valkár32, A. Valkárová32, C. Vallée24, D. Vandenplas29, P. Van Esch5, P. Van Mechelen5, Y. Vazdik26, P. Verrecchia10, G. Villet10, K. Wacker9, A. Wagener2, M. Wagener34, A. Walther9, B. Waugh23, G. Weber14, M. Weber12, D. Wegener9, A. Wegner27, T. Wengler15, M. Werner15, L.R. West4, T. Wilksen12, S. Willard8, M. Winde36, G.-G. Winter12, C. Wittek14, E. Wünsch12, J. Žáček32, D. Zarbock13, Z. Zhang28, A. Zhokin25, F. Zomer28, J. Zsembery10, K. Zuber16, and M. zurNedden38
I. Physikalisches Institut der RWTH, Aachen, Germanya
III. Physikalisches Institut der RWTH, Aachen, Germanya
Institut für Physik, Humboldt-Universität,
Berlin, Germanya
School of Physics and Space Research, University of Birmingham,
Birmingham, UKb
Inter-University Institute for High Energies ULB-VUB, Brussels;
Universitaire Instelling Antwerpen, Wilrijk; Belgiumc
Rutherford Appleton Laboratory, Chilton, Didcot, UKb
Institute for Nuclear Physics, Cracow, Polandd
Physics Department and IIRPA,
University of California, Davis, California, USAe
Institut für Physik, Universität Dortmund, Dortmund,
Germanya
10 CEA, DSM/DAPNIA, CE-Saclay, Gif-sur-Yvette, France
11 Department of Physics and Astronomy, University of Glasgow,
Glasgow, UKb
12 DESY, Hamburg, Germanya
13 I. Institut für Experimentalphysik, Universität Hamburg,
Hamburg, Germanya
14 II. Institut für Experimentalphysik, Universität Hamburg,
Hamburg, Germanya
15 Physikalisches Institut, Universität Heidelberg,
Heidelberg, Germanya
16 Institut für Hochenergiephysik, Universität Heidelberg,
Heidelberg, Germanya
17 Institut für Reine und Angewandte Kernphysik, Universität
Kiel, Kiel, Germanya
18 Institute of Experimental Physics, Slovak Academy of
Sciences, Košice, Slovak Republicf
19 School of Physics and Chemistry, University of Lancaster,
Lancaster, UKb
20 Department of Physics, University of Liverpool,
Liverpool, UKb
21 Queen Mary and Westfield College, London, UKb
22 Physics Department, University of Lund,
Lund, Swedeng
23 Physics Department, University of Manchester,
Manchester, UKb
24 CPPM, Université d’Aix-Marseille II,
IN2P3-CNRS, Marseille, France
25 Institute for Theoretical and Experimental Physics,
Moscow, Russia
26 Lebedev Physical Institute, Moscow, Russiaf
27 Max-Planck-Institut für Physik,
München, Germanya
28 LAL, Université de Paris-Sud, IN2P3-CNRS,
Orsay, France
29 LPNHE, Ecole Polytechnique, IN2P3-CNRS,
Palaiseau, France
30 LPNHE, Universités Paris VI and VII, IN2P3-CNRS,
Paris, France
31 Institute of Physics, Czech Academy of
Sciences, Praha, Czech Republicf,h
32 Nuclear Center, Charles University,
Praha, Czech Republicf,h
33 INFN Roma and Dipartimento di Fisica,
Universita ”La Sapienza”, Roma, Italy
34 Paul Scherrer Institut, Villigen, Switzerland
35 Fachbereich Physik, Bergische Universität Gesamthochschule
Wuppertal, Wuppertal, Germanya
36 DESY, Institut für Hochenergiephysik,
Zeuthen, Germanya
37 Institut für Teilchenphysik,
ETH, Zürich, Switzerlandi
38 Physik-Institut der Universität Zürich,
Zürich, Switzerlandi
39 Visitor from Yerevan Phys. Inst., Armenia
40 On leave from LBL, Berkeley, USA
† Deceased
a Supported by the Bundesministerium für Bildung, Wissenschaft,
Forschung und Technologie, FRG,
under contract numbers 6AC17P, 6AC47P, 6DO57I, 6HH17P, 6HH27I,
6HD17I, 6HD27I, 6KI17P, 6MP17I, and 6WT87P
b Supported by the UK Particle Physics and Astronomy Research
Council, and formerly by the UK Science and Engineering Research
Council
c Supported by FNRS-NFWO, IISN-IIKW
d Supported by the Polish State Committee for Scientific Research,
grant nos. 115/E-743/SPUB/P03/109/95 and 2 P03B 244 08p01,
and Stiftung für Deutsch-Polnische Zusammenarbeit,
project no.506/92
e Supported in part by USDOE grant DE F603 91ER40674
f Supported by the Deutsche Forschungsgemeinschaft
g Supported by the Swedish Natural Science Research Council
h Supported by GA ČR, grant no. 202/93/2423,
GA AV ČR, grant no. 19095 and GA UK, grant no. 342
i Supported by the Swiss National Science Foundation
1 Introduction
The study of heavy quark production in lepton-proton scattering provides an important testing ground for the standard model [2]. At the electron-proton collider HERA, heavy quarks are produced, according to QCD, by direct and hadronic (resolved) photon processes. The direct photon gluon fusion process where a photon emitted by the electron and a gluon from the proton generate a pair is expected to dominate. The major contribution is due to the exchange of an almost real photon (photoproduction), where the negative squared four-momentum transfer carried by the photon is . The scattered electron is either lost in the beampipe or detected at small angles with respect to the electron beam direction. The fraction of events where the scattered electron is seen in the main detector (Deep Inelastic Scattering, DIS, ) is at least one order of magnitude smaller [3]. Measurements at HERA can be considered as a continuation of fixed-target photoproduction experiments [4], but at about one order of magnitude higher centre-of-mass (CM) energies, .
In the Weizsäcker-Williams Approximation (WWA) [5], the electroproduction cross section is expressed as a convolution of the flux of photons emitted by the electron, , with the photoproduction cross section
| (1) |
where represents the fraction of the electron energy transferred to the photon in the proton rest frame. For the direct photoproduction process, the cross section , in turn, is assumed in leading order to factorize into the photon gluon fusion cross section and the gluon density in the proton
| (2) |
Here denotes the momentum fraction of the proton carried by the gluon and the factorization scale. Estimates of the cross sections depend on the behaviour of the gluon density distribution of the proton at small , on the QCD renormalization scale, on the factorization scale, and on the heavy quark mass [6].
Next-to-leading order (NLO) corrections to the parton cross section [6, 7] are found to be substantial, but are reduced by experimental selection criteria, which limit the acceptance to the central rapidity range in the CM system at large transverse momenta [6].
Charm photoproduction can also proceed via the hadronic component of the photon (resolved photon processes), where a parton inside the photon scatters off a parton inside the proton, e.g. This process known to dominate light quark production is expected to contribute much less to the production of charmed quark pairs [6]. However, the production cross section still depends strongly on the parton density function of the photon [8]. Other mechanisms, as for example the production of charm in the fragmentation process, which is suppressed by the mass of the charm quark, or the production from the intrinsic charm content of the nucleon [9], are believed to be small. These processes, as well as any possible intrinsic charm component of the photon, are neglected in the present analysis.
Heavy quark production offers in principle the possibility of probing the gluon distribution in the proton and the photon either indirectly, by measurement of the total photoproduction cross section or of differential distributions, or directly, by the explicit reconstruction of . Measurements of the first kind are described here. A similar measurement of has also been reported by the ZEUS Collaboration [10].
The analysis makes use of the -tagging [11], i.e. of the tight kinematical conditions in the decay111Henceforth, charge conjugate states are always implicitly included. , where the mesons are reconstructed in the decay channel . A better resolution is achieved in the distribution of the mass difference
| (3) |
than in the mass distribution itself, whose width is dominated by the momentum resolution of the detector.
The contribution of mesons, originating from decays of flavoured hadrons is neglected, because of the expected small production cross section at HERA ((5 nb) [12]). mesons from decays of higher-mass charm states (e.g. are not separated.
Recently, much interest has been focused on a subclass of electroproduction events in which there is no hadronic energy flow in an interval of pseudorapidity, , adjacent to the proton beam direction. These diffractive processes are interpreted as an exchange of a colour-less object with the quantum numbers of the vacuum. The study of charm production in these processes is expected to provide information on the partonic structure of diffractive exchange.
2 Analysis
The present analysis is based on data collected with the H1 detector during the 1994 running period of the HERA collider, where 27.5 GeV positrons collided with 820 GeV protons, at a CM energy of 300 GeV. A detailed description of the detector and its trigger capabilities can be found elsewhere [13].
2.1 Detector Description
Charged particles are measured by two cylindrical jet drift chambers [14, 15], mounted concentrically around the beamline inside a homogeneous magnetic field of 1.15 Tesla, yielding particle charge and momentum from the track curvature in the polar angular range222H1 is using a right-handed coordinate system with the axis pointing in the direction of the proton beam (forward), the axis pointing towards the centre of the storage ring. The direction of the incoming positron beam is termed backward. The polar angle is measured with respect to the proton direction. of 20∘ to 160∘. Two double layers of cylindrical multiwire proportional chambers (MWPC) [16] with pad readout for triggering purposes are positioned inside and in between the two drift chambers, respectively. The tracking detector is surrounded by a fine grained liquid argon calorimeter [17], consisting of an electromagnetic section with lead absorbers and a hadronic section with steel absorbers. It covers polar angles between 4∘ and 155∘. The luminosity is determined from the rate of Bethe-Heitler bremsstrahlungs events. The luminosity system consists of an electron detector and a photon detector, located 33 m and 103 m from the interaction point in the positron beam direction, respectively. The electron detector is used to tag photoproduction events by detecting positrons scattered at small angles. A time-of-flight system (TOF) is located in the backward direction at m.
2.2 Data selection and reconstruction
The analysis is carried out independently for the case where the scattered positron is detected in the electron tagger and for the case where it is not required to be seen. Henceforth, the respective data samples will be referred to as tagged and untagged sample. They correspond to integrated luminosities of and , respectively. About 20 % of the reconstructed candidates in the tagged sample are also present in the untagged sample.
Proton beam induced background is reduced by requiring the event vertex to lie within cm of the nominal interaction point along the beam direction. A further reduction is achieved by excluding events with energy flow only into the forward region of the detector.
For each event all possible mass combinations are calculated with tracks of transverse momenta . No particle identification is applied; each particle is assumed to be a kaon or a pion in turn. Pairs with an invariant mass within MeV/c2 of the nominal mass of are combined with an additional track with and a charge opposite to that of the kaon candidate.
Figure 1 shows the distribution of the mass difference (3) for -candidates with and a rapidity for the tagged and untagged samples combined. production is found as a distinct enhancement, containing about 190 combinations in a MeV/c2 window around the expected mass difference of MeV/c2. No enhancement is observed if the mass difference for the wrong charge combinations is used instead, as shown by the shaded histogram in figure 1. The number of candidates is obtained from a simultaneous fit to signal and background events in the right-sign (RS) and wrong-sign (WS) distributions of the spectra. The signal is described by a Gaussian and the background shape is parametrized by a function of the form , (i=RS, WS). The position and the width of the signal are determined from a fit to a larger data sample using additional trigger conditions, and then kept fixed at those values ( MeV/c2, MeV/c2) for all subsequent fits. Uncertainties from variations of the fit procedure are accounted for in the systematic error.
A Monte Carlo simulation is used to determine the efficiency for the reconstruction, the selection cuts, and the acceptance of the detector. Hard scattering events for direct and resolved photoproduction are generated in leading order with the PYTHIA 5.7 program [18]. The generated events are fed into the H1 detector simulation program, and are subjected to the same reconstruction and analysis chain as the real data.
The tracking efficiencies have been examined in detail using data. The single track reconstruction efficiency is obtained by scanning tracks of high cosmic muons, where the measured of the incident track segment is compared with that of the outgoing track segment. The -dependence of is determined directly from the data by a novel method [19] based on the decay property of the pseudoscalar meson, decaying isotropically in its rest frame. The efficiency is found to rise from 0 to the maximum value between MeV/c and MeV/c, and to remain constant beyond that. The precision measured in these studies is quoted as the systematic error. For single tracks the uncertainty found is for the track reconstruction and for associating the track to the primary vertex. Combining them for the three tracks yields a systematic error of on the tracking efficiency.
2.3 Analysis of electron tagged data
Tagged events are required to have a positron candidate with energy in the electron tagger and to have less than energy deposited in the photon detector. In addition, at least one charged track candidate has to be detected by means of a MWPC trigger [16, 20] and a drift chamber track trigger [21], thus ensuring activity in the central detector. The trigger efficiency is determined from the data itself, using independent triggers. The analysis is restricted to the kinematical region and , where the acceptance of the electron tagger is above with an average value of about . As a consequence, the CM energy range is limited to 159 GeV GeV, with a mean of and an average . The efficiency excluding the dependent electron tagger acceptance is found to be and for direct and resolved processes, respectively.
2.4 Analysis of untagged data
The untagged sample covers the kinematical region and at an average . Contributions from DIS with are rejected by requiring that no scattered positron candidate with GeV be measured in the main detector. The remaining background from DIS events is suppressed by requiring and is estimated to be less than 1 %. Here is calculated from all measured final state particles using the Jacquet-Blondel method [22].
The events are triggered by a combination of signals from the central and rear parts of the detector. At least one MWPC track candidate is required to point backwards into the region . The backward TOF system must positively identify the event as a genuine collision by registration of a particle within the proper interaction time window and within its angular acceptance of approximately . The trigger efficiency for the central MWPC and drift chamber trigger components is determined by simulation to be . For the backward part it is obtained from data, imposing the same selection criteria but using independent triggers based on local coincidences of MWPC tracks and low threshold () signals in the liquid-argon (LAr) calorimeter [23]. Sufficient statistical precision to determine the efficiency in bins of and is achieved by including the sideband region of the mass difference signal, , and the wrong sign combinations. To account for the different event topology of the combinatorial background the efficiency is determined and parametrized as a function of and then folded with the spectrum of simulated events. This yields efficiencies of the backward trigger component of for direct and for resolved production processes, respectively.
3 Results
The visible production cross section in collisions is calculated from the observed number of mesons, , in the kinematical ranges of and rapidity according to the formula
| (4) |
where denotes the integrated luminosity, the total efficiency, and [24] is the combined branching fractions of and mesons. For the analysis of the tagged sample, the acceptance of the electron tagger and its trigger efficiency are accounted for on an event-by-event basis. For the relative ratio of direct to resolved photoproduction processes the values predicted by the NLO QCD calculation are used (i.e. 79:21 for the full range or 93:7 for the visible kinematical range). The charm quark mass is assumed to be GeV/c2, the ratios of the factorization scale for the photon, the factorization scale for the proton, and the renormalization scale are taken to be , and , as recommended by the authors [6].
3.1 Visible cross section
In the tagged sample the fitted number of mesons, , is corrected for the electron tagger acceptance [25], yielding . For the kinematical region , , GeV2, and the visible production cross section is determined to be
| (5) |
where the errors refer to the statistical and the experimental systematic error (see below).
In the case of untagged events, the fitted number of mesons is events and the average total efficiency for and is found to be . The cross section in the kinematical region , is thus measured as
| (6) |
The visible cross section is almost insensitive to both the choice of parton density parametrizations and to the mixture of direct and resolved photoproduction processes, because the efficiencies are very similar and there is no acceptance correction involved.
The experimental systematic uncertainties are listed in table 1. In the analysis of tagged data, the largest contribution () is due to the uncertainty in the track reconstruction, whereas in the untagged case the largest error arises from a uncertainty in the determination of the trigger efficiency. Adding the various uncertainties in quadrature results in a total experimental systematic error for the tagged sample of for the inclusive cross section and for the charm cross section (see below), respectively. For the untagged sample the corresponding uncertainties are and .
| Tagged | Untagged | |
| Track trigger | 5 | 5 |
| Electron tagger acceptance | 5 | — |
| Backward trigger | — | 14 |
| Track reconstruction | ||
| Signal extraction/background subtraction | 6 | 6 % |
| Luminosity | 1.5 | 1.5 |
| branching ratios | 4 % | 4 % |
| branching fraction | 7 % | 7 % |
| Total experimental uncertainty |
Predictions by the NLO QCD calculation for the visible cross section in the tagged case assuming the following pairs of proton and photon parton densities of (GRV HO[26] + GRV-G HO[26]), (MRSA’[27] + GRV-G HO), (MRSD0’[28] + GRV-G HO) and (MRSA’ + LAC1[29]) yield values of 3.2, 2.8, 2.4 and 2.8 nb respectively. With the present accuracy a clear distinction is not possible, albeit a slightly better agreement is reached for parton densities with a rising gluon density distribution at low . A similar conclusion results from the analysis of the untagged data. This is in agreement with measurements of the gluon density by other methods [30], e.g. from scaling violations of in DIS.
3.2 Total cross sections and
The visible cross sections (within a limited phase space) have to be extrapolated to the full phase space to obtain the total cross sections.
The individual acceptances for the direct and resolved processes as well as their relative strength depend on the choice of the parton densities, and therefore so also does the extrapolation performed by simulation. This is illustrated in table 2, which lists values for the acceptance calculated for various parton densities of the proton and photon and for different charm quark masses, for the kinematical region of the tagged sample. The numbers for the untagged case are similar. The acceptance is defined as the fraction of mesons within the quoted and ranges with respect to the total number of produced .
The derivation of the total cross sections is based on simulations using a charm quark mass of 1.5 GeV/c2 and assuming the GRV LO [31] parametrizations for both the proton and photon parton densities, which are in good agreement with measured parton densities. This leads to a charm production cross section of nb at and for the full -range. The effect of hadronization is included using the fragmentation fraction [32]. The -cross section is converted into a cross section using equation (1), which yields for
| (7) |
For the untagged case the result over the range of becomes
| (8) |
The third error indicates the additional extrapolation uncertainty as discussed below. The larger available kinematic range in allows a division into the two regions and , thus providing information about the energy dependence of the cross section.
| Proton | Photon | ||
| parton density | parton density | [GeV/c2] | Acceptance |
| GRV LO [31] | — | ||
| GRV LO [31] | — | ||
| GRV LO [31] | — | ||
| MRSG [33] | — | ||
| MRSA’ [27] | — | ||
| GRV LO [31] | GRV LO [31] | ||
| GRV LO [31] | LAC1 [29] |
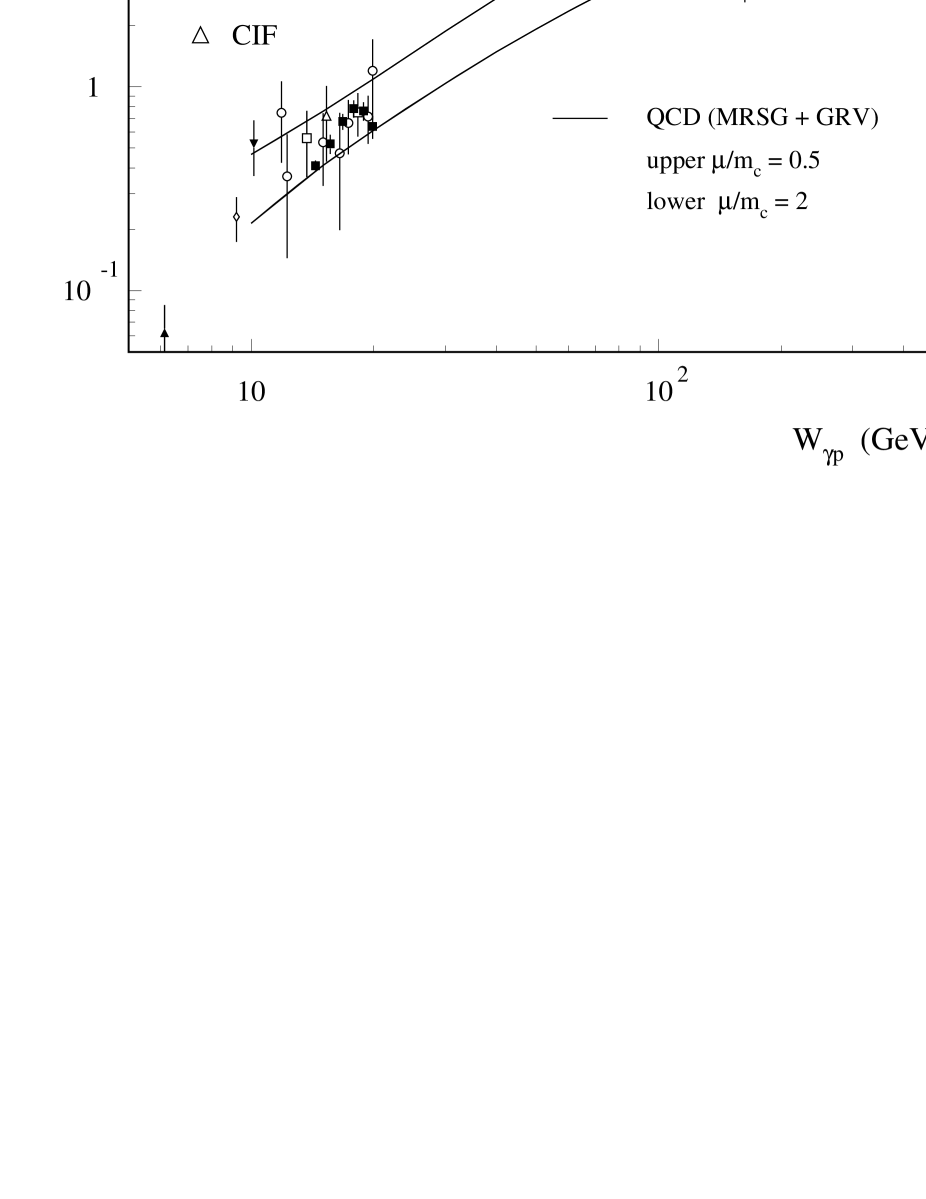
The results are summarized in table 3 for both analyses and compared in figure 2 with measurements by the ZEUS collaboration (at similar [10], and previous fixed-target experiments at lower energies [4]. The inner error bars represent the statistical and experimental systematic errors added in quadrature. The outer set of error bars indicate the total error after adding in quadrature the extrapolation uncertainty discussed below. The cross section is rising by almost one order of magnitude as compared to the low energy measurements.
Overlaid in figure 2 are predictions by the NLO QCD calculation [6] with parton density parametrizations MRSG [33] for the proton and GRV-G HO [26] for the photon. The upper and the lower solid lines delimit the range of values expected due to a variation of the renormalization scale within .
| Quantity | Tagged | Untagged | Untagged |
|---|---|---|---|
| Range in (GeV) | 159 - 242 | 95 - 190 | 190 - 268 |
| Range in (GeV2) | |||
| candidates | 119 | ||
| (direct) | |||
| Photon flux | 0.0141 | 0.0486 | 0.0155 |
| [] (nb) | 11.0 | 8.5 | |
| Errors | |||
| [] () | 13.2 | 9.3 | 20.6 |
| Errors |
Calculating with other combinations of parton density parametrizations increases the measured by up to 75% (in the case of MRSG and LAC1), or decreases by up to 35% (in the case of MRSA’ and GRV-G HO). This variation reflects the uncertainties due to the choice of parton densities, and is quoted separately as a third error in the cross sections. The extrapolation uncertainty due to fragmentation models (, estimated by a comparison with a cluster fragmentation as implemented in the Herwig program [34]) and due to the choice of the charm quark mass (see table 2) is not included in the error.
If the extrapolation is based on the proton parton density parametrizations MRSG, MRSA’ or MRSD0’ [28], the value of obtained (for the tagged sample at GeV) becomes b, b or , which are to be compared with the QCD predictions of 9.8 b, 6.0 b or 3.9 b, respectively. Measurement and prediction change in the same manner. Hence a total cross section measurement can presently not distinguish between the different gluon densities.
3.3 Differential distributions
Differential photoproduction cross section distributions, in the visible region where no model dependent uncertainties enter from extrapolation, are obtained by determining the acceptances and efficiencies bin-by-bin, separately for the two analyses. The distributions are shown in figures 3a and 4a integrated over the range GeV/c GeV/c. The distributions are presented in figures 3b and 4b for the rapidity range of The results from the analyses of the tagged and untagged samples are not combined because they cover different (and ) ranges. Note that the largest overlap between the two samples, namely 10 candidates, occurs in the bin of . The error bars represent the statistical error and, for the untagged data, the bin-by-bin systematic error due to the trigger efficiency. The other systematic errors of the overall normalization are identical to the errors quoted in table 1.
The histograms shown in figures 3 and 4 represent the absolute predictions of the QCD calculation [6] including charm quark hadronization using the Peterson fragmentation function [35] (with parameter , and containing both direct and resolved photon processes. The calculations assume the parton densities MRSG for the proton and GRV-G HO for the photon, unless stated otherwise. The histograms are averages of calculations done at three representative values, weighted by the photon flux integrated over the represented range. Good agreement within errors is observed between the shape of the measured distribution and the NLO QCD calculation. The distributions on the other hand do not agree so well, with a possible excess of the data in the forward direction.
To demonstrate the dependence on the charm quark mass, the predictions for masses and are also given in figure 3 (dashed histogram). In figure 4 the influence of different proton parton density functions is illustrated by overlaying QCD predictions based on the MRSA’ parametrization (dashed histogram). The effect of assuming the LAC1 photon parton density parametrization (and MRSG for the proton) is marginal (dotted histogram). Although the total charm cross section is considerably larger when using LAC1, most of the difference with respect to using for example the GRV-G HO parametrization lies in the forward region () and at low , outside of the visible range of this measurement.
4 Diffractive photoproduction of charm quarks
A search for production by diffractive processes is performed in a sample of rapidity gap events, in which no final state hadronic energy flow is detected adjacent to the proton direction. The selection of diffractive events is based on a cut in and is described elsewhere [36]. Here denotes the pseudorapidity of the most forward calorimetric energy deposit in excess of 400 MeV. The selection of candidate events and the rejection of contributions from DIS are identical to those used in the analysis of untagged data as described above. However, because of the small signal expected, the analysis has not been restricted to a particular trigger condition, and thus comprises an integrated luminosity of 2.77 pb-1.
The mass difference distribution for the selected events is shown in figure 5a, exhibiting a clear signal. To substantiate the evidence for a diffractive production process, the distribution of the candidate events after background subtraction estimated from wrong charge combinations, is depicted in figure 5b. The distribution shows that most events have values close to the maximum possible value (), but a clear excess of events with is observed. The data are compared with predictions of a non-diffractive model (as implemented in the PYTHIA [18] program) and a hard diffractive model (RAPGAP [37]). The former (latter) is normalized to the number of data events at (). The sum of both models describes the shape of the data well (solid histogram in figure 5b), while the non-diffractive model alone fails to reproduce the shape of the distribution (hatched histogram).
A lower limit on the visible diffractive cross section for the kinematical region , , GeV/c, and is derived. Assuming the trigger efficiency in this range to be 1 yields a conservative limit of
| (9) |
The cross section limit can be compared with the predictions of the diffractive model [37], which assumes a partonic structure of the diffractive exchange. If the diffractive exchange is dominated by a hard gluon [36] at an initial scale of , a cross section of 780 pb is predicted. On the other hand, if a quark dominated structure is assumed, the prediction is 29 pb in this model. The measured cross section is much higher then the latter prediction. Therefore, the data clearly disfavour a quark-dominated diffractive exchange.
5 Conclusions
Charm photoproduction cross sections have been measured through the detection of mesons. At an average CM energy of 200 GeV the result is b for with . For the range with the values are b at GeV, and b at GeV. These values are about one order of magnitude larger than those measured at previous fixed-target photoproduction experiments. Both the dependence of the photoproduction cross section and its dependence on - and to a lesser extent on - of the meson are reasonably well described by NLO QCD calculations. A slightly better agreement is reached with a steep gluon momentum distribution in the proton. This is in accord with measurements of the gluon density by other methods [30]. The measured visible cross sections appear to be somewhat higher than the absolute QCD predictions. Evidence for charm production is found in a subsample of events which show a distinct gap of energy flow close to the direction of the proton and which can be interpreted as photon diffractive dissociation. A quark dominated diffractive exchange is clearly disfavoured by the present measurement.
Acknowledgments
We are very grateful to the HERA machine group whose outstanding efforts have made and continue to make this experiment possible. We thank the engineers and technicians for their work in constructing and now maintaining the H1 detector, the funding agencies for financial support, the DESY technical staff for continual assistance, and the DESY directorate for the hospitality extended to the non-DESY members of the collaboration. We thank Stefano Frixione for giving advice on performing the QCD calculations.
References
- [1]
-
[2]
A. Ali et al., Proc. of the HERA Workshop, DESY,
Hamburg, Vol. 1 (1988) 395;
A. Ali and D. Wyler, Proc. of the Workshop “Physics at HERA”, DESY, Hamburg, Vol. 2 (1991) 667 (and references therein). - [3] “Charm production in deep inelastic scattering at HERA”, H1 Coll., contributed paper EPS-0785 to the Int. Europhysics Conference on High Energy Physics, Brussels, 1995.
-
[4]
M.S. Atiya et al. (CIF Coll.),
Phys.Rev.Lett. 43 (1979) 414;
A.R. Clark et al. (BFP Coll.), Phys.Rev.Lett. 45 (1980) 682;
K. Abe et al. (SLAC HFP Coll.), Phys.Rev. D30 (1984) 1;
M. Arneodo et al. (EMC Coll.), Z.Phys. C35 (1987) 1;
J.J. Aubert et al. (EMC Coll.),Nucl.Phys. B213 (1983) 31; Phys.Lett. B167 (1986) 127;
M. Adamovich et al. (PEC Coll.), Phys.Lett. B187 (1987) 437;
J.C. Anjos et al. (E691 Coll.), Phys.Rev.Lett. 65 (1990) 2503;
D. Aston et al. (WA4 Coll.),Phys.Lett. B94 (1980) 113. -
[5]
C.F. Weizsäcker, Z.Phys. 88 (1934) 612;
E.J. Williams, Phys.Rev. 45 (1934) 729. - [6] S. Frixione et al., Phys.Lett. B348 (1995) 633; Nucl.Phys. B454 (1995) 3.
-
[7]
R.K. Ellis and P. Nason, Nucl.Phys. B312 (1989) 551;
P. Nason, S. Dawson, and R.K. Ellis, Nucl.Phys. B303 (1988) 607;
J. Smith and W.L. Van Neerven, Nucl.Phys. B374 (1992) 36. - [8] S. Frixione et al., Nucl.Phys. B412 (1994) 225; Nucl.Phys. B431 (1994) 453.
-
[9]
S.J. Brodsky, P. Hoyer, C. Peterson, and N. Sakai,
Phys.Lett. 93B (1980) 451;
S.J. Brodsky, C. Peterson, and N. Sakai, Phys.Rev. D23 (1981) 2745;
G.A. Schuler, Nucl.Phys. B299 (1988) 21;
G. Ingelman, L. Jönsson, and M. Nyberg, DESY 92-178 (1992). - [10] M. Derrick et al. (ZEUS Coll.), Phys.Lett. B349 (1995) 225.
- [11] G. Feldmann et al., Phys. Rev. Lett. 38 (1977) 1313.
- [12] R. A. Eichler and Z. Kunszt, Nucl. Phys. B308 (1988) 791.
- [13] I. Abt et al. (H1 Coll.), “The H1 Detector at HERA,” DESY 93-103 (1993).
- [14] J. Bürger et al., Nucl.Instr.Meth. A279 (1989) 217.
- [15] I. Abt et al. (H1 Coll.), Phys.Lett. B328 (1994) 176.
- [16] K. Müller et al., Nucl.Instr.Meth. A312 (1992) 457.
- [17] B. Andrieu et al., Nucl.Instr.Meth. A336 (1993) 460.
- [18] T. Sjöstrand, CERN-TH-6488 (1992), Comp.Phys.Comm. 82 (1994) 74.
- [19] W. Erdmann, Dissertation, ETHZ Zürich, No. 11441, 1996, unpublished.
- [20] S. Eichenberger et al., Nucl.Instr.Meth. A323 (1992) 532.
- [21] T. Wolff et al., Nucl.Instr.Meth. A323 (1992) 537.
- [22] A. Blondel and F. Jacquet, Proceedings of the Study of an Facility for Europe, ed. U. Amaldi, DESY 79-48 (1979) 391.
- [23] D. Müller, Diploma Thesis, University Zürich, 1994, unpublished.
- [24] Particle Data Group, M.Aguilar-Benitez et al., Phys. Rev. D50 (1994) 1173.
- [25] T. Ahmed et al. (H1 Coll.), Z.Phys. C66 (1995) 529; Z.Phys. C69 (1995) 27.
- [26] M. Glück, E. Reya, and A. Vogt, Phys.Rev. D45 (1992) 3986.
- [27] A.D. Martin, R.G. Roberts, and W.J. Stirling, RAL-94-104 (1994).
- [28] A.D. Martin, R.G. Roberts, and W.J. Stirling, Phys.Lett. B306 (1993) 145.
- [29] A. Levy, H. Abramowicz, and K. Charchula, Phys.Lett. B269 (1991) 458.
-
[30]
S. Aid et al. (H1 Coll.), Phys.Lett. B354 (1995) 494;
Nucl.Phys. B449 (1995) 3; DESY-96/039;
M. Derrick et al. (ZEUS Coll.), Phys.Lett. B345 (1995) 576. - [31] M. Glück, E. Reya, and A. Vogt, Phys. Lett. B306 (1993) 391.
-
[32]
R. Akers et al. (OPAL Coll.), CERN PPE 94/217 (1994);
LEP Coll., CERN-PPE-96/017. - [33] A.D. Martin, R.G. Roberts, and W.J. Stirling, RAL-94-055 (1994).
- [34] G. Marchesini et al., Comp. Phys. Comm. 67 (1992) 465.
- [35] C. Peterson, D. Schlatter, I. Schmitt, and P.M. Zerwas, Phys.Rev. D27 (1983) 105.
- [36] T. Ahmed et al. (H1 Coll.), Nucl.Phys. B435 (1995) 3; Phys.Lett. B348 (1995) 681.
- [37] H. Jung, Comp.Phys.Comm. 86 (1995) 147.