The Čerenkov Correlated Timing Detector:
Beam Test Results from Quartz and Acrylic Bars
Abstract
Several prototypes of a Čerenkov Correlated Timing (CCT) Detector have been tested at the KEK-PS test beam line. We describe the results for Čerenkov light yields and timing characteristics from quartz and acrylic bar prototypes. A Čerenkov angle resolution is found to be 15 mrad at a propagation distance of 100 cm with a 2 cm thick quartz bar prototype.
1 Introduction
The Čerenkov Correlated Timing (CCT) Detector is a new particle identification concept based on precision timing measurements to determine the Čerenkov angle of photons emitted by particles passing through a transparent radiator [1]. In order to investigate the detector concept, several prototypes have been tested at the KEK-PS test beam line, as tabulated in Table 1. Material tests have been done in parallel with measurements of the optical characteristics [2]. The beam test data are well reproduced by Monte Carlo simulation, so that the feasibility of the CCT detector concept has been demonstrated. We describe the results mainly from a quartz bar prototype and summarize the results from other prototypes for comparison.
2 Experiment
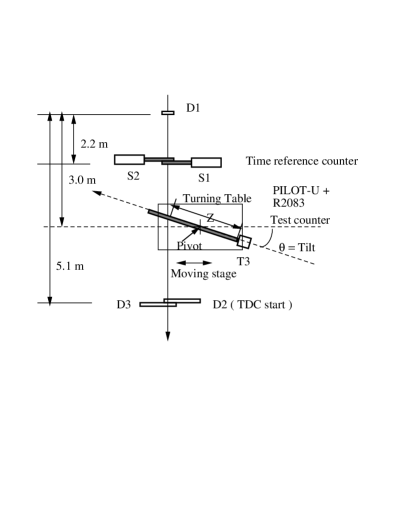
2.1 Beam test setup
The beam test setup at the KEK-PS T1 beam line is shown in Figure 1. CCT prototypes are placed on a rotating table which is mounted on a moving stage, so that the beam position and the crossing angle can be adjusted independently. The accuracies in positioning the prototype counter were 0.5 cm along the counter axis and 1o in tilt angle, respectively. The beam was defined by two sets of beam definition counters D1 and D2D3, which were separated by about 5 m. Their areas were 22 cm2 and 11 cm2, respectively, thus the divergence of the beam was expected to be about 2 mrad. Čerenkov light yields and timing characteristics were investigated as function of beam position (Z) and tilt angle () of the counter, using a 1.5 GeV/c beam.
2.2 CCT prototypes
The tested CCT prototypes are tabulated in Table 1. Details of the material characteristics are described in Ref. [2]. The Acrylic bars had been annealed for 10 hours at 80oC to release internal stress after machining and polishing. A support for the Zygo quartz bar CCT was carefully designed to avoid a sizable loss of photons during total internal reflection. As the edges were machined very sharply and fragile, the mechanical contacts were made of Teflon and designed to touch only the surfaces and not the edges with the contact areas minimized. This point is very important to realize an attenuation length of several 10’s of m, whose reflectivity per bounce is expected to be on the order of 0.9995. One end of the counter was viewed by a phototube and the opposite end was blackened to avoid reflection.
| Prot. | (1) | (2) | (3) | (4) |
| Test Run | Mar.95 | Nov.94 | ||
| Prep. | KEK | U.I. | KEK | |
| Mater. | Quartz | Quartz | Acrylic | Acrylic |
| Prod. | Zygo | S. Finish | Mitsubishi | Kuraray |
| Index | 1.47 | 1.47 | 1.51 | 1.51 |
| Thickness | 2 cm | 4 cm | 3 cm | 5 cm |
| Width | 4 cm | 4 cm | 4 cm | 6 cm |
| Length | 120 cm | 100 cm | 150 cm | 100 cm |
| Couplant | Viscasil | OKEN 6262A | ||
| PMT | H2431 | |||
| (pe/cm) | 136 | 120 | 66 | 82 |
| (m) | 13.6 | 1.8 | 1.43 | 1.45 |
| (ps) | 80 | 80 | 105 | 95 |
| (mrad) | 15 | 15 | 20 | 20 |
The same photomultiplier tube (Hamamatsu H2431) was used to measure the light yield and timing characteristics of all of the prototypes. The rise time and the transit time spread () are 0.7 ns and 160 ps. The gain of the tube was calibrated by using a laser pulser (Hamamatsu PLP-02) in single photon mode. A gain of 3.65 ADC counts per photoelectron was obtained at an operating voltage of 3100V, with an error of 10. The H2431 is 2” tube, with an effective photocathode diameter of 46 mm, and a borosilicate window with a bi-alkali photocathode. It is sensitive in the wavelength range between 300 nm to 500 nm and has a peak quantum efficiency of 25% at about 350 nm. The photocathode sensitivity curve is taken into account in MC simulation.
2.3 Čerenkov light yield of Zygo bar CCT
The signals from the CCT counters were read out by CAMAC TDC and ADC modules, with a least count of 25 ps and 0.25 pC, respectively. Light yields were evaluated from the ADC data and the gain described above. Figure 2 shows the light yield measured for a Zygo quartz bar CCT, as a function of tilt angle at Z= 60 cm. The light yield shows a rapid decrease from to a cutoff around = -7o corresponding to a critical angle. However, there is seen a non zero light yield below = -10o, where none of Čerenkov photons could reach the readout phototube. These are due to Čerenkov photons from -rays produced by the beam passage. The details of -ray Čerenkov contribution will be discussed in Section 4.
The dotted line shows a Monte Carlo prediction with a Čerenkov quality factor of 155 pe/cm, obtained by a fit to the data, as described below and in Section 3. Our measurement of is 20% larger than the results measured at SLAC [3] (124 pe/cm) and Princeton Univ [4] (121 pe/cm) with cosmic rays. The solid line shows the prediction with = 124 pe/cm. This excess is attributable to the photocathode sensivity and/or some contribution from -ray Čerenkov photons from the 1.5GeV beam.
was obtained from the data using Equation 1,
| (1) |
where is Čerenkov angle, d is thickness of CCT counter, and is a tilt angle of the counter to the beam. G is a collection efficiency of photons in a given CCT counter geometry, and it is evaluated by a Monte Carlo simulation using Equation 2,
| (2) |
is number of photoelectrons expected by MC simulation, is Čerenkov photon density and is photocathode sensitivity.
Figure 3 shows Čerenkov light yield as a function of distance Z at three tilt angles: = 0o, 20o and 40o. Reflectivity per bounce is found to be 0.99960.0003 by a fit. The dotted lines show the predictions with =155 pe/cm and = 0.9996. The peaks at shortest distances are not predicted by this MC simulation. The attenuation lengths in the region of Z20 cm were found to be 10.70.4 m, 13.62.2 m and 43.826.7 m, respectively.


2.4 Timing characteristics of the Zygo bar CCT
The discriminator level was set at 50 mV, which corresponded to a few photoelectron signal. The start time jitter for each run was evaluated to be 4050 ps, and it was subtracted in quadrature to obtain the intrinsic time resolution for each of the CCT prototypes.
The start time for each event was evaluated using a pair of start scintillation counters S1 and S2. Each TDC measurement was corrected from time walk by using a formula . Figure 4 shows the fitted slope parameter as function of Z and . The parameter b shows very little dependence on Z at = 40o, while it shows a strong correlation with Z at = 20o and 0o. This is due to contamination from -ray Čerenkov photons. The resultant time resolution was investigated as a function of , and a single value was chosen to correct all of the TDC data. It corresponded to a value of about 400 found at = 40o over all Z, to which all of the values converge at Z15 cm, as shown in Figure 4. Figure 5 shows corrected timing as a function of at Z= 60 cm. Prediction by Monte Carlo simulation shows good agreement with the data, with an rms of 20 ps. In the region of -10o, is almost independent of , suggesting a uniform cosine distribution due to -ray Čerenkov photons.


Figure 8 shows time resolution as a function of Z at the three tilt angles (a) 40o, (b) 20o and (c) 0o, respectively. The ’s being 30 ps at Z= 510 cm, increasing with Z up to 50 ps, 80 ps and 105 ps at Z=100 cm, respectively. The MC predictions ( dotted lines ) show good agreement with the data. A systematic discrepancy is observed at = 0o, which increases up to 20% at Z= 100 cm.
3 Monte Carlo Simulation of CCT prototype
According to the given functions [1] for the Čerenkov photon density and for the dispersion, Čerenkov photons are emitted along the path of particle passage through the CCT counter. Each photon propagates by total internal reflection, at a critical angle given by its wavelength. After many bounces on the counter surface and going through the couplant, some fraction of the Čerenkov photons arrive at read out phototube and emit photoelectrons. The data of M.Griot in Ref. [3] was used to simulate photon absorption in the quartz bar. In this simulation, only two parameters were assumed to be free: reflectivity per bounce (), and a normalization factor (). This corresponds to a peak quantum efficiency (nominally 25%). These parameters were found to be 0.99960.0003 for , and 25% (=155 pe/cm) for by fitting to the data.
We take into account the timing characteristics of the phototube as described in section 2.2. In addition, we introduce a pulse height fluctuation for single photoelectron signals [1] [5]. For this, a Gaussian distribution was assumed, having an average of 3.65 ADC counts and a standard deviation of a half of the average. To simulate the time walk effect, a discriminator was also included. An assumption for of 160 ps is well reproduced for single photoelectron signals, by applying the time walk correction to Monte Carlo data.
4 Effects from -rays
A Monte Carlo simulation using GEANT code has been carried out to study the effects of -rays on quartz bar CCT counters, with 1.5GeV beam. The fraction of the photons from -rays is expected to be 15% at normal beam incidence. The number of beam Čerenkov photons shows a Gaussian (Poisson) distribution, while that from -ray Čerenkov photons shows a rapidly decaying tail peaked at zero. The observed ADC distribution is a sum of those two components.
The angular divergence of the photons from -rays is about 100o in FWHM, showing an almost uniform cosine distribution with respect to the beam direction. The spread in arrival times of photons is expected to be proportional to their propagation length. In contrast, those from a beam particle are well collimated with a divergence of less than 1o in FWHM. The two components behave very differently as function of Z and , so that they are expected to separate at longer Z and at smaller .
Figure 7(a) shows ADC data at Z=60 cm and =. The tail in the ADC and the TDC distributions were separated by a fit to a Gaussian plus a tail. The results are shown in Figure 7(c). 1012% of the photons are attributable to -rays. Subtracting this contribution, a quality factor is calculated to be 136 pe/cm.
Figure 7(b) shows a TDC distribution after time walk correction. The tail at earlier times corresponds to -ray Čerenkov photons. Figure 7(d) shows the results as a function of Z at =. This indicates that 16% of events are triggered by -ray Čerenkov photons at Z= 100 cm. As seen in Figure 7(b), about 10% of events would be triggered at a time earlier by 2 than expected from beam Čerenkov photons. Such a wrong trigger probability due to -ray Čerenkov photons may depend on discrimination level, as well as Z and .

5 Results from other prototypes
In Table 1 are listed the measured Čherenkov quality factors, attenuation length and time resolution at = 20o, and Čerenkov angle resolution () at = 0o. The attenuation length of Surface Finishes (SF) quartz bar is measured to be 1.8 m, which is mainly attributable to its beveled edges. The acrylic bars show a short attenuation length of about 1.4 m and quality factors of 6682 pe/cm.
Figure 8 shows the measured time resolution of a Zygo bar at =20o, as a function of Z, together with other prototype counters. These are separated into groups of quartz and acrylic bars. The curves are fits to a function , assuming that the resolution is a function of the number of bounces of the photons on the surface. The measured resolutions of the quartz bars are worse than the MC prediction by about 25%. As described in section 2.3, 2.4 and in Ref [2], the optical characteristics of the Zygo bar are extremely good, while the obtained time resolutions are almost the same as for the SF bar. The acrylic bars show fairly good time resolutions, in spite of a poorer surface quality and a cutoff at lower wavelength. These are worse only by about 20% as shown in Figure 8. The fraction of -ray Čerenkov photons are also found to be about 16% for the acrylic bars.
Figure 9 shows Čerenkov angle resolution as a function of Z at = and , using the fitted curves to the Zygo quartz bar data. A Čerenkov angle resolution of 15 mrad is expected at a propagation distance of 100 cm and at normal incidence, which corresponds to 3- separation up to a momentum of 1.4 GeV/c.

6 Summary
The Čerenkov light yield and timing characteristics have been investigated for quartz and acrylic bar prototypes with a 1.5 GeV/c beam, and the feasibility of the CCT detector concept has been demonstrated.
The results for a Zygo quartz bar CCT are in good agreement with the previous measurements with cosmic rays. A Čerenkov quality factor of 136 pe/cm and a reflectivity per bounce of 0.99960.0003 have been obtained. The measured Čerenkov light yield and CCT timing performance are well reproduced by Monte Carlo simulation, with the exception of at smaller tilt angles and at larger distances. A Surface Finishes quartz bar showed almost the same as the Zygo bar, in spite of its shorter attenuation length.
Acrylic bars have been investigated and found to show a better than expected , worse only by about 20% than the quartz bars, in spite of a smaller of 6682 pe/cm, a shorter attenuation length of 1.4 m and a marginal surface quality. The number of bounces of photons on the surface seems to be a key factor in determining the time resolution. However, requirements for the surface quality seem not to be strict for CCT performance.
We gratefully acknowledge the support of the Department of Energy, the National Science Foundation, and the A. P. Sloan Foundation. We would also like to express our thanks to Prof. S.Iwata and Prof. F.Takasaki at KEK for their support of this work.

References
- [1] K. Honscheid, M. Selen and M. Sieverz, Nucl. Instrum. Methods A343, 306 (1994).
- [2] Results of Material tests presented at RICH-95 by M. Selen.
- [3] BaBar Detector Technical Design Report, March 1995.
- [4] Results of the BELLE Prototype DIRC presented at RICH-95 by C. Mindas.
- [5] H. Kichimi et al., Nucl. Instrum. Methods A325, 451 (1993).