Y.-T. Tsai
Department of Physics, National Taiwan University, Taipei
P. Chang
Department of Physics, National Taiwan University, Taipei
K. Abe
High Energy Accelerator Research Organization (KEK), Tsukuba
I. Adachi
High Energy Accelerator Research Organization (KEK), Tsukuba
H. Aihara
Department of Physics, University of Tokyo, Tokyo
D. Anipko
Budker Institute of Nuclear Physics, Novosibirsk
A. M. Bakich
University of Sydney, Sydney, New South Wales
U. Bitenc
J. Stefan Institute, Ljubljana
I. Bizjak
J. Stefan Institute, Ljubljana
S. Blyth
National Central University, Chung-li
M. Bračko
High Energy Accelerator Research Organization (KEK), Tsukuba
University of Maribor, Maribor
J. Stefan Institute, Ljubljana
T. E. Browder
University of Hawaii, Honolulu, Hawaii 96822
M.-C. Chang
Department of Physics, Fu Jen Catholic University, Taipei
Y. Chao
Department of Physics, National Taiwan University, Taipei
A. Chen
National Central University, Chung-li
W. T. Chen
National Central University, Chung-li
B. G. Cheon
Hanyang University, Seoul
R. Chistov
Institute for Theoretical and Experimental Physics, Moscow
Y. Choi
Sungkyunkwan University, Suwon
S. Cole
University of Sydney, Sydney, New South Wales
J. Dalseno
University of Melbourne, School of Physics, Victoria 3010
M. Danilov
Institute for Theoretical and Experimental Physics, Moscow
M. Dash
Virginia Polytechnic Institute and State University, Blacksburg, Virginia 24061
J. Dragic
High Energy Accelerator Research Organization (KEK), Tsukuba
A. Drutskoy
University of Cincinnati, Cincinnati, Ohio 45221
S. Eidelman
Budker Institute of Nuclear Physics, Novosibirsk
S. Fratina
J. Stefan Institute, Ljubljana
N. Gabyshev
Budker Institute of Nuclear Physics, Novosibirsk
H. Ha
Korea University, Seoul
J. Haba
High Energy Accelerator Research Organization (KEK), Tsukuba
H. Hayashii
Nara Women’s University, Nara
M. Hazumi
High Energy Accelerator Research Organization (KEK), Tsukuba
D. Heffernan
Osaka University, Osaka
Y. Hoshi
Tohoku Gakuin University, Tagajo
W.-S. Hou
Department of Physics, National Taiwan University, Taipei
Y. B. Hsiung
Department of Physics, National Taiwan University, Taipei
T. Iijima
Nagoya University, Nagoya
K. Ikado
Nagoya University, Nagoya
K. Inami
Nagoya University, Nagoya
A. Ishikawa
Department of Physics, University of Tokyo, Tokyo
R. Itoh
High Energy Accelerator Research Organization (KEK), Tsukuba
M. Iwasaki
Department of Physics, University of Tokyo, Tokyo
Y. Iwasaki
High Energy Accelerator Research Organization (KEK), Tsukuba
J. H. Kang
Yonsei University, Seoul
H. Kawai
Chiba University, Chiba
H. Kichimi
High Energy Accelerator Research Organization (KEK), Tsukuba
H. J. Kim
Kyungpook National University, Taegu
H. O. Kim
Sungkyunkwan University, Suwon
K. Kinoshita
University of Cincinnati, Cincinnati, Ohio 45221
S. Korpar
University of Maribor, Maribor
J. Stefan Institute, Ljubljana
P. Križan
University of Ljubljana, Ljubljana
J. Stefan Institute, Ljubljana
P. Krokovny
High Energy Accelerator Research Organization (KEK), Tsukuba
R. Kulasiri
University of Cincinnati, Cincinnati, Ohio 45221
R. Kumar
Panjab University, Chandigarh
C. C. Kuo
National Central University, Chung-li
A. Kuzmin
Budker Institute of Nuclear Physics, Novosibirsk
Y.-J. Kwon
Yonsei University, Seoul
M. J. Lee
Seoul National University, Seoul
Y.-J. Lee
Department of Physics, National Taiwan University, Taipei
T. Lesiak
H. Niewodniczanski Institute of Nuclear Physics, Krakow
A. Limosani
High Energy Accelerator Research Organization (KEK), Tsukuba
S.-W. Lin
Department of Physics, National Taiwan University, Taipei
D. Liventsev
Institute for Theoretical and Experimental Physics, Moscow
T. Matsumoto
Tokyo Metropolitan University, Tokyo
S. McOnie
University of Sydney, Sydney, New South Wales
T. Medvedeva
Institute for Theoretical and Experimental Physics, Moscow
W. Mitaroff
Institute of High Energy Physics, Vienna
H. Miyata
Niigata University, Niigata
Y. Miyazaki
Nagoya University, Nagoya
G. R. Moloney
University of Melbourne, School of Physics, Victoria 3010
E. Nakano
Osaka City University, Osaka
M. Nakao
High Energy Accelerator Research Organization (KEK), Tsukuba
Z. Natkaniec
H. Niewodniczanski Institute of Nuclear Physics, Krakow
S. Nishida
High Energy Accelerator Research Organization (KEK), Tsukuba
O. Nitoh
Tokyo University of Agriculture and Technology, Tokyo
S. Ogawa
Toho University, Funabashi
T. Ohshima
Nagoya University, Nagoya
S. Okuno
Kanagawa University, Yokohama
Y. Onuki
RIKEN BNL Research Center, Upton, New York 11973
H. Ozaki
High Energy Accelerator Research Organization (KEK), Tsukuba
P. Pakhlov
Institute for Theoretical and Experimental Physics, Moscow
G. Pakhlova
Institute for Theoretical and Experimental Physics, Moscow
L. E. Piilonen
Virginia Polytechnic Institute and State University, Blacksburg, Virginia 24061
Y. Sakai
High Energy Accelerator Research Organization (KEK), Tsukuba
N. Satoyama
Shinshu University, Nagano
T. Schietinger
Swiss Federal Institute of Technology of Lausanne, EPFL, Lausanne
O. Schneider
Swiss Federal Institute of Technology of Lausanne, EPFL, Lausanne
J. Schümann
High Energy Accelerator Research Organization (KEK), Tsukuba
K. Senyo
Nagoya University, Nagoya
M. E. Sevior
University of Melbourne, School of Physics, Victoria 3010
M. Shapkin
Institute of High Energy Physics, Protvino
H. Shibuya
Toho University, Funabashi
J. B. Singh
Panjab University, Chandigarh
A. Somov
University of Cincinnati, Cincinnati, Ohio 45221
M. Starič
J. Stefan Institute, Ljubljana
H. Stoeck
University of Sydney, Sydney, New South Wales
T. Sumiyoshi
Tokyo Metropolitan University, Tokyo
F. Takasaki
High Energy Accelerator Research Organization (KEK), Tsukuba
M. Tanaka
High Energy Accelerator Research Organization (KEK), Tsukuba
G. N. Taylor
University of Melbourne, School of Physics, Victoria 3010
Y. Teramoto
Osaka City University, Osaka
X. C. Tian
Peking University, Beijing
I. Tikhomirov
Institute for Theoretical and Experimental Physics, Moscow
S. Uehara
High Energy Accelerator Research Organization (KEK), Tsukuba
K. Ueno
Department of Physics, National Taiwan University, Taipei
Y. Unno
Hanyang University, Seoul
S. Uno
High Energy Accelerator Research Organization (KEK), Tsukuba
P. Urquijo
University of Melbourne, School of Physics, Victoria 3010
G. Varner
University of Hawaii, Honolulu, Hawaii 96822
K. E. Varvell
University of Sydney, Sydney, New South Wales
S. Villa
Swiss Federal Institute of Technology of Lausanne, EPFL, Lausanne
A. Vinokurova
Budker Institute of Nuclear Physics, Novosibirsk
C. H. Wang
National United University, Miao Li
M.-Z. Wang
Department of Physics, National Taiwan University, Taipei
Y. Watanabe
Tokyo Institute of Technology, Tokyo
E. Won
Korea University, Seoul
A. Yamaguchi
Tohoku University, Sendai
Y. Yamashita
Nippon Dental University, Niigata
M. Yamauchi
High Energy Accelerator Research Organization (KEK), Tsukuba
V. Zhilich
Budker Institute of Nuclear Physics, Novosibirsk
V. Zhulanov
Budker Institute of Nuclear Physics, Novosibirsk
A. Zupanc
J. Stefan Institute, Ljubljana
Abstract
We report on a new search for two-body baryonic decays of the meson.
Improved sensitivity compared to previous Belle results is obtained from 414
fb-1 of data that corresponds to 449 million pairs,
which were
taken on the (4S) resonance and collected with the Belle
detector at the KEKB collider.
No significant signals are observed and we set the 90% confidence level
upper limits: and
.
pacs:
13.25.Hw
††preprint: BELLE Preprint 2007-16KEK Preprint 2007-1
Recent observations of meson
decays into several charmless three-body baryonic final states
show branching fractions around 10-6 and a peak
in the baryon-antibaryon mass spectra near threshold belle-threebody .
Further investigations of the angular correlations for events in the threshold
region angle favor a fragmentation model model . In contrast,
charmless two-body baryonic decays are expected to have lower
branching fractions. However, it is challenging to perform conclusive
theoretical calculations of baryon formation in decay.
Previous searches previous-result ; current-babar
for two-body decays yielded upper limits on the
branching fractions of , which are consistent with a
recent calculation using the pole model HYCheng but in contradiction
with a calculation
based on QCD sum rules sum-rule-model . Moreover, the upper
limit for is also consistent with simple scaling of the
measured branching fraction for belle-lambda-pbar
by the current estimate of , which gives .
Two-body baryonic
decays provide valuable guidance to improve the understanding of quark/gluon
fragmentation of the meson to baryons. In this article we report
searches with better sensitivity for the charmless two-body baryonic decays , and charge-conjugate1 .
The analysis is based on a 414 fb-1 data sample, corresponding to
449 pairs, accumulated at the resonance
with the Belle detector at the KEKB KEKB asymmetric collider.
The Belle detector is a large-solid-angle magnetic spectrometer that
consists of a silicon vertex detector (SVD), a 50-layer
central drift chamber (CDC), an array of aerogel threshold Cherenkov
counters (ACC), time-of-flight scintillation counters (TOF), and an
array of CsI(Tl) crystals, all located inside a superconducting solenoid coil that provides a 1.5 T
magnetic field. An iron flux-return located outside of the coil is instrumented to detect mesons and to identify muons.
The detector is described in detail elsewhere Belle .
Two different inner detector configurations were used. For the first sample
of 152 million pairs, a 2.0 cm radius beampipe
and a 3-layer silicon vertex detector (SVD1) were used;
for the latter 297 million pairs,
a 1.5 cm radius beampipe, a 4-layer silicon detector (SVD2) svd2
and a small-cell inner drift chamber were used.
Primary charged tracks associated with candidate decays are required to satisfy the following criteria:
the track impact parameters relative to the run-by-run interaction point (IP) are required to be within
2 cm along the axis (oriented antiparallel to the positron beam)
and within 0.05 cm in the transverse () plane.
Proton candidates are selected based on the likelihood functions ,
and for protons, kaons,
and pions, respectively, which are determined from particle identification information
from the CDC ( specific ionization), the ACC (Cherenkov radiation pulse height),
and the TOF (time relative to the beam bunch crossing). Charged tracks with
are identified as protons and
as pions. For proton candidates that originate
directly from
decays, an additional requirement, , is applied to improve
the purity. The proton identification efficiency with the tighter requirements
is 77% for 2 GeV/ protons.
candidates are reconstructed from oppositely charged pion-proton
pairs,
satisfying the following criteria: the
separation distance between the pion and proton at the decay
vertex must be less than 12.9 cm along the axis; the distance of the
closest approach in the plane to the IP is greater than
0.008 cm for each track; the flight length of the
candidates must be greater than 0.22 cm in the plane; the
angular difference between the momentum vector and
the vector between the IP and the decay vertex must be less than
0.09 rad. Finally,
the reconstructed invariant mass of candidate is required to be
within the mass interval (1.116 0.005) GeV/, corresponding to
in the mass resolution.
candidates are reconstructed by pairing two baryons and are identified
with two kinematic variables:
the beam-energy constrained mass,
,
and the energy difference, , where
is the run-dependent beam energy in the center-of-mass (c.m.) frame and
and are reconstructed momentum and energy of the
reconstructed candidates in the c.m. frame, respectively.
The signal region is defined as
5.27 GeV/ 5.29 GeV/ and 0.05 GeV, while the sideband region is
defined as 5.2 GeV/ 5.26 GeV/ and 0.2 GeV.
All possible backgrounds are investigated using a GEANT3 geant
based Monte Carlo (MC) simulation. Backgrounds from the charmful and
charmless
decays are found to be negligible. The dominant background is from
continuum events, which are
studied using the sideband data.
Continuum background is suppressed by requiring
, where is the angle in the c.m. frame between the direction of one daughter and the thrust
axis thrust , formed by the particles not associated
with the candidate. The distribution is nearly flat
for signal but
strongly peaks at for the continuum.
The background rejection is further improved using
event topology, candidate vertex and flavor tagging information.
First, we combine a set of modified Fox-Wolfram moments pi0pi0 into a
Fisher discriminant fisher to distinguish spherically distributed
events from the jet-like continuum backgrounds. Figure
1(a) shows the Fisher discriminant for signal MC
and sideband events. We then use the cosine of the angle between
the candidate flight direction
and the axis (Fig. 1(b)). For the mode only,
we use the distance
along the axis between the vertex and the vertex
formed from the
remaining charged tracks (Fig. 1(c)).
The probability density function is modeled by a double
Gaussian independently
for the SVD1 and SVD2 data due to the better vertex resolution provided by the
SVD2. The PDFs for and are described by a 2nd
order polynomial and a double asymmetric Gaussian, respectively.
The quantities , and (for the
mode only) are combined to form likelihoods and for
signal and continuum background, respectively.
The normalized ratio ,
shown in Fig. 1(d), peaks at unity for signal and at zero for continuum.
Figure 1: Distributions of (a) the Fisher discriminant, (b) ,
(c) z, and (d) likelihood ratio for candidates .
The solid histogram is for signal
MC, while the dashed histogram is for sideband events.
The distribution of is somewhat correlated with the event’s
flavor information. The standard Belle flavor tagging algorithm tagging
provides a tagging quality factor that
ranges from zero for no flavor tagging information to unity for unambiguous flavor assignment.
We apply a requirement on the likelihood ratio depending on the
value of (and on the inner detector configuration for the
mode).
The likelihood ratio requirements listed in Table 1
are determined by optimizing the figure-of-merit,
, where and are the expected signal and
background yields. The signal yields are estimated from the product of the
number of
events, the signal efficiency from MC and the assumed
branching fraction of . The expected background yields are obtained
by scaling the amount of data in the region,
and
,
to the signal region.
The distribution of the continuum is assumed
to be independent of . Therefore, we model
the distribution with an ARGUS
function argus using the data in 0.1 GeV 0.2 GeV.
The scaling factor is estimated
to be the ratio of the area of the signal region to the sideband
region based on the ARGUS function.
Table 1: Minimum values of the likelihood ratio for three ranges
of the flavor tagging quality
(and for the inner detector configuration for the mode).
SVD1
SVD2
SVD1
SVD2
SVD1
SVD2
B
0.85
0.85
0.8
0.65
0.65
0.65
B
0.85
0.6
0.35
B
0.8
0.75
0.65
The signal efficiency for each mode is obtained
using the MC simulation after
applying all analysis requirements except the proton identification. The
signal efficiency is corrected for the proton identification; the proton
identification efficiency is estimated
using decays in data.
The systematic error in the signal efficiency arises from
proton identification,
tracking efficiency, selection and the likelihood ratio requirement
in each flavor-tagged region. The statistical error in the proton efficiency
obtained in the sample is included in the systematic error for
proton identification.
The tracking systematic error is studied using
an inclusive sample, where and
. Candidate mesons are kinematically identified
using the momentum of the slow pion from the decay,
and mass constraints, and the trajectory of one
of the pions in the decay. The tracking efficiency is measured by
searching for the other daughter; by comparing the efficiency in data
with the Monte Carlo expectation, the tracking systematic error is
found to be 1% per track for GeV/ but slightly larger for low
momentum particles. The systematic error associated with requiring a
detached vertex for the candidate is studied by comparing the
ratio of and yields
with the MC expectation. The resulting detection systematic
error is , which is used as the systematic error.
The likelihood ratio requirement is studied using
control samples with the same number of charged particles in the
final state: for ,
for and
for .
The total systematic uncertainty is computed by adding the
correlated errors linearly, and then adding the uncorrelated ones in quadrature.
The systematic errors are summarized in Table 2.
Table 2: Summary of systematic errors, given in %.
Tracking
2.00
4.29
3.16
PID
0.40
0.12
0.26
Requirement
3.70
1.22
0.75
Selection
4.50 2
4.50
# of
1.27
1.27
1.27
Total ()
4.42
10.24
5.76
The expected background contribution is obtained using the sideband region
described above.
A loose requirement is applied to ensure large statistics
to determine the ARGUS parameters.
The systematic uncertainty in the backround prediction comes from the
fit errors of the ARGUS parameters and the statistical errors of the events
in the sideband region.
The estimated background yields in the signal region are listed in
Table 3 and are close to the number of observed events.
Since no statistically significant signals are found, we follow the
Feldman-Cousins approach F.C. to estimate 90% confidence level
(C.L.) upper limits on the signal yields, using the implementation of J. Conrad
et al.pole to include the systematic errors.
The final results are listed in Table 3.
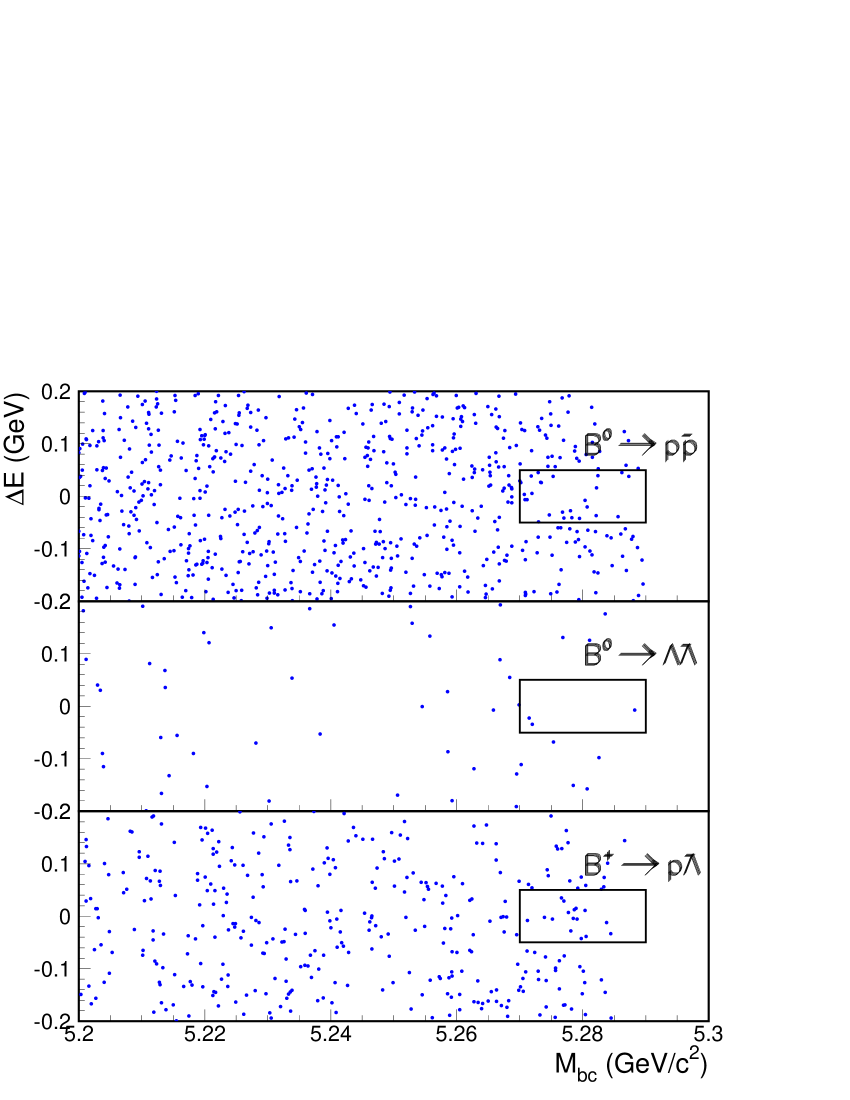
Figure 2: Scatter plots of vs. for
(upper), (middle), and (lower). The
signal region is indicated by the rectangle in each plot.
Table 3: Summary of the and
searches, where is the reconstruction efficiency including the sub-decay branching fraction,
is the observed number of events in the signal region,
is the expected background in the signal region,
is the yield limit at the 90% confidence level, and BF
is corresponding upper
limit for the branching fraction. The
uncertainty in is the
systematic uncertainty due to the ARGUS parameters and statistical error
of the sideband sample.
Mode
[%]
BF []
17.73
25
26.82.3
8.7
4.24
3
1.20.5
6.1
8.44
16
12.91.7
12.1
In summary, we have performed a search for the decays
, and
in a sample of events, which is three times
larger than the dataset used in the
previous analysis previous-result . We find no evidence for signals
and place 90% C.L. upper limits on the branching fractions of
,
, and for the ,
, and modes, respectively.
These upper limits improve our previous
results previous-result and are more stringent than other experimental
limits current-cleo ; current-babar . Moreover, although our
and
results already reach
the pole model predictions HYCheng , no clear signals are seen.
We thank the KEKB group for the excellent operation of the
accelerator, the KEK cryogenics group for the efficient
operation of the solenoid, and the KEK computer group and
the National Institute of Informatics for valuable computing
and Super-SINET network support. We acknowledge support from
the Ministry of Education, Culture, Sports, Science, and
Technology of Japan and the Japan Society for the Promotion
of Science; the Australian Research Council and the
Australian Department of Education, Science and Training;
the National Science Foundation of China and the Knowledge
Innovation Program of the Chinese Academy of Sciences under
contract No. 10575109 and IHEP-U-503; the Department of
Science and Technology of India;
the BK21 program of the Ministry of Education of Korea,
the CHEP SRC program and Basic Research program
(grant No. R01-2005-000-10089-0) of the Korea Science and
Engineering Foundation, and the Pure Basic Research Group
program of the Korea Research Foundation;
the Polish State Committee for Scientific Research;
the Ministry of Education and Science of the Russian
Federation and the Russian Federal Agency for Atomic Energy;
the Slovenian Research Agency; the Swiss
National Science Foundation; the National Science Council
and the Ministry of Education of Taiwan; and the U.S. Department of Energy.
References
(1) M.-Z. Wang et al. (Belle Collaboration), Phys. Rev. Lett. 90, 201802 (2003); M.-Z. Wang et al. (Belle Collaboration), Phys. Rev. Lett. 92, 131801 (2004); Y.J. Lee et al.
(Belle Collaboration) Phys. Rev. Lett. 95, 061802 (2005).
(2) M.-Z. Wang et al. (Belle Collaboration), Phys. Lett.
B 617, 141 (2005).
(3) J.L. Rosner, Phys. Rev. D 68, 014004 (2003).
(4) M.-C. Chang et al. (Belle Collaboration), Phys. Rev. D 71, 072007 (2005).
(5) B. Aubert et al. (BABAR Collaboration), Phys. Rev. D 69, 091503 (2004).
(6) H.Y. Cheng and K.C. Yang, Phys. Rev. D 66, 014020 (2002).
(7) V.L. Chernyak and I.R. Zhitnitsky, Nucl. Phys. B 345, 137 (1990); this sum-rule calculation predicts that and the branching fractions of charmless two-body
baryonic decays through penguin transition are .
(8) N. Gabyshev et al. (Belle Collaboration), Phys. Rev. Lett. 90, 121802 (2003).
(9) Charge conjugate modes are implicitly included throughout this paper.
(10) S. Kurokawa and E. Kikutani, Nucl. Instr. and Meth. A 499,
1 (2003), and other papers included in this Volume.
(11) A. Abashian et al. (Belle Collaboration), Nucl. Instr. and Meth. A 479, 117 (2002).
(12) Z. Natkaniec et al. (Belle SVD2 Group), Nucl. Instr.
and Meth. A 560, 1 (2006).
(13) R. Brun et al., GEANT 3.21, CERN Report No. DD/EE/84-1 (1987).
(14) E. Farhi, Phys. Rev. Lett. 39, 1587 (1977).
(15) G.C. Fox and S. Wolfram, Phys. Rev. Lett. 41, 1581 (1978).
The modified moments used in this paper are described in, S.H. Lee
et al. (Belle Collaboration), Phys. Rev. Lett. 91,
261801 (2003).
(16)R.A. Fisher, Ann. Eugenics 7, 355 (1937).
(17) H. Kakuno et al. Nucl. Instr. and Meth. A 533, 516 (2004).
(18) H. Albrecht et al. (ARGUS Collaboration), Phys. Lett. B 241, 278 (1990); 254, 288 (1991).
(19) G. J. Feldman and R. D. Cousins, Phys. Rev. D 57, 3873 (1998).
(20) J. Conrad, O. Botner, A. Hallgren and C. Perez de los Heros, Phys. Rev. D 67, 012002 (2003).
(21) A. Bornheim et al. (CLEO Collaboration), Phys. Rev. D 68, 052002 (2003).