Igor V. Gorelov 111talk given on behalf of the CDF
Collaboration at the Second Meeting of the APS Topical Group on Hadronic
Physics, GHP 2006, October 22 - 24, 2006, Nashville, Tennessee. (For the CDF Collaboration)
Department of Physics and Astronomy,
University of New Mexico,
800 Yale Blvd. NE, Albuquerque, NM 87131, USA
gorelov@fnal.gov
Abstract
We present the latest results on the search for bottom baryon states
using of CDF data. The study is
performed with the world’s largest sample of fully reconstructed
decays collected by CDF II detector at
in the hadronic trigger path. We observe 4 new
states consistent with bottom baryons.
FERMILAB-CONF-07-027-E
1 Introduction
High energy particle colliders provide a wealth of
experimental data on bottom mesons. However, only one bottom
baryon, the , has been directly
observed [1, 2, 3, 4].
Heavy baryons containing one heavy quark and a light diquark became
a nice 3-body laboratory to test QCD models. In the limit of heavy
quark mass , heavy baryons’ properties are governed
by the dynamics of the light diquark in a gluon field created by the
heavy quark acting as a static source. The heavy baryon like can
be considered as a “helium atom” of QCD. In this Heavy Quark
Symmetry (HQS) approach [5]
at the heavy quark limit a heavy quark spin does not interact with
the gluon field, the spin decouples from the degrees of
freedom of the light quark and the quantum numbers of the heavy quark and the light
diquark are separately conserved by the strong
interaction. Consequently the light diquark momentum
, the heavy quark spin
and total momentum
are considered as good quantum
numbers. Based on the HQS principles an effective
field theory was constructed where
corrections can be systematically included in the perturbative
expansions. The theory was named as Heavy Quark Effective Theory (HQET)
(see [6] and references therein).
For the bottom baryons with a single heavy quark and two light ones
(see Table 1)
the bottom quark spin,
, is combined with the light diquark
momentum comprised of spin
and its angular
momentum . The baryons with a diquark having
and isospin are called - type, while the states
with and isospin are called
- type. The ground state baryon has
.
A doublet of ground - like bottom baryons comprises
with
and with .
The combination of an orbital momentum of a
diquark with its spin of adds to the
spectroscopy a number of excited - wave bottom
-states. The lowest lying orbital excitations are with
[7, 8, 9].
Table 1: Bottom baryon - and - states
and their quantum numbers. The denotes
a pair antisymmetric in flavor and spin.
The denotes a pair symmetric
in flavor and spin.
\bhlineState
Quarks
\bhline
Theoretical expectations for ground bottom baryon states are
summarized in Table 2. The calculations have been
done with non-relativistic and relativistic potential quark models,
expansion, quark models in the HQET approximation, sum
rules, and finally with lattice QCD models [10].
In a physics reality is finite and a
degeneration of a doublet is resolved by a
hyperfine mass splitting between its states. There is also an
isospin mass splitting (see Table 2) between members
of and isotriplets [11, 12, 13, 14].
As it was pointed out [14] the value of the isospin
splitting within triplet does differ from triplet,
namely
.
This number contributes to systematic uncertainty of our experimental
results (see Section 5).
Table 2: Mass and width predictions for .
\bhline property
\bhline
, fixed
from CDF II
see below
\bhline
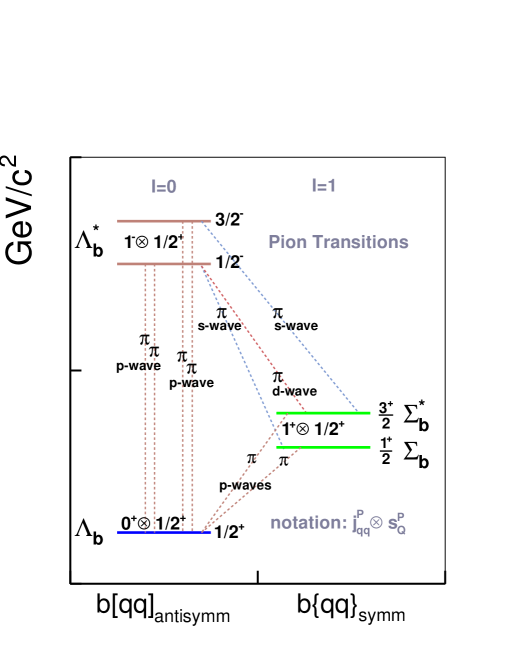
According to HQS the physics of pion transitions between heavy
baryons is governed by the light diquark. The one or two pions are
emitted from the light diquark while the heavy quark propagates
unaffected by the pion emission process. Various pion transitions of
bottom baryons into the lower ground states are summarized at the
Figure 1. The mass predictions for the - wave
(i.e. ground state) - like baryons show that there is enough
phase space for the both and to decay into via
single-pion emission. The two excited (-wave) states might
decay into via two-pion transitions provided a sufficient phase
space.
Figure 1:
Transitions of ground states , into a low lying ground
state via a single-pion emission in a -wave as the diquark
with is converted to one with
. If states have masses sufficiently higher
than the decay thresholds, the two-pion transitions into or a
single-pion decays into or states are possible (see
also a discussion [7, 8, 9]).
single-pion transitions to are forbidden due to isospin
conservation and also by parity (for the higher
state).
It is important for our experimental expectations
to understand the natural width of baryons. As we expect
that masses lie within above and well above a threshold for a single-pion mode, we would expect that
the single-pion -wave transition will dominate the total
width [15, 16]. The authors [16]
find
where is the three-momentum of
soft , ,
and is the axial vector coupling of the constituent
quark for the nucleon. A fit of this formula to the known PDG
width measurements [17] of charm states and yields
which is in excellent agreement with
numerical theoretical value for the nucleon. Using the fit
results we have estimated , see
the
Table 2.
The error of the fitted
contributes as a systematic uncertainty to our
experimental measurements (see Section 5).
2 Principle of the Analysis
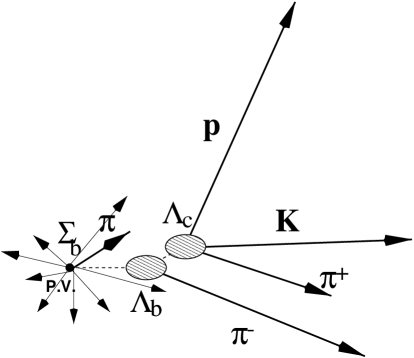
The topology of the event with state produced in Tevatron collisions
is demonstrated in Figure 2. The candidates are
searched in the decay chain222Unless otherwise stated all
references to the specific charge combination imply the charge conjugate
combination as well.:
•
Strong decay with both
and its daughter in weak decay modes.
To remove a contribution due to a mass resolution of each candidate and to avoid absolute mass scale systematic uncertainties,
the candidates are reconstructed in the mass difference
Q-value spectra defined as
The narrow
signatures are searched for in the -spectrum constructed
separately for every charge state of candidates. The
subsample of contains and combinations from the decays of the particles
and the antiparticles ,
respectively. The subsample of contains and
combinations from the decays of the
particles and the antiparticles ,
respectively.
Figure 2:
Sketch of the event topology of a produced in the CDF
detector [18]. The bottom baryon is produced at the collision
origin, i.e. primary vertex of the event. The decays strongly
into with soft emitted. Due to a fast
nature of the strong decay the soft pion originates from the primary
vertex. The and its daughter decay weakly with a secondary
decay vertex measured in SVX II[19]. The tracks with a
common secondary vertex are displaced relative to a primary vertex
and the proton from decay and from decay most likely
contribute to the CDF hadron Two Track Trigger (see
Section 3 and [20]).
The signal region at - value spectrum is defined as
, based on the theoretical expectation
(see Table 2).
We pursued a blind analysis and
developed the selection criteria using only the pure
background sample in the upper and lower sideband regions of
and .
The signal was modeled by a PYTHIA [21] Monte Carlo.
3 Triggers and Datasets
Our results are based on data collected with the CDF II
detector [18] and corresponding to an integrated
luminosity of . As collisions at 1.96 TeV
have an enormous inelastic total cross-section of , while - hadron events comprise only , triggers selecting - hadron
events are of vital importance. Our analysis is based on a data
sample collected by a three-level Two displaced Track Trigger. It
reconstructs a pair of high tracks at Level 1
with the CDF central tracker and enables secondary vertex selection
at Level 2. This requires each of the tracks to have an impact
parameter measured by the CDF silicon detector
SVX II [19, 20] to be larger than 120. The
excellent impact parameter resolution of SVX II makes this
challenging task possible. The trigger proceeds with a full event
reconstruction at Level 3. The Two displaced Track Trigger is
efficient for heavy quark hadron decay modes (see
Figure 2 and its caption).
4 Event Selection
The candidates of the basic state in our analysis, , have been
reconstructed in the mode with . The Two displaced Track Trigger requirements (see
Section 3) are confirmed offline for each candidate. The Charm and bottom candidates have both been
subjected to 3-dimensional vertex fits. The collection of the fitted
candidates has been confined to a mass range of
[17]. To suppress a prompt
background we apply a cut on the proper decay time with its significance . The proper
decay time of with respect to the vertex is required to be . We define the topological
quantities as and where are the vectors of corresponding
distance or momentum in a transverse plane. To reduce combinatorial
background and contribution from partially reconstructed modes the
impact parameter is also restricted to be below of
80, where . The
kinematic cuts for and candidates,
and are applied as well.
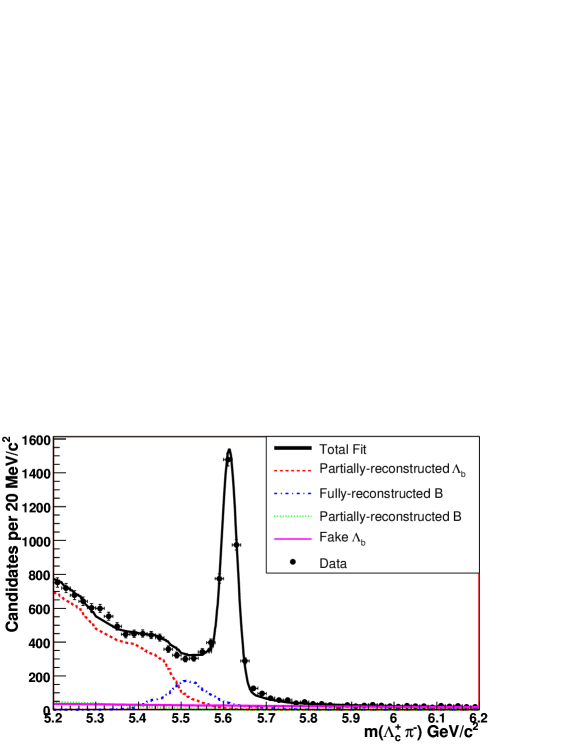
The powerful signal is shown in
Figure 3 with a binned maximum likelihood fit
superimposed. The background from physical states contributing to
the left side of the signal is analyzed with Monte Carlo
simulations. The fit to the invariant mass distribution
yields of candidates. We
posses the world’s largest sample.
CDF II Preliminary, L=1.1
Figure 3:
Fit to the invariant mass of candidates.
Fully reconstructed decays such as and
are not indicated on the figure.
The signal region, ,
consists primarily of baryons, with some contamination
from mesons and combinatorial events. The left side band is
enriched by partially reconstructed decays like
and by fully reconstructed 4-prong - meson decays like
. The right side band consists
from a combinatorial background.
5 Candidates and Signals
Following a method outlined in a Section 2 the candidates (see a Section 4) from a signal region
of have been coupled with the pion tracks to create candidates and the pairs have been subjected to a common vertex fit.
The analysis cuts are optimized according to a blind analysis
technique using the upper and lower sideband regions (see a Section 4)
of experimental - value spectrum while the signal is modeled
by a PYTHIA [21]. The following kinematic and topological
variables are used : , the soft pion track impact parameter significance , and the polar angle of the soft pion in a
- rest frame,
.
A figure of merit is defined as ,
where is the signal efficiency measured
in the Monte Carlo sample and is the background
in the signal region estimated from the upper and lower sidebands.
The maximum of the figure of merit is reached for , , and .
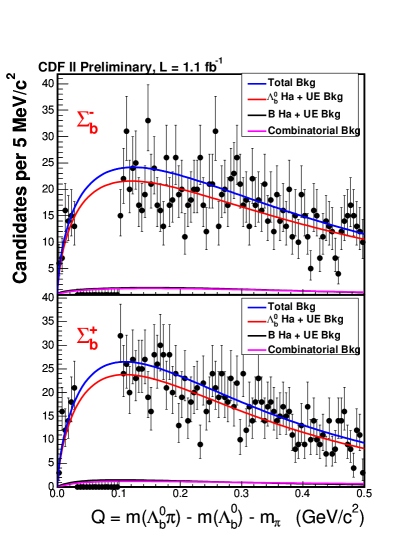
a) b)
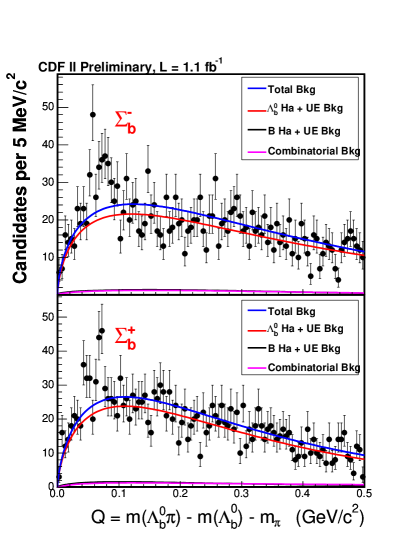
Figure 4: a) The three background sources described in the text
and their sum are shown superimposed on the distributions,
with the signal region blinded. The top plot shows the distribution, which contains all
. The bottom plot shows the distribution, with all . The sideband regions are
parameterized with a power law multiplied by an exponential.
The percentage of each background component in the signal
region is computed from the mass fit (see
Figure 3), and is: ,
and ; b) The excess in the
(top plot) subsample is
candidates over expected background candidates, whereas
in the (bottom plot) subsample the
excess is over expected background candidates.
The - value spectra with blinded signal region are shown in
Figure 4a with its detailed caption. In
the search, the dominant background is from the combination
of prompt baryons with extra tracks produced in the
hadronization process. The remaining backgrounds are from the
combination of hadronization tracks with mesons reconstructed as
baryons, and from combinatorial background events.
Upon unblinding the signal region in both spectra we observe an
excess of events over the background as shown in
Figure 4b with the details explained in the caption.
Next we perform a simultaneous unbinned maximum likelihood fit to
the and
subsamples for a signal from each expected state plus the
background, referred to as the “four signal hypothesis.” Each
signal consists of a Breit-Wigner distribution convoluted with two
Gaussian distributions describing the detector resolution, with a
dominant narrow core and a small broad component for the tails. The
natural width of each Breit-Wigner distribution is computed from the
central - value (see a Section 1 and
[16]).
The fit shown in Figure 5 results in the yields
,
,
, and
candidates, with the signals located at
,
, and
, where
.
Figure 5. Simultaneous fit to the (top) and (bottom) spectra for candidates shown on a range of [0, 200] .Table 3. Likelihood ratios calculated for thealternative signal hypothesis with respect tothe one of four states. The strength ofthe signal hypothesis is further given by thelikelihood ratio, , where is thelikelihood of the four signal hypothesis and is the likelihood of an alternatehypothesis.\bhlineHypothesis\bhlineNullTwo StatesNo SignalNo SignalNo SignalNo Signal\bhlineThe alternative hypothesis is estimated usingall systematic variations of the backgroundand signal functions. The variation with thelargest value of corresponding to the leastfavorable hypothesis is taken.
Systematic uncertainties on the mass difference and yield
measurements fall into three categories: mass scale, background model, and signal parameterization. The mass
scale is determined from the difference in the mean of the narrow
resonances , ,
between data and
PDG[17]. The uncertainties on the background come from the
assumption on the sample composition of the signal region, the
normalization and functional form of the hadronization
background. The systematic effects related to assumptions made on
the signal parameterization are:
underestimation of the detector resolution in Monte Carlo,
the accuracy of the natural width prediction from [16],
and the fit constraint that
[14].
All systematic uncertainties on the mass difference
measurements are small compared to the statistical uncertainties.
The final results [22] for the signal yields, including systematic errors, are
,
,
, and
.
The final results [22] for the masses are
,
,
and
.
Using the CDF II measurement of
[23],
the masses of the four states are [22]:
,
,
,
,
where the systematic uncertainties are now dominated by the total mass uncertainty.
The significance of the signal is evaluated with two methods: using statistical
Monte-Carlo pseudo-experiments and comparing the likelihoods of the default
four signal hypothesis with pessimistic alternate ones.
The randomly generated background samples are fit with the four signal hypothesis.
The probability for background to produce the observed experimental
number of signal events or more is found to be less than ,
corresponding to a significance of greater than . The results on
study of likelihood ratios are summarized in a Table 3
and its detailed caption.
6 Conclusions
In summary, using a sample of candidates
reconstructed in of CDF II data, we search for
resonant states. We observe a significant
signal of four states whose masses and widths are consistent with those
expected for the lowest-lying
charged baryons: , , and .
This result represents the first observation of the baryons.
\ackThe author is grateful to his colleagues from the CDF -Physics
Working Group for useful suggestions and comments made during
preparation of this talk. The author thanks J. Rosner for useful
discussions. The author thanks S. C. Seidel for support of this
work and J. E. Metcalfe for reading the manuscript.
References
References
[1]
Abreu P et al. [DELPHI Collaboration] 1996 Phys. Lett. B 374 351
[2]
Buskulic D et al. [ALEPH Collaboration] 1996 Phys. Lett. B 380 442
[3]
Abe F et al. [CDF Collaboration] 1997 Phys. Rev. D 55 1142
[4]
Acosta D et al. [CDF Collaboration] 2006 Phys. Rev. Lett. 96 202001
[5] De Rujula A, Georgi H and Glashow S L 1976 Phys. Rev. Lett. 37 785;
Godfrey S and Isgur N 1985 Phys. Rev. D 32 189;
Rosner J L 1986 Comm. Nucl. Part. Phys. 16 109;
Isgur N and Wise M B 1989 Phys. Lett. B 232 113;
Isgur N and Wise M B 1991 Phys. Rev. Lett. 66 1130;
Godfrey S and Kokoski R 1991 Phys. Rev. D 43 1679;
Neubert M 1994 Phys. Rept. 245 259
and references herein
[6] Manohar A V and Wise M B 1994 Phys. Rev. D 49 1310;
Manohar A V and Wise M B 2000 Heavy Quark Physics
(Cambridge: Cambridge University Press)
[7]
Chow C K and Wise M B 1994 Phys. Rev. D 50 2135
[8]
Chow C K 1996 Phys. Rev. D 54 3374
[9]
Isgur N 2000 Phys. Rev. D 62 014025
[10]
Kwong W, Rosner J L and Quigg C 1987 Ann. Rev. Nucl. Part. Sci. 37 325;
Bowler K C et al. 1996 [UKQCD Collaboration] Phys. Rev. D 54 3619;
Jenkins E 1996 Phys. Rev. D 54 4515;
Jenkins E 1997 Phys. Rev. D 55 10;
Karliner M and Lipkin H J Preprint hep-ph/0307243;
Mathur N, Lewis R and Woloshyn R M 2002 Phys. Rev. D 66 014502;
Albertus C, Amaro J E, Hernandez E and Nieves J 2004 Nucl. Phys. A 740 333
Ebert D, Faustov R N and Galkin V O 2005 Phys. Rev. D 72 034026
[11]
Hwang W-Y P and Lichtenberg D B 1987 Phys. Rev. D 35 3526
[12]
Capstick S 1987 Phys. Rev. D 36 2800
[13]
Rosner J L 1998 Phys. Rev. D 57 4310
[14] Rosner J L Preprint hep-ph/0611207,
submitted to Phys. Rev. D
[15] Falk A F and Peskin M E 1994 Phys. Rev. D 49 3320
[16] Körner J G, Krämer M and Pirjol D 1994
Prog. Part. Nucl. Phys. 33 787 and references herein
[17] Yao W-M et al. 2006 J. Phys. G33 1
[18] Acosta D et al. 2005 Phys. Rev. D 71 032001
[19] Sill A et al. 2000, Nucl. Instr. Methods Phys. Res., Sect. A 447 1
[20] Ashmanskas W et al. 2004, Nucl. Instr. Methods Phys. Res., Sect. A 518 532
![[Uncaptioned image]](/html/hep-ex/0701056/assets/x6.png) Figure 5. Simultaneous fit to the
(top) and (bottom) spectra for
candidates shown on a range of
[0, 200] .
Table 3. Likelihood ratios calculated for the
alternative signal hypothesis with respect to
the one of four states. The strength of
the signal hypothesis is further given by the
likelihood ratio, , where is the
likelihood of the four signal hypothesis and
is the likelihood of an alternate
hypothesis.
\bhlineHypothesis
\bhlineNull
Two States
No Signal
No Signal
No Signal
No Signal
\bhline
The alternative hypothesis is estimated using
all systematic variations of the background
and signal functions. The variation with the
largest value of corresponding to the least
favorable hypothesis is taken.
Figure 5. Simultaneous fit to the
(top) and (bottom) spectra for
candidates shown on a range of
[0, 200] .
Table 3. Likelihood ratios calculated for the
alternative signal hypothesis with respect to
the one of four states. The strength of
the signal hypothesis is further given by the
likelihood ratio, , where is the
likelihood of the four signal hypothesis and
is the likelihood of an alternate
hypothesis.
\bhlineHypothesis
\bhlineNull
Two States
No Signal
No Signal
No Signal
No Signal
\bhline
The alternative hypothesis is estimated using
all systematic variations of the background
and signal functions. The variation with the
largest value of corresponding to the least
favorable hypothesis is taken.