Measurement of the Ratio and Extraction of the CP Violation Parameter
Abstract
We present a measurement of the ratio of the decay rates , denoted as . The analysis is based on data taken during a dedicated run in 1999 by the NA48 experiment at the CERN SPS. Using a sample of 47000 and five million decays, we find . From this we derive the branching ratio of the CP violating decay and the CP violation parameter . Excluding the CP conserving direct photon emission component , we obtain the results BR and .
keywords:
Kaon decays, CP violationPACS:
13.20.Eb, 13.25.EsEUROPEAN ORGANIZATION FOR NUCLEAR RESEARCH
CERN-PH-EP/2006-034
30 October 2006
, , , , , , , , , , , ††thanks: Funded by the U.K. Particle Physics and Astronomy Research Council ††thanks: Present address: Ottawa-Carleton Institute for Physics, Carleton University, Ottawa, Ontario K1S 5B6, Canada ††thanks: Present address: High Energy Accelerator Research Organization (KEK), Tsukuba, Japan ††thanks: Present address: Rutherford Appleton Laboratory, Chilton, Didcot, Oxon, OX11 0QX, U.K.
, , , , , , , , , , , , , , , , , , , , ††thanks: Present address: Department of Physics, University of Oxford, Denis Wilkinson Building, Keble Road, Oxford, UK, OX1 3RH ††thanks: Present address: University of British Columbia, Vancouver, BC, Canada, V6T 1Z1 ††thanks: Present address: Istituto di Cosmogeofisica del CNR di Torino, I-10133 Torino, Italy ††thanks: Present address: Scuola Normale Superiore e Sezione dell’INFN di Pisa, I-56100 Pisa, Italy ††thanks: Present address: Northwestern University, Department of Physics and Astronomy, Evanston, IL 60208, USA ††thanks: Present address: Dipartimento di Fisica dell’Università e Sezione dell’INFN di Ferrara, I-44100 Ferrara, Italy
, , , , , , , , , , , ††thanks: Present address: CERN, CH-1211 Geneva 23, Switzerland ††thanks: Present address: Carnegie Mellon University, Pittsburgh, PA 15213, USA , , , ††thanks: Present address: Department of Physics, Queen Mary, University of London, Mile End Road, London, E1 4NS
, , , , , , , ††thanks: Present address: Joint Institute for Nuclear Research, Dubna, 141980, Russian Federation , , , , , , , ††thanks: Dipartimento di Fisica dell’Università di Modena e Reggio Emilia, I-41100 Modena, Italy ††thanks: Istituto di Fisica dell’Università di Urbino, I-61029 Urbino, Italy , , , , , , , , , , , , , , , , , , ††thanks: Funded by the German Federal Minister for Research and Technology (BMBF) under contract 7MZ18P(4)-TP2 ††thanks: Present address: DESY Hamburg, D-22607 Hamburg, Germany ††thanks: Present address: Physikalisches Institut, D-79104 Freiburg, Germany ††thanks: Present address: SLAC, Stanford, CA 94025, USA , , , , , ††thanks: Funded by Institut National de Physique des Particules et de Physique Nucléaire (IN2P3), France , , , , , , , , , , , , , , , , , , , , , , , , , ††thanks: Present address: Laboratoire Leprince-Ringuet, École polytechnique (IN2P3, Palaiseau, 91128 France ††thanks: Deceased
, , ††thanks: Funded by the German Federal Minister for Research and Technology (BMBF) under contract 056SI74 , , , , , , , , , , ††thanks: Supported by the KBN under contract SPUB-M/CERN/P03/DZ210/2000 and using computing resources of the Interdisciplinary Center for Mathematical and Computational Modelling of the University of Warsaw. , , , , , , , , ††thanks: Funded by the Federal Ministry of Science and Transportation under the contract GZ 616.360/2-IV GZ 616.363/2-VIII, and by the Austrian Science Foundation under contract P08929-PHY.
1 Introduction
In the last two years, the present generation of high-statistics kaon experiments (KTeV, KLOE and NA48) have published various measurements of the main decay modes, several of them being in disagreement with the PDG averages given in [1]. In [2], results for the six largest branching fractions were presented, determined by measuring ratios of decay rates, where the charged decay modes were normalized to . The measurement of the ratio disagrees with the PDG by , and the results for and disagree with the PDG by , or more than four standard deviations, respectively.
The analysis of the data collected by NA48 can clarify the situation. In [3], we reported on the measurement of the ratio of to all decays with two charged tracks, leading to a branching ratio which exceeds the PDG value by () %, or 2.5 standard deviations. The analysis presented here is based on that measurement. We used the same data sample and applied similar cuts to select events with two tracks and decays.
2 Description of the Experiment
2.1 Apparatus
The NA48 experiment at the CERN proton synchrotron SPS was originally designed and used for the precision measurement of direct CP violation in kaon decays. The NA48 beam line, detector and event reconstruction have been described in detail elsewhere [4]. Here we give a brief summary of the main components relevant for this measurement. It was performed using data collected in 1999 in a pure beam, which was produced by an extracted 450 GeV/c proton beam striking a beryllium target at an angle of 2.4 mrad. The last of three collimators, located 126 m downstream of the target, defined the beginning of the decay region in a 90 m long vacuum tank.
Following a thin kevlar window, a tank filled with helium near atmospheric pressure contained the magnetic spectrometer to measure the momenta of the charged particles. It consisted of four drift chambers (DCH), each with 8 planes of sense wires oriented along four directions, each one rotated by 45 degrees with respect to the previous one. The spectrometer magnet was a dipole with a field integral of 0.883 Tm, and was placed after the first two chambers. The distance between the first and the last chamber was 21.8 meters. The momentum resolution was given by ( in GeV/c). The spatial resolution achieved per projection was 100 m, and the time resolution for an event was ns.
The hodoscope was placed downstream from the last drift chamber. It consisted of two planes of plastic scintillators segmented in horizontal and vertical strips and arranged in four quadrants. The signals were used for a fast coincidence in the trigger. The time resolution from the hodoscope was ps per track.
The electromagnetic calorimeter (LKr) was a quasi-homogeneous liquid krypton ionization chamber. Thin Cu-Be ribbon electrodes, extending from the front to the back of the detector in a small-angle accordion geometry, formed longitudinal towers of about cm2 cross section to divide the active volume into 13248 readout cells. The calorimeter was 27 radiation lengths long, and fully contained electromagnetic showers with energies up to 100 GeV. The energy resolution was ( in GeV).
In order to distinguish between muons and pions, a MUon Veto (MUV) system was installed as the final component of the NA48 detector. It consisted of three planes of plastic scintillators, each shielded by an 80 cm thick iron wall, allowing only muons to pass and produce a signal in the scintillators. The probability for a pion to penetrate the whole detector was of the order of . The inefficiency of the system was at the level of one permille, and the time resolution was below 1 ns.
2.2 Data Sample and Monte Carlo Simulation
The data sample used for this analysis was collected during a two-day minimum bias run in September 1999, dedicated to study semileptonic decays. The spectrometer magnet polarity was changed once, so that about half of the statistics was taken with positive and negative magnet current, respectively.
Charged decays were triggered by a two-level trigger system: The first level required two charged particles in the scintillator hodoscope. The second level trigger used information from the spectrometer, demanding a vertex defined by two tracks with opposite charge. In addition, events requiring only the condition were recorded as control triggers with a downscaling of 20 to measure the efficiency of the trigger. A total of 80 million 2-track events were recorded, reconstructed and subjected to offline filtering.
To reproduce the detector response, a detailed GEANT[5]-based Monte Carlo (MC) simulation of the NA48 apparatus was employed. The MC includes event generation, radiative corrections, propagation of particles through the detector and response of the different detector elements. To account for radiative effects, we used the PHOTOS program package [6] to simulate inner bremsstrahlung () in the decay mode. For decays, was simulated using the event generator KLOR [7], a program which includes both real photon emission and virtual exchange. A total of 18 million decays and 30 million decays were generated (within ranges of the vertex position and kaon energy enlarged with respect to the acceptance in the analysis). In order to match the data, half of the MC sample was simulated for each magnet polarity. The simulated events had to pass the same selection criteria as the data, described below.
3 Data Analysis
3.1 Analysis Strategy
The basic measurement of this analysis is the ratio = . After defining a sample of good 2-track events, we separated the two decay channels. To obtain a clean signal of the CP violating decay , we had to suppress the main decay modes by several orders of magnitude, unavoidably rejecting also part of the decays. Inefficiencies of the event selection and signal losses, which were not exactly reproduced by the MC simulation, had to be measured precisely and corrected for. With the ratio thus obtained, we determined the branching ratio of the decay
and the CP violation parameter
Note that throughout the analysis, only information from charged tracks was used. As a result, we accepted any number of photons in the events, so that e.g. the radiative decays were also accepted. The consequences for our results are described in detail in Sec. 5.
3.2 Basic 2-track Selection
The sample of good 2-track events was extracted from the recorded events by applying the following selection criteria: the events were required to have exactly two tracks with opposite charge, meeting at a distance of closest approach below 3 cm to define the decay position. This vertex had to be inside a cylinder 3 cm in radius around the beam axis and longitudinally between 8 m and 33 m from the final collimator.
To guarantee good reconstruction efficiency, events with high hit multiplicity in the drift chambers (i.e. more than seven hits in a plane within 100 ns) were rejected. Tracks were accepted within the momentum range 15 GeV/c to 100 GeV/c, and their extrapolations had to be within the geometrical acceptances of the various subdetectors. The track times, given by the spectrometer, were required to coincide, admitting a maximum difference of 6 ns. In order to allow a clear separation of showers, we required the distance between the entry points of the two tracks at the front face of the electromagnetic calorimeter to be larger than 25 cm. These cuts were passed by 20 million events.
3.3 Selection
Additional cuts were applied to extract the sample, where the two semileptonic decays, and , are the dominant background sources.
The decay channel was completely removed by requiring the 2-track invariant mass to be compatible with the kaon mass: . The cut on also rejected most of direct emission decays.
The missing momentum carried away by the undetected neutrino in the semi-leptonic decays is reflected in the transverse component of the reconstructed kaon momentum . The requirement suppressed the semileptonic background significantly.
Further elimination of decays was achieved by requiring the ratio for each track to be less than 0.93, where is the energy deposited in the electromagnetic calorimeter, and is the track momentum measured in the magnetic spectrometer. This cut was applied only to the data.
Remaining background from decays was strongly reduced due to the high muon detection efficiency of the muon veto detector (better than ). Events were rejected if a track with an associated signal in the muon counters was found.
3.4 Selection
Being the only relevant decay channel with an electron in the final state, events can be selected by applying only an criterion. If the ratio for any of the tracks exceeded 0.93, the track was tagged as being due to an electron, thus classifying the event as a decay. Like for the selection, this cut was applied only to the data, but not to the MC. The quantity is shown in Fig. 1 for the tracks of all selected events.
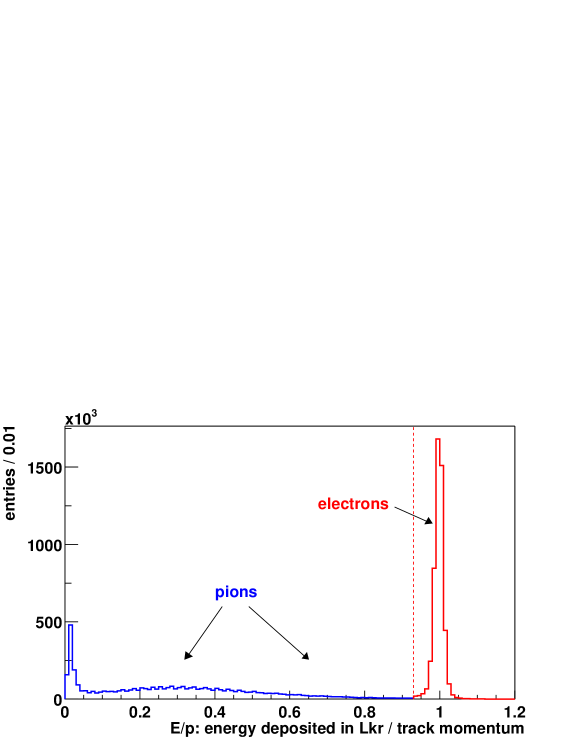
A final criterion was applied to a measure of the kaon momentum. We required the sum of the track momenta to be between 60 GeV/c and 120 GeV/c, the boundaries being chosen to guarantee good description by the MC and to have a negligible contribution from (0.1 permille) due to - interference.
After applying the cuts described above, 47142 and 4999126 candidates were selected from the data sample. Taking these event numbers and correcting for the acceptances evaluated by MC and listed in Table 1, the raw (uncorrected) value for the ratio is .
| Decay mode | Acceptance |
|---|---|
4 Corrections and Systematic Uncertainties
The following sections describe the determination of the corrections and systematic uncertainties, generally measured from the data samples themselves.
4.1 Rejection of Events with Muon Signal
Background from decays in the sample can only be reduced to the desired level if we reject events having a track in coincidence with an associated signal in the muon counters. A few percent of the pions decay () or penetrate the whole detector (punch-through), so we lose events cutting on the MUV information. As decays after the LKr and pion punch-through are not simulated in the MC, the probability for a pion to generate a hit in the MUV (directly or indirectly) is higher in data, and we must correct for the difference .
As one cannot measure for in data, the difference was determined from candidates. We applied all selection cuts, but required both tracks to have an associated signal in the MUV. The remaining events had the same signature as the signal, being most probably decays (with decay of the pion), and representing a clean sample to study the MUV signal probability for a pion. The result for this measurement is shown in Table 2. The numerator in data was corrected for the few events with double pion decay. The obtained was , the uncertainty being completely dominated by the statistical error.
A number of alternative measurements were performed to verify the
quoted above; as the additional amount of MUV signal in data
is mostly independent from the selection criteria, it is expected to
be similar in all control samples.
decays were selected from the sample
of 2-track events, and 30 million decays were simulated to
determine in data and MC. We obtained .
As a direct check, we measured from a data
sample taken in the year 2002 with a pure beam. We selected
decays applying the same cuts as for the
selection. With from the MC, we measured
, which is in very good agreement with
the measured from the sample. As a result, the
correction on due to the MUV cut is
(two pions in the final state) .
4.2 Trigger Efficiency Differences
As described in Sec. 2.2, the downscaled trigger sample was used to determine the efficiency. We measured and , resulting in a correction due to trigger efficiency differences of .
4.3 Cut on the Ratio
The purpose of the criterion is to distinguish between electrons and pions. As the resulting separation is not definite, we had to measure the misidentification probabilities precisely from the data, and correct the numbers of and events accordingly. To account for the momentum spectra of the particles from different decay channels, the determination of the misidentification probabilities as well as the application of the corrections were performed in bins of the track momentum.
The pion misidentification probability (pions with , being classified as electrons) led to a loss of selected decays, while background remained in the sample, predominantly due to . For the pion misidentification measurement, a sample of events was selected having one track with , clearly classifying it as an electron. The probability for pions to have was then determined from the spectrum of the other (i.e. pion) track to be .
The inefficiency of the electron identification (electrons with , being classified as pions) reduced the number of selected events. It was determined in a similar way by requiring one track with , tagging it as a pion. The distribution for the other track is then mainly due to electrons, with a small contribution from pions. Subtracting this pion component, we obtained the probability for losing an electron by the condition : .
The corrections were applied as follows: we increased the event number by the factor (two pions in the final state). The number was increased by , and backgrounds from , and were subtracted. To evaluate the background, we simulated a sample of 30 million MC events, applied the same cuts as for the MC and determined the acceptance of this selection. Normalized to the flux, the fraction of events in the data sample was about four permille. The background from (about two permille) and the small contribution (0.1 permille) were determined in a corresponding way.
To demonstrate the correctness of the selection principle, we varied the cut value between and , taking into account that the background in the signal (see Sec. 4.4) depends on the criterion as well. The first line of Table 3 shows the ratio before all corrections. The results for and differ by six percent, but the following dependent event number corrections bring them to an excellent agreement. We derived the systematic uncertainty from the largest deviation of , and the correction due to the cut is , which includes inefficiencies of the cut and background in .
| criterion | 0.85 | 0.93 | 0.96 |
| Raw [] | 4.655 | 4.833 | 4.946 |
| inefficiencies + background [] | |||
| background [] | |||
| Total correction [] | |||
| Corrected [] | 4.873 | 4.874 | 4.871 |
| Difference to standard ( ) [] | - |
4.4 Background in the Signal
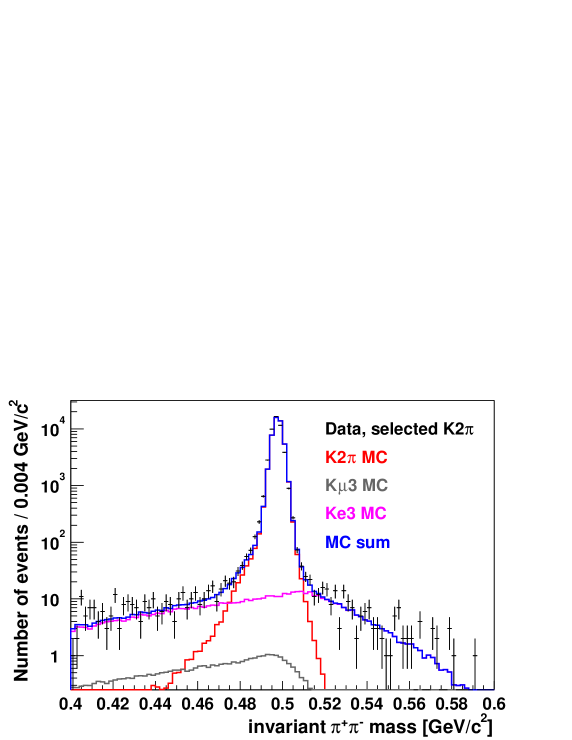
Applying the selection cuts, a suppression of the background from and of the order was achieved. Fig. 2 shows the distribution of the invariant mass after all selection requirements except the cut on itself. The data are well described by the sum of the signal MC and the two background MCs. The small mismatch between the reconsructed and the true kaon mass in this particular data taking period has not been corrected, as it has no effect on the selection and the background estimation.
The total amount of background was determined from sidebands of the distributions (sideband 1: GeV/, sideband 2: GeV/). The combined background from and yields an estimation of events, leading to a correction due to background in of .
As a check, we enlarged the accepted mass window to GeV/, thus roughly doubling the background fraction. Correcting for this, however, we obtained the same result for .
4.5 Kaon Energy Spectrum
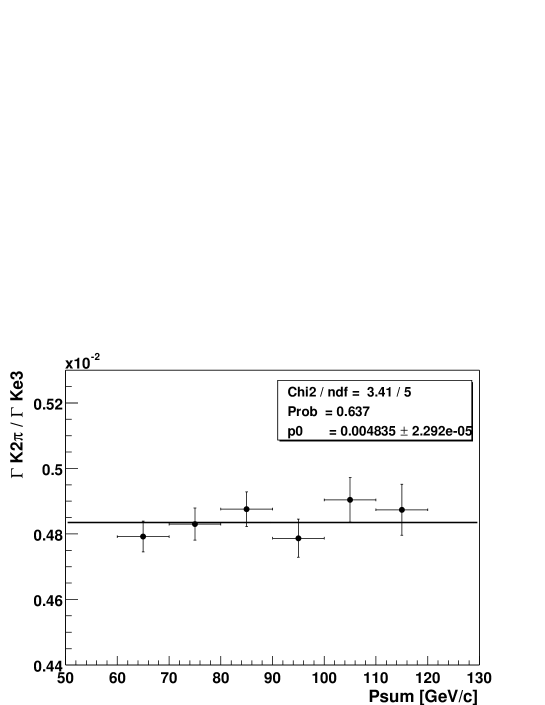
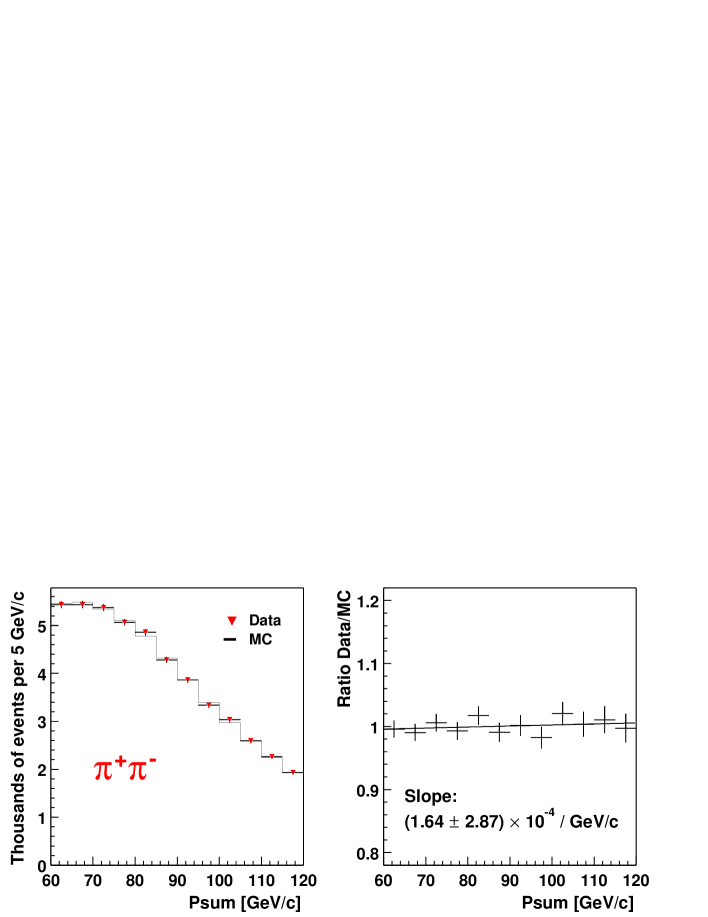
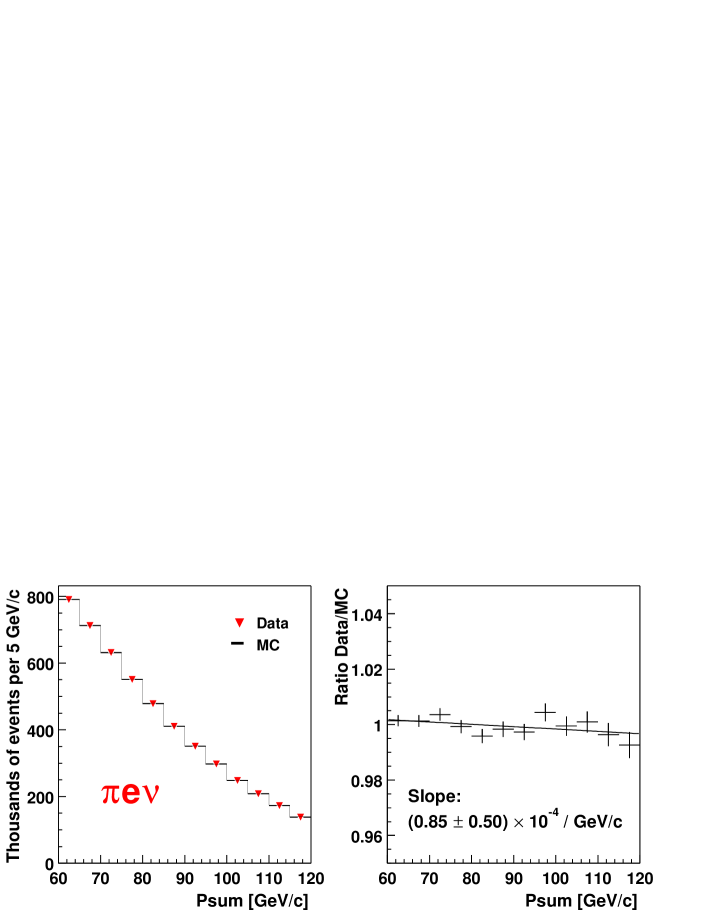
To check for a dependence on the kaon momentum, we determined the ratio in bins of (Fig. 3). Although the points fit well to a straight line without slope, the significance of this conclusion is affected by the relatively small statistics. To disentangle the contribution, we studied the distributions for the two decay modes separately. Fig. 4 shows the spectra for selected and events in data and MC. While there is no visible slope in the ratio data/MC for , the mode shows a small dependence. In order to derive the spectrum error, we split the data sample into halfs of the range, 60-90 GeV/c and 90-120 GeV/c, and compared the ratios data/MC in the two samples for the mode. The difference between the mean ratios was taken as the uncertainty due to the imperfect knowledge of the kaon energy spectrum: .
As a check, we performed a number of variations of the accepted range, e.g concentrating on a central region between 70 and 100 GeV/c, enlarging the boundaries to 55-140 GeV/c, or changing only the lower or upper cut value. All resulting deviations in were well below the estimated systematic uncertainty.
4.6 Radiative Effects

As mentioned in Sec. 2.2, we used the programs PHOTOS (for ) and KLOR (for ) to simulate inner bremsstrahlung. The effect and importance of the simulation is demonstrated in Fig. 5. With KLOR, the momentum spectra of the charged particles are well described.
To estimate the uncertainty from radiative effects, we repeated the analysis using an updated version of the PHOTOS package, now also including virtual diagrams in the bremsstrahlung simulation. The results differed only by 0.1 permille, giving confidence that the uncertainty is fully covered by .
5 Results
5.1 The Ratio
We summarize the corrections and systematic uncertainties on in Table 4.
| Source of uncertainty | Correction | Uncertainty |
|---|---|---|
| cut | 0.05 | |
| Background in K2π | 0.03 | |
| Muon cut | 0.18 | |
| Trigger efficiencies | 0.11 | |
| Energy spectrum | - | 0.20 |
| Radiative corrections | - | 0.10 |
| MC statistics | - | 0.10 |
| Total correction | 0.33 |
Applying the small total correction of to the raw ratio, we obtain
A number of additional systematic checks were performed, varying some of the selection cuts or dividing the data into subsamples to study the result as a function of certain quantities, e.g. the longitudinal vertex position or the magnet polarity. None of the variations showed any significant impact on the result.
As the uncertainty from the energy spectrum gives the largest contribution to the systematic error, we performed an alternative analysis, applying the same cuts but defining the kaon momentum for decays in a different way. Both decay modes were required to have a kaon momentum between 70 and 140 GeV/c. For decays, is directly given as the sum of the track momenta. For decays, however, the neutrino leaves the detector undetected, leading to a quadratic ambiguity in the determination of the kaon momentum. Depending on the orientation of the longitudinal component of the neutrino momentum in the kaon cms, there are two solutions for . Both solutions were required to be in the accepted momentum range. About 41500 and 2.66 million events passed the selection. The determinations of all corrections and systematic uncertainties were repeated and performed as described in the previous sections. After all corrections, we obtained , which is in perfect agreement with our result. The larger systematic error results from the ambiguous definition of the kaon momentum for decays.
5.2 The Branching Ratio BR()
For the determination of and , we must consider that the event selection does not imply any requirement concerning photons, i.e. the radiative decay is also accepted, as long as the invariant mass fulfills the kaon mass requirement. decays can originate from two different processes; inner bremsstrahlung () or direct emission (). While the process is CP violating (the photon is emitted by a pion, coming from ), the direct emission of the photon from the weak vertex is mostly CP conserving. As a result, we must subtract the contribution for the determination of .
The fraction in has been precisely measured by E731 [8] and KTeV [9][10]. To determine the contribution in our signal, we generated three million decays and applied the selection cuts. The acceptance for this decay mode is only because of the hard photon spectrum, and the effective fraction is: . Subtracting the contribution from the signal, we obtain for the branching ratio including :
with , which was taken from the NA48 measurement [3], but updated for the following reason: in this experiment, the external error from the normalization was the main source of experimental uncertainty. However, since then the experimental situation in the knowledge of the branching ratio has improved, and we recalculated with a new normalization, using a weighted mean of the KTeV [2] and the KLOE [11] results: (with enlarged error following PDG rules).
5.3 The CP Violation Parameter
Using our result for , we finally determine the CP violation parameter
taking as further input values the most precise single measurements:
5.4 Comparison of Results
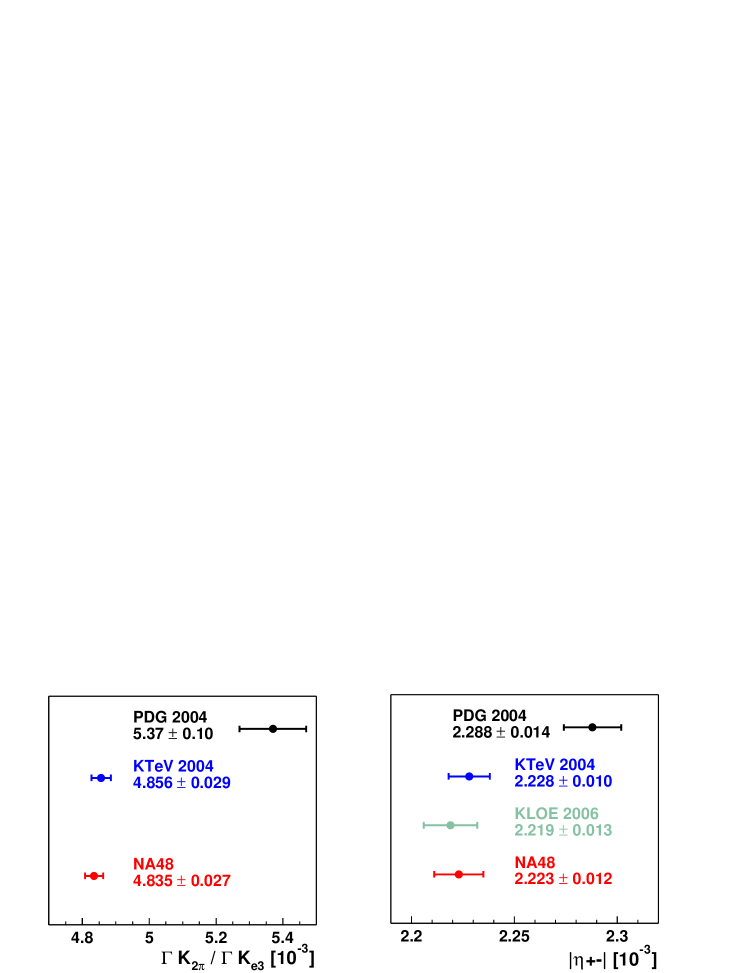
In Fig. 6, we compare our results for (left) and (right) with the measurements by KTeV [2] and the PDG 2004 values [1]. For , the new KLOE result [14] is shown, too. Using the same values for lifetime [11] and [13] to determine , the results from KLOE and NA48 are correlated. The measurements performed by the three experiments jointly contradict the former PDG values.
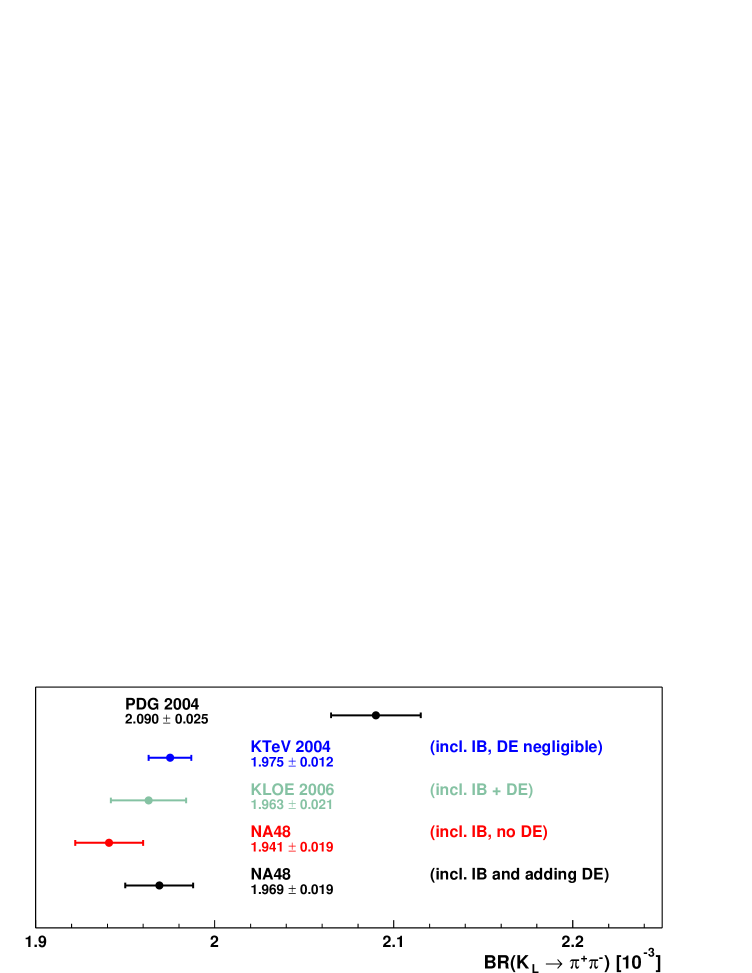
For the corresponding comparison of results in Fig. 7, it is important to point out the treatment of the radiative decays. The contribution of direct emission is claimed to be negligible in the KTeV result. The KLOE measurement, however, is fully inclusive with respect to final-state radiation, including both the inner bremsstrahlung and the (CP conserving) direct emission components. Adding the component, our value is in very good agreement with the KLOE result.
5.5 Conclusions
6 Acknowledgements
We gratefully acknowledge the continuing support of the technical staff of the participating institutes and their computing centers.
References
- [1] S. Eidelman et al. (Particle Data Group), Phys. Lett. B 592, 1 (2004)
- [2] T. Alexopoulos et al., KTeV Collaboration, Phys. Rev. D70:092006 (2004)
- [3] A. Lai et al., NA48 Collaboration, Phys. Lett. B 602, 41 (2004)
- [4] A. Lai et al., NA48 Collaboration, Eur. Physics J. C 22, 231 (2001)
- [5] CERN Program Library Long Writeup, W5013 (1993)
- [6] E. Barberio and Z. Was, Comput. Phys. Com. 79:291-308 (1994)
- [7] T. C. Andre, Nucl. Phys. Proc. Suppl. 142:58-61 (2005)
- [8] E. J. Ramberg et al., E731 Collaboration, Phys. Rev. Lett. 70, 2525 (1993)
- [9] A. Alavi-Harati et al., KTeV Collaboration, Phys. Rev. Lett. 86, 761 (2001)
- [10] E. Abouzaid et al., KTeV Collaboration, Phys. Rev. D74:032004 (2006)
- [11] F. Ambrosino et al., KLOE Collaboration, Phys. Lett. B 632, 43 (2006)
- [12] A. Lai et al., NA48 Collaboration, Phys. Lett. B 537, 28 (2002)
- [13] F. Ambrosino et al., KLOE Collaboration, hep-ex/0601025 (2006)
- [14] F. Ambrosino et al., KLOE Collaboration, Phys. Lett. B 638, 140 (2006)