Measurements of integral muon intensity
at large zenith angles
Abstract
High-statistics data on near-horizontal muons collected with
Russian-Italian coordinate detector DECOR are analyzed. Precise
measurements of muon angular distributions in zenith angle
interval from 60∘ to 90∘ have been performed. In
total, more than 20 million muons are selected. Dependences of the
absolute integral muon intensity on zenith angle for several
threshold energies ranging from 1.7 GeV to 7.2 GeV are derived.
Results for this region of zenith angles and threshold energies
have been obtained for the first time. The dependence of integral
intensity on zenith angle and threshold energy is well fitted by a
simple analytical formula.
1 Introduction
Studies of angular and energy dependence of muon flux at the Earth’s surface give important information as about processes of muon generation and propagation in the atmosphere so about primary cosmic rays. Measurements of muon flux at large zenith angles up to 90∘ are especially actual since primary particles for such muons have higher energies than in the vertical direction. Experimental studies of muon intensity at large zenith angles at the ground level can be conditionally separated in two groups: measurements of muon integral intensity with threshold energies less than 1 GeV [1]–[8] and investigations of integral and differential muon spectra for muon energies higher than 10 GeV (see review [9]). Regions of measurements of muon spectrum at large zenith angles are presented in Fig. 1. It is remarkable that for threshold energies from 1 GeV to 10 GeV and zenith angles 60 muon intensity data are absent.

To explore this region, a setup capable to measure near-horizontal muon flux at different threshold energies with a good angular accuracy of track reconstruction is needed. Coordinate detector DECOR, which is a part of experimental complex NEVOD situated in MEPhI (Moscow), is such a detector. Regions of threshold energies and zenith angles accessible for DECOR and analyzed in this work are shown by the dashed areas in Fig. 1.
2 Experimental setup and events selection
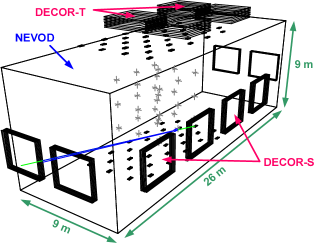
Experimental complex NEVOD includes a water Cherenkov calorimeter NEVOD [10] with sensitive volume 2000 m3 equipped with quasispherical modules of PMTs, and large-area ( 110 m2) coordinate detector DECOR [11] (Fig. 2). Eight supermodules (SM) of DECOR are situated in the gallery around the water tank, and four SM on its cover. SM of side part of DECOR represents eight parallel planes with sensitive area m m, suspended vertically with 6 cm distance from each other. These planes consist of 16 chambers which contain 16 tubes with inner cross-section cm cm. Chambers are operated in a limited streamer mode and are equipped with two-coordinate external strip read-out system. Thus, coordinates of passing particle can be obtained for each plane with spatial accuracy of muon track location 1 cm. First level trigger is formed when there are at least two even and two odd triggered planes in a given SM.
For the analysis, particles passing through two SM situated at different sides of the water pool were selected. Different pairs of SM correspond to different values of threshold energy. Accuracy of zenith angle reconstruction for tracks passing through selected SM pairs is . Selection procedure includes the following conditions.
-
•
”OneTrack” criterion: two tracks reconstructed from data of different supermodules must coincide within 5∘ cone. In this case the tracks in separate SMs are considered as tracks of the same particle. Straight line connecting the middles of two reconstructed track segments is taken as the trajectory of the particle.
-
•
The events in which muon passed closer than 3 cm from the boundary of SM are rejected in order to decrease the edge effects.
-
•
There must be two and only two track projections (X,Y) in each SM for unambiguous reconstruction of geometrical characteristics of muon track (the absence of accompanying particles).
Data collected over a period from December 2002 to June 2003 are analyzed. Total time of registration is equal to 3390 hours. The total number of selected events is more than 20 millions.
| , (cmssr)-1 | |||||
|---|---|---|---|---|---|
| 1.7 GeV | 3.3 GeV | 4.2 GeV | 5.4 GeV | 7.2 GeV | |
| 61 | |||||
| 63 | |||||
| 65 | |||||
| 67 | |||||
| 69 | |||||
| 71 | |||||
| 73 | |||||
| 75 | |||||
| 77 | |||||
| 78 | |||||
| 79 | |||||
| 80 | |||||
| 81 | |||||
| 82 | |||||
| 83 | |||||
| 84 | |||||
| 85 | |||||
| 86 | |||||
| 87 | |||||
| 88 | |||||
| 89 | |||||
3 Results
Threshold energy of muons passing through selected pair of SM is calculated by means of range-energy tables [12]. It is calculated for each selected event, and then the event is placed in data array . The bin of zenith angle , the bin of azimuth angle , the bin of threshold energy MeV. Integral muon intensity is calculated in the following way:
| (1) |
where is the number of registered muons in a given angular and threshold energy bin. is ”live time” of registration. The parameter is efficiency of single SM triggering, and takes into account event rejection because of accompanying particles. Results of simulations and additional experimental data analysis give the following values: , varies from 0.83 to 0.91 for different and (uncertainty of is less then 0.35%). The function is the setup acceptance calculated by means of MC method taking into account the structure of SM and selection requirements.
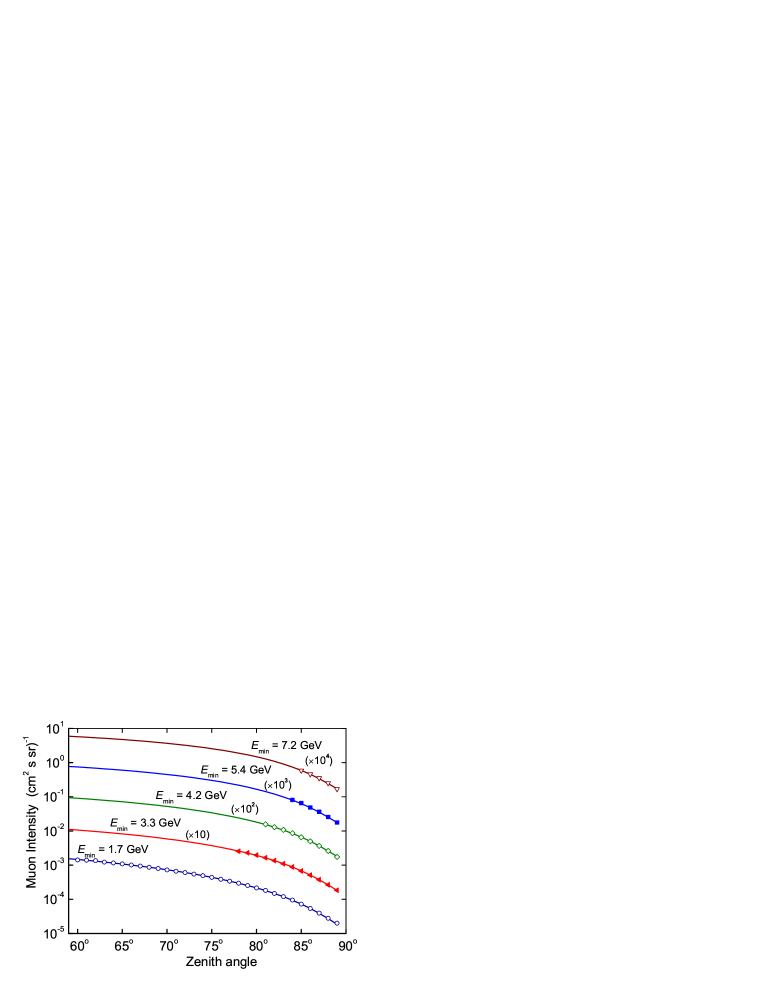
Absolute muon intensity averaged in azimuth angle for zenith angles 61 and for five threshold energies is represented in Table I and is shown in Fig. 3 (points). Errors in the table include statistical and systematical uncertainties (uncertainty of threshold energy estimation, uncertainty of , muon energy loss in the walls of surrounding buildings).
4 Approximation formula
For approximation of measured experimental data, the following simple formula is used:
| (2) |
The factor in front of the exponent reflects the form of muon spectrum in the upper atmosphere, and the exponential function takes into account muon decay. Here is the normalization; is the threshold muon energy (GeV) at production level. In this formula GeVcm2/g is effective specific energy loss; is the path of muon in the atmosphere; g/cm2 is the total thickness of atmosphere (altitude of setup under see level is taken into account); g/cm2 is the effective depth of muon generation. is the effective critical energy for muon; is the effective length at which the density of atmosphere is changed by a factor of [13]; is the velocity of light; is muon life time and is it’s mass (GeV); is the approximation of effect of atmosphere sphericity. As a result of fitting, the following values of free parameters were obtained: , , km, and .
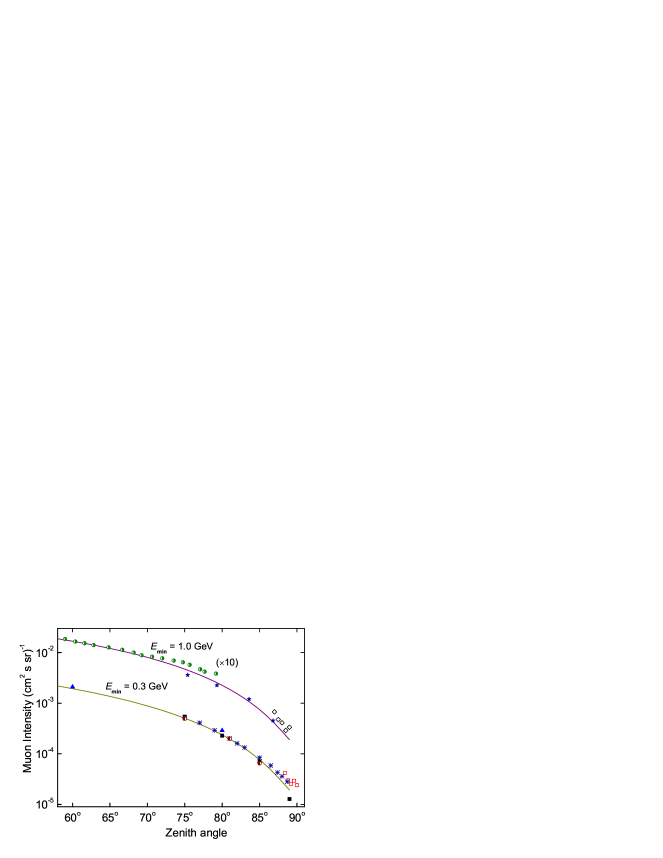
In Fig. 3, integral muon intensity calculated by formula (2) for five threshold energies (the curves) is compared with the present experimental data. Dependence of integral muon intensity on zenith angle calculated for lower thresholds (1 and 0.3 GeV) and experimental data of earlier measurements [1]–[8] are presented in Fig. 4. Comparison of calculated values with data [1,4,5,7,8] shows a reasonable agreement. In works [2] and [6], the intensity is somewhat higher than measured in [1] or calculated by (2). The integral intensity data at GeV obtained in [3] decrease with the increase of zenith angle more slowly than it follows from [1] and calculation by (2), but at angles less than 72∘ the agreement is quite well.
5 Conclusions
Experimental data of coordinate detector DECOR cover unexplored earlier region for integral muon intensity at threshold energies GeV and zenith angles 61. It is important to mark that the measurements for all thresholds were performed simultaneously with a single setup, that minimizes systematic uncertainties. Extrapolation of the present data to lower thresholds is in a reasonable agreement with the results of other measurements.
Acknowledgments
The research is performed at the Experimental Complex NEVOD with the support of the Federal Agency of Education and Federal Agency for Science and Innovations (contracts 02.452.11.7064, 02.434.11.7039; program of support of leading scientific schools 10113.2006.2).
References
- [1] B.G. Wilson, Can. J. Phys., vol. 37, p. 19, 1959.
- [2] M. Gettert et al., ”The momentum spectrum of horizontal muons up to 15 TeV/c”, Proc. 23th Intern. Cosmic Ray Conf., Calgary, vol. 4, pp. 394-397, 1993.
- [3] S. Tsuji et al., ”Muons from the Direction of Cygnus X-3: 1992-1994”, Proc. 24th Intern. Cosmic Ray Conf., Rome, vol. 1, pp. 614-617, 1995.
- [4] N.L. Karmakar, A. Paul and N. Chaudhuri, ”Measurements of absolute intensities of cosmic-ray muons in the vertical and greatly inclined directions at geomagnetic latitudes 16 degrees n.”, Nuovo Cimento B, vol. 17, pp. 173-186, 1973.
- [5] J.N. Crookes and B.C. Rastin, ”An investigation of the absolute intensity of muons at sea-level”, Nucl. Phys. B, vol. 39, pp. 493-508, 1972.
- [6] D. Jakeman et al., Can. J. Phys., vol. 34, pp. 432, 1956.
- [7] R.W. Flint, R.B. Hicks, and S. Standil, ”Variation with zenith angle of the integral intensity of muons near sea level”, Can. J. Phys., vol. 50, pp. 843-848, 1972.
- [8] D.P. Bhattacharyya,”Absolute low-latitude sea-level muon intensity at large zenith angle” Phys. Rev. D, vol. 13, pp. 566-570, 1976.
- [9] P.K.F. Grieder, ”Cosmic rays at Earth”, Elsevier, 2001.
- [10] V.M. Aynutdinov et al., ”Neutrino water detector on the Earth’s surface (NEVOD)”, Astrophysics and Space Science, vol. 258, pp. 105-116, 1998.
- [11] M.B. Amelchakov et al., ”High-resolution large area coordinate detector for investigations of high energy cosmic ray phenomena at the ground level”, Proc. 27th Intern. Cosmic Ray Conf., Hamburg, vol. 3, pp. 1267-1270, 2001.
- [12] D.E. Groom, N.V. Mokhov, and S.I. Striganov, ”Muon stopping power and range tables 10 MeV–100 TeV”, Atomic Data and Nuclear Data Tables, vol. 78, pp. 183-356, 2001.
- [13] B. Rossi, ”High Energy Particles”, New York, 1952.