High Jet Physics
Abstract
In this contribution, a comprehensive review of the main aspects of high jet physics in Run II at the Tevatron is presented. Recent measurements on inclusive jet production are discussed using different jet algorithms and covering a wide region of jet transverse momentum and jet rapidity. Several measurements, sensitive to a proper description of soft gluon radiation and the underlying event in hadron collisions, are shown. Finally, high prompt photon measurements and studies on the production of electroweak bosons in association with jets in the final state are discussed.
I INCLUSIVE JET PRODUCTION
The measurement of the inclusive jet cross section in collisions at constitutes a stringent test of perturbative QCD (pQCD) predictions over almost nine orders of magnitude. The increased center-of-mass energy and integrated luminosity in Run II at the Tevatron, compared to Run I, allows to extend the measured jet cross section to jets with transverse momentum, , above , and to search for signals of quark compositeness down to .
The pQCD calculations are written as matrix elements, describing the hard interaction between partons, convoluted with parton density functions (PDFs) in the proton and antiproton that require input from the experiments. Inclusive jet cross section measurements from Run I at the Tevatron d0runI ; runIjet , performed in different jet rapidity regions, have been used to partially constrain the gluon distribution in the proton. The pQCD predictions are affected by the still limited knowledge on the gluon PDF, which translates into a big uncertainty on the theoretical cross sections at high .
The hadronic final states in hadron-hadron collisions are characterized by the presence of soft contributions (the so-called underlying event) from initial-state gluon radiation and multiple parton interactions between remnants, in addition to the jets of hadrons originated by the hard interaction. A proper comparison with pQCD predictions at the parton level requires an adequate modeling of these soft contributions which become important at low .
In Run II, both CDF and D0 experiments explore new jet algorithms following the theoretical work that indicates that the cone-based jet algorithm employed in Run I is not infrared safe and compromises a future meaningful comparison with pQCD calculations at NNLO.
The CDF experiment recently published results ktprl ; runIIjet on inclusive jet production using the ktalgo ; soper and midpoint midpoint algorithms for jets with and rapidity in the region , which are well described by NLO pQCD jetrad predictions 111Previous measurements using the algorithm at the Tevatron d0kt observed a marginal agreement with NLO pQCD at low but this discrepancy is removed after non-perturbative corrections are included.. CDF has presented new measurements cdfwww of the inclusive jet production cross section as a function of in five different jet rapidity regions up to , based on of CDF Run II data.
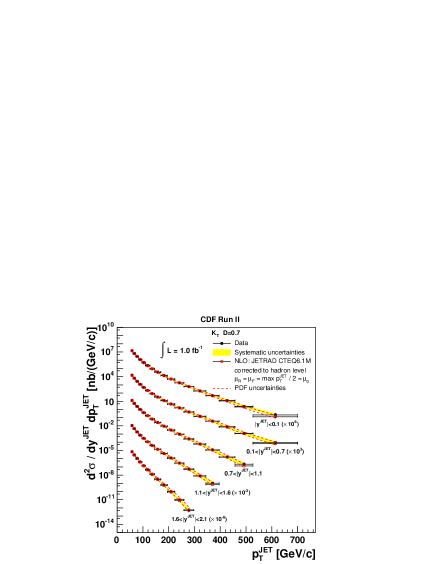
Figure 1 shows the measured cross sections using the algorithm,
| (1) |
with , as a function of in five different regions compared to NLO pQCD predictions where, for presentation, each measurement has been scaled by a given factor. The measured cross sections decrease by more than seven to eight orders of magnitude as increases. Figure 2 shows the ratios data/theory as a function of in the five different regions. Good agreement is observed in the whole range in and between the measured cross sections and the theoretical predictions. In particular, no significant deviation from the pQCD prediction is observed for central jets at high .
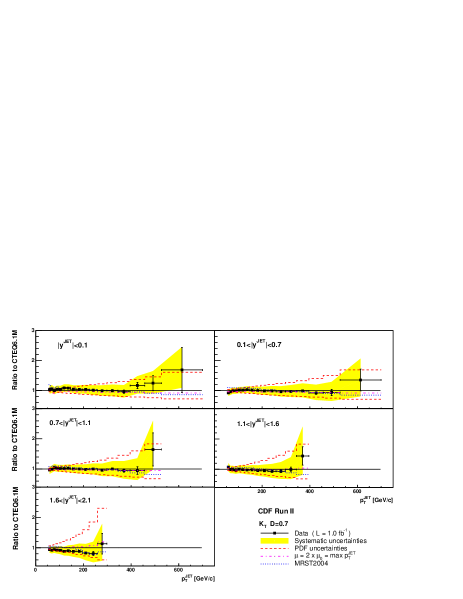
In the most forward region, the uncertainty on the measured cross section at high , compared to that on the theoretical prediction, indicates that the data will contribute to a better understanding of the gluon PDF.
In the region , the analysis is repeated using different values for in the algorithm: and (see Figure 3). In both cases, good agreement is observed between the measured cross sections and the NLO pQCD predictions in the whole range in . As decreases, the measurement is less sensitive to contributions from multiple proton-antiproton interactions, and the presence and proper modeling of the underlying event. These measurements support the validity of the algorithm to search for jets in hadron collisions that will be further explored at the LHC energies.
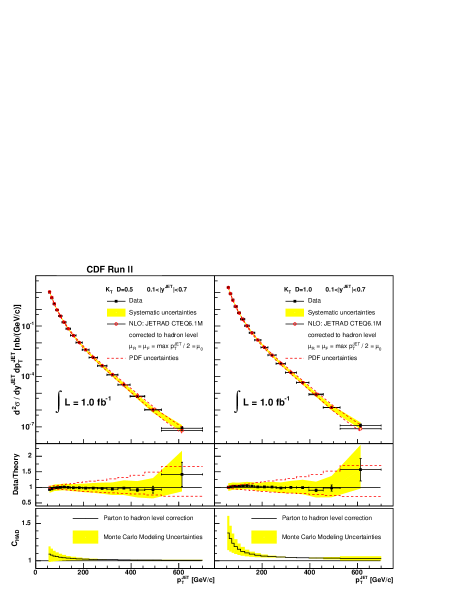
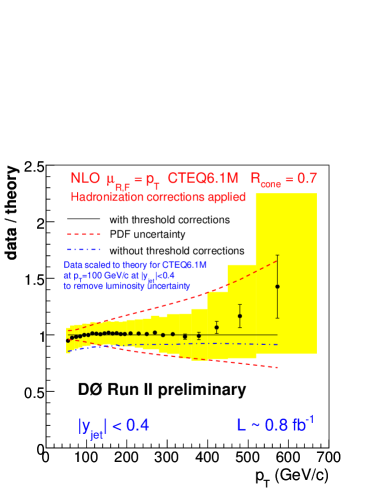
Figure 4 shows the measured inclusive jet cross section by D0 d0www based on the first 800 of Run II data. The new midpoint jet algorithm has been used with a cone size R=0.7. The measurements have been performed for central jets in two different bins.
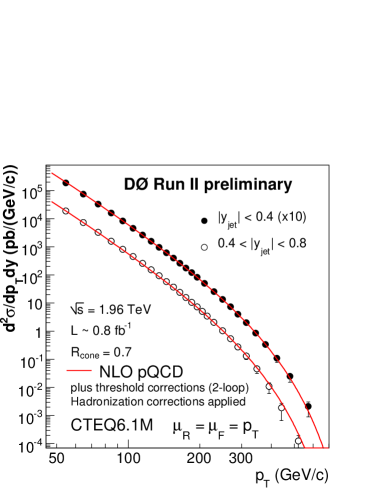
Figure 5 presents the ratio data vs NLO pQCD predictions d0nlo as a function of for jets in the region . In order to eliminate the uncertainty on the integrated luminosity the ratio has been normalized to unity at GeV/c. The data is in good agreement with the pQCD NLO predictions.
II UNDERLYING EVENT STUDIES
As mentioned in the previous section, the hadronic final states at the Tevatron are characterized by the presence of soft underlying emissions, usually denoted as underlying event, in addition to highly energetic jets coming from the hard interaction. The underlying event contains contributions from initial- and final-state soft gluon radiation, secondary semi-hard partonic interactions and interactions between the proton and anti-proton remnants that cannot be described by perturbation theory. These processes must be approximately modeled using Monte Carlo programs tuned to describe the data.
The jet energies measured in the detector contain an underlying event contribution that has to be subtracted in order to compare the measurements to pQCD predictions. Hence, a proper understanding of this underlying event contribution is crucial to reach the desired precision in the measured jet cross sections. In the analysis presented here, the underlying event in dijet events has been studied by looking at regions well separated from the leading jets, where the underlying event contribution is expected to dominate the observed hadronic activity. Jets have been reconstructed using tracks with GeV and and a cone algorithm with R=0.7.
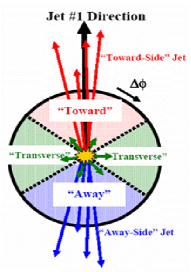
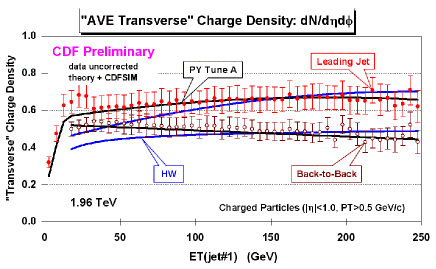
Figure 7 shows the average track density in the transverse region as a function of of the leading jet for the dijet inclusive sample and for events where the leading jets are forced to be back-to-back in , in order to further reduce extra hard-gluon radiation. The observed plateau indicates that the underlying event activity is, to a large extend, independent from the hard interaction. The measurements have been compared to the predictions from PYTHIA pythia and HERWIG herwig Monte Carlo programs including leading-order QCD matrix elements plus initial and final parton showers. The PYTHIA samples have been created using a special tuned set of parameters, denoted as PYTHIA-Tune A tunea , which includes an enhanced contribution from initial-state soft gluon radiation and a tuned set of parameter to control secondary parton interactions. It was determined as a result of similar studies of the underlying event performed using CDF Run I data underlying . PYTHIA-Tune A describes the hadronic activity in transverse region while HERWIG underestimates the radiation at low .
III JET SHAPES
The internal structure of jets is dominated by multi-gluon emissions from the primary final-state parton. It is sensitive to the relative quark- and gluon-jet fraction and receives contributions from soft-gluon initial-state radiation and beam remnant-remnant interactions. The study of jet shapes at the Tevatron provides a stringent test of QCD predictions and tests the validity of the models for parton cascades and soft-gluon emissions in hadron-hadron collisions.
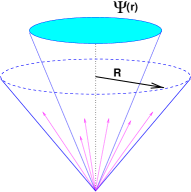
The CDF experiment has presented results shapes on jet shapes for central jets with transverse momentum in the region GeV, where jets are searched for using the midpoint222A merging fraction has been used instead of the default . algorithm and a cone size . The integrated jet shape, , is defined as the average fraction of the jet transverse momentum that lies inside a cone of radius concentric to the jet cone:
| (2) |
where denotes the number of jets. The measured jet shapes have been compared to the predictions from PYTHIA-Tune A and HERWIG Monte Carlo programs.
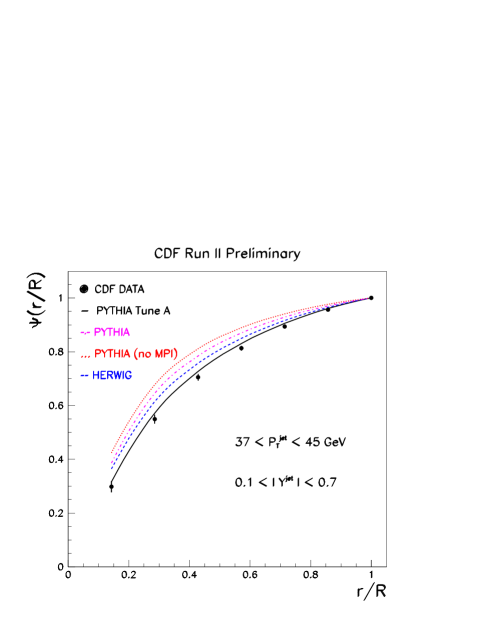
In addition, two different PYTHIA samples have been used with default parameters and with and without the contribution from multiple parton interactions (MPI) between proton and antiproton remnants, the latter denoted as PYTHIA-(no MPI), to illustrate the importance of a proper modeling of soft-gluon radiation in describing the measured jet shapes. Figure 9 presents the measured integrated jet shapes, , for jets with GeV, compared to HERWIG, PYTHIA-Tune A, PYTHIA and PYTHIA-(no MPI) predictions.
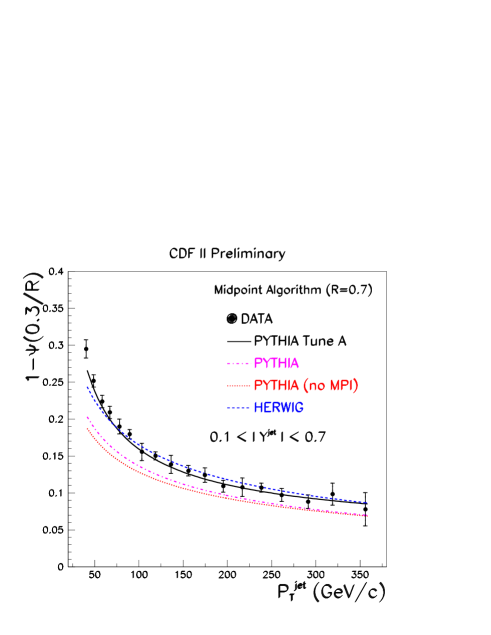
Figure 10 shows, for a fixed radius , the average fraction of the jet transverse momentum outside , , as a function of where the points are located at the weighted mean in each range. The measurements show that the fraction of jet transverse momentum at a given fixed increases ( decreases) with , indicating that the jets become narrower as increases. PYTHIA with default parameters produces jets systematically narrower than the data in the whole region in . The contribution from secondary parton interactions between remnants to the predicted jet shapes (shown by the difference between PYTHIA and PYTHIA-(no MPI) predictions) is relatively small and decreases as increases. PYTHIA-Tune A predictions describe all of the data well. HERWIG predictions describe the measured jet shapes well for GeV but produces jets that are too narrow at lower .
IV DIJET AZIMUTHAL DECORRELATIONS
The D0 experiment has employed the dijet sample to study azimuthal decorrelations, , between the two leading jets dphi . The normalized cross section,
| (3) |
is sensitive to the spectrum of the gluon radiation in the event. The measurements has been performed in different regions of the leading jet starting at GeV, where the second jet is required to have at least GeV.
Figure 11 shows the measured cross section compared to LO and NLO predictions dphinlo . The LO predictions, with at most three partons in the final state, is limited to , for which the three partons define a Mercedes-star topology. It presents a prominent peak at corresponding to the soft limit for which the third parton is collinear to the direction of the two leading partons. The NLO predictions, with four partons in the final state, describes the measured distribution except at very high and very low values of where additional soft contributions, corresponding to a resummed calculation, are necessary. A reasonable approximation to such calculations is provided by parton shower Monte Carlo programs.
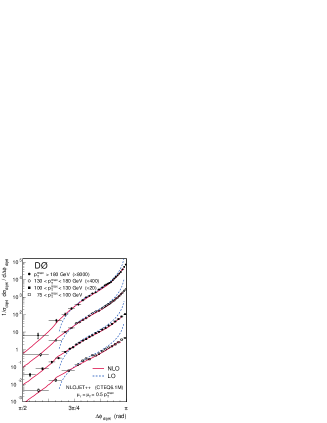
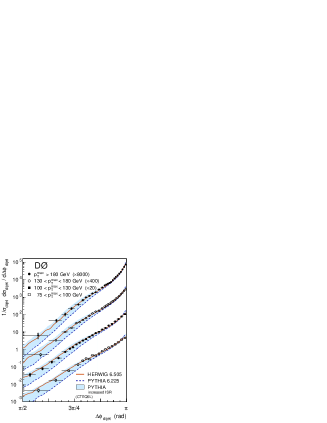
Figure 12 present the measured cross section compared to PYTHIA and HERWIG predictions in different regions of . PYTHIA with default parameters underestimates the gluon radiation at large angles. Different tunes of PYTHIA predictions are possible, which include an enhanced contribution from initial-state soft gluon radiation, to properly describe the azimuthal distribution. HERWIG also describes the data although tends to produce less radiation than PYTHIA close to the direction of the leading jets. This measurements clearly show that angular correlations between jets can be employed to tune Monte Carlo predictions of soft gluon radiation in the final state.
V DIRECT PHOTON PRODUCTION
The measurement of the inclusive photon production as a function of photon transverse momentum, , at the Tevatron constitutes a precise test of pQCD predictions since the energy scale of the electromagnetic calorimeters is well understood by the experiments. The measured cross section is partially dominated by contributions from quark-gluon scattering and therefore provides a powerful constrain of the gluon PDF at high-x. However, it is a rather difficult measurement where a good understanding of QCD backgrounds from and decays into photons is necessary. The D0 collaboration has presented results photon on inclusive photon production, based on 326 of Run II data, in the region and GeV/c (see Figure 13). The measurements are compared to NLO pQCD predictions gnlo .
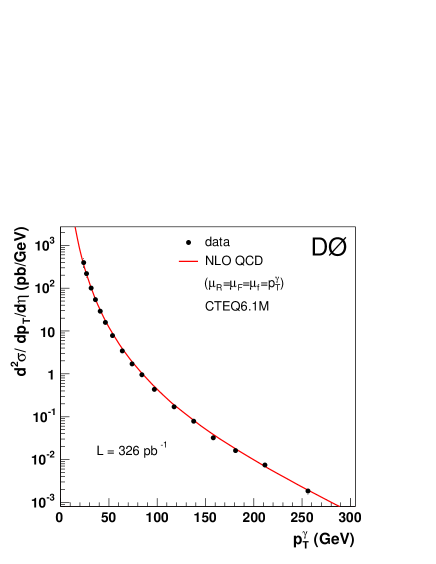
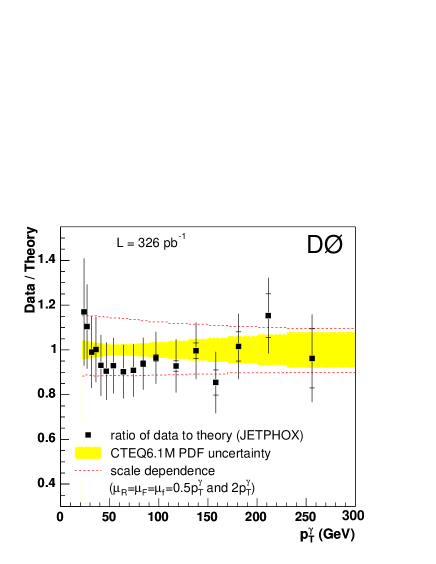
Figure 14 shows the ratio data/NLO as a function of . The measured cross section is well described by the theoretical prediction, where the latter presents uncertainties at the level of about . Future measurements based on few of data will provide valuable information about the proton structure as well as imposes strong constrains to the presence of new physics with very energetic photons in the final state.
VI BOSON PLUS JETS PRODUCTION
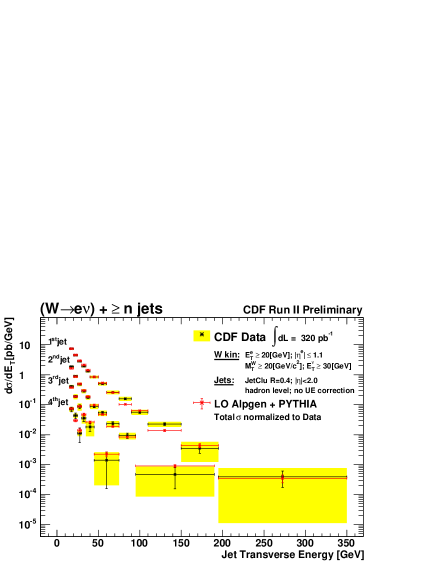
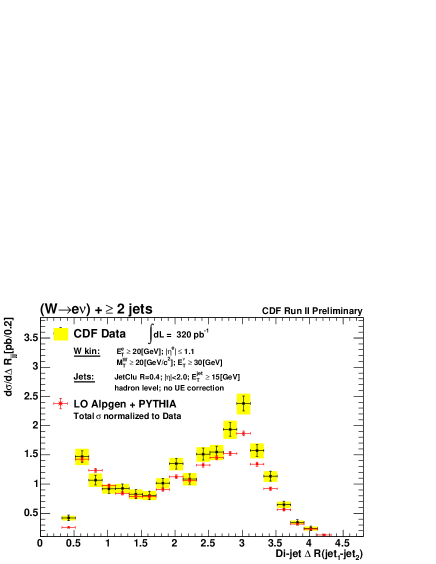
The study of the production of electroweak bosons in association with jets of hadrons in the final state constitutes a fundamental item in the high- physics program at the Tevatron. These events are main backgrounds to many interesting physics processes like, for example, top production, and the search for the SM Higgs and supersymmetry. Therefore, during the last few years a significant effort is being made to develop and validate the necessary Monte Carlo tools to describe these complicated multijet final states. As a result, a number of leading-order Monte Carlo programs are available that describe boson+jet production processes up to large parton multiplicities vecbos ; alpgen ; madgraph , and NLO pQCD parton-level predictions are also available for a limited number of processes (up to boson+2jets production) mcfm . The interface between parton level calculations and parton showers, necessary to describe the complexity of the observed hadronic final states, requires the introduction of different prescriptions to resolve resulting double counts across processes with different parton multiplicities. The theoretical prescriptions employed require validation using data. For this purpose, both CDF and D0 collaborations have performed a careful set of measurements on Boson+jets production. Figure 15 shows the measured distribution for the jet in inclusive production by CDF, based on 320 of Run II data. This observable is particularly sensitive to the details on the implementation of the parton shower interface in the Monte Carlo models. The measurements are compared to leading-order Monte Carlo alpgen predictions interfaced with PYTHIA parton shower, and normalized to the data. Similarly, Figure 16 shows the measured distance, () space, between the two leading jets in inclusive production. The Monte Carlo model provides a reasonable description of the shape of the measured distributions.
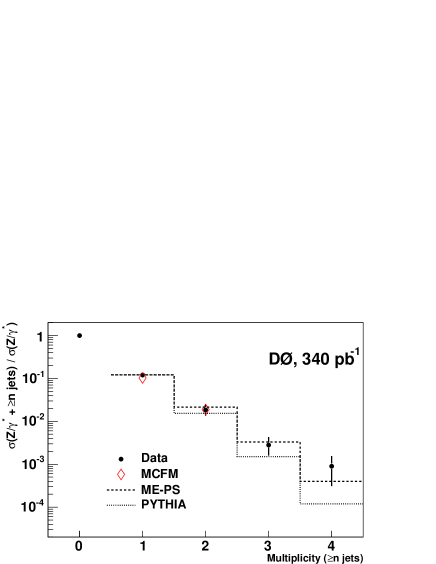
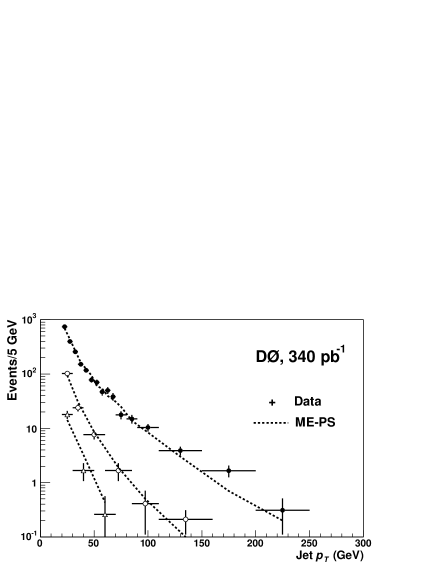
The D0 collaboration has performed a detailed measurement on inclusive production d0Zs . Figure 17 presents the measured cross section, normalized to the total Drell-Yan cross section, as a function of the inclusive jet multiplicity. The measurements are compared to PYTHIA, Matrix Elements+Parton Shower (ME+PS) madgraph , and parton-level NLO calculations mcfm . As expected, PYTHIA, that only includes matrix elements for two-to-two processes, only provides a reasonable description for one and two inclusive jet production333The hardness of the first gluon radiation in a parton showers approximately follows that of matrix elements., while underestimates the production of events with large jet multiplicities. The prediction from ME+PS describes the observed normalized yields as well as the shape of the jet distributions (see Figure 18). Finally, pQCD NLO predictions for one and two inclusive jet production provide a reasonable description of the data.
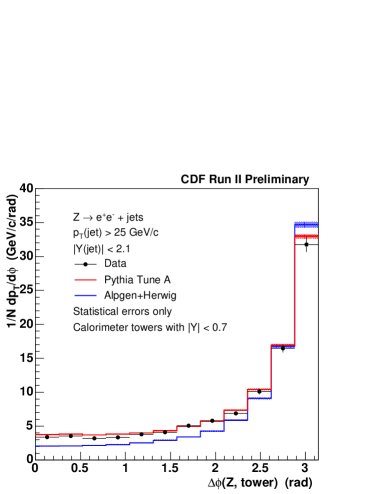
The CDF collaboration has presented first measurements of jet shapes and energy flows in inclusive Z+jet production, which are necessary to validate the modeling for underlying event and soft gluon radiation implemented in the Monte Carlo generators. Figure 19 shows the measured momentum flow (projected to the transverse plane) as a function of the azimuthal distance with respect to the Z direction (), where only the central region of the calorimeter () is considered. In the region the distribution shows the presence of the leading jet. The region is particularly sensitive to a proper description of the underlying event. PYTHIA-Tune A provides a good description of the measured transverse momentum flow while ALPGEN+HERWIG would require additional underlying event activity.
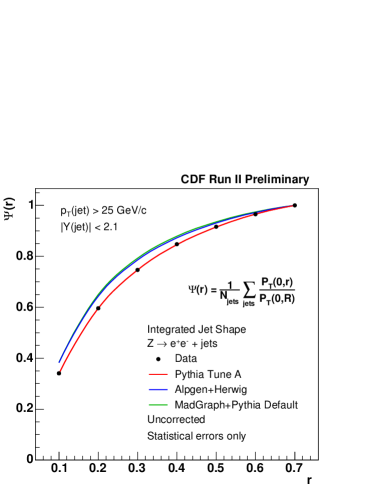
Similar conclusions can be drawn from Figure 20, where the measured jet shape in inclusive Z+jet production is presented. PYTHIA Tune A provides the best description of the data, and the difference between models can be attributed to differences on the underlying event implementation.
VII FINAL NOTES
The Tevatron is delivering luminosity according to expectations and each experiment plans to collect more than of data. During the next few year the jet physics program at the Tevatron will translate into a number of precise measurements that will test the SM and provide very valuable information on how to model QCD processes at the LHC.
Acknowledgements.
I would like to thank the organizers for their kind invitation to the conference.References
-
(1)
B. Abbott et al. (DØ Collaboration), Phys. Rev. Let
t. 82, 2451 (1999).
- (2) T. Affolder et al. (CDF Collaboration), Phys. Rev. D f̱ 64, 032001 (2001). [Erratum-ibid. D 65, 039903 (2002)].
- (3) A. Abulencia et al. (CDF Collaboration), Phys. Rev. Lett. 96, 122001 (2006).
- (4) A. Abulencia et al., hep-ex/0512020.
- (5) S. Catani et al., Nucl. Phys. B 406, 187 (1993).
- (6) S.D. Ellis and D.E. Soper, Phys. Rev. D 48, 3160 (1993).
-
(7)
G. C. Blazey, et al., hep-ex/0005012 (2000).
S.D. Ellis, et al., hep-ph/0111434 (2001). - (8) W.T. Giele, E.W.N. Glover and David A. Kosower, Nucl. Phys. B 403, 633 (1993).
- (9) V.M. Abazov et al. (DO Collaboration), Phys. Lett. B 525, 211 (2002).
- (10) see http://www-cdf.fnal.gov
- (11) see http://www-d0.fnal.gov
- (12) N. Kidonakis and J.F. Owens, Phys. Rev. D 63, 054019 (2001), hep-ph/0007268
- (13) T. Sjöstrand et al., Comp. Phys. Comm. 135, 238 (2001).
- (14) G. Corcella et al., JHEP 0101, 010 (2001).
- (15) pythia-tune a Monte Carlo samples are generated using the following tuned parameters in pyth ia: PARP(67) = 4.0, MSTP(82) = 4, PARP(82) = 2.0, PARP(84) = 0.4, PARP(85) = 0.9, PARP(86) = 0.95, PARP(89) = 1800.0, PAR P(90) = 0.25.
- (16) T. Affolder et al. (CDF Collaboration), Phys. Rev. D 65, 092002 (2002).
- (17) D. Acosta et al. (CDF Collaboration), Phys. Rev. D 71, 112002 (2005).
- (18) V.M. Abazov et al. (D0 Collaboration), Phys. Rev. Lett. 94, 221801 (2005).
- (19) Z. Nagy, Phys. Rev. Lett. 88, 122003 (2002).
- (20) V.M. Abazov et al. (D0 Collaboration), Phys. Lett. B 639 151 (2006).
-
(21)
T. Binoth et al., Eur. Phys. J. C16, 311 (2000).
S. Catani et al., JHEP 05, 028 (2002). - (22) F.A. Berends et al., Nucl Phys B 357 32 (1991).
- (23) M.L. Mangano et al., JHEP 0307 001 (2003).
- (24) F. Maltoni and T. Stelzer, JHEP 0302 027 (2003).
- (25) J. Campbell, R.K. Ellis and D. Rainwater, Phys. Rev. D 68 094021 (2003).
- (26) V.M. Abazov et al. (D0 Collaboration), FERMILAB-PUB-06-283-E.