Measurement of double beta decay of to excited states in the NEMO 3 experiment
Abstract
The double beta decay of 100Mo to the 0 and 2 excited states of 100Ru is studied using the NEMO 3 data. After the analysis of 8024 h of data the half-life for the two-neutrino double beta decay of to the excited state is measured to be T = [5.7(stat)0.8(syst)] y. The signal-to-background ratio is equal to 3. Information about energy and angular distributions of emitted electrons is also obtained. No evidence for neutrinoless double beta decay to the excited state has been found. The corresponding half-life limit is T y (at 90% C.L.).
The search for the double beta decay to the 2 excited state has allowed the determination of limits on the half-life for the two neutrino mode T y (at 90% C.L.) and for the neutrinoless mode y (at 90% C.L.).
keywords:
double beta decay , neutrino , , excited statePACS:
23.40.-s; 14.60.Pq, , , , , , , , , , , , , , , , , , , , , , , , , , , , , , , , , , , , , , , , , , , , , , , , , , , , ,
1 Introduction
The main interest in double beta decay is connected with the neutrinoless mode as a probe for physics beyond the Standard Model of electroweak interactions. Its existence is connected with fundamental aspects of particle physics, for example, non-conservation of the lepton number, the existence and nature of neutrino mass, the existence of right-handed currents in the electroweak interaction, the existence of a massless Goldstone boson (the Majoron) and the existence of supersymmetry [1, 2, 3]).
Interest in neutrinoless double beta decay has seen a significant rebirth in recent years after the evidence for neutrino oscillations was obtained from the results of atmospheric [4] and solar [5, 6, 7, 8, 9] neutrino experiments (see, for example, the discussions in [10, 11, 12]). This observation of oscillations was recently confirmed by the KamLAND experiment with reactor antineutrinos [13] and by the new SNO result [14]. These results are impressive proof that neutrinos have a non-zero mass. However, the experiments studying neutrino oscillations are not sensitive to the nature of the neutrino mass (Dirac or Majorana?) and provide no information on the absolute scale of the neutrino masses, since such experiments are sensitive only to neutrino mass-squared difference . The detection and study of decay is the only practical method to clarify the following characteristics of the neutrino (see discussions in [15, 16, 17, 18]): (i) neutrino nature (is the neutrino a Dirac or a Majorana particle?), (ii) absolute neutrino mass scale (a measurement or a limit on m1), (iii) the type of neutrino mass hierarchy (normal, inverted, or quasi-degenerate), (iv) CP violation in the lepton sector (measurement of the Majorana CP-phases, which requires high precission neutrino oscillation data and reliable nuclear matrix elements).
In connection with the decay, the detection of double beta decay with emission of two neutrinos , which is an allowed process of second order in the Standard Model, provides the possibility for experimental determination of the nuclear matrix elements (NME) involved in the double beta decay processes. This leads to the development of theoretical schemes for nuclear matrix-element calculations both in connection with the decays as well as the decays (see, for example, [19]). At present, to the ground state of the final daughter nucleus has been measured for ten nuclei: , , , , , , , , and (a review of results is given, for example, in Refs. [20, 21]).
The decay can proceed through transitions to the ground state as well as to various excited states of the daughter nucleus. Studies of the latter transitions allow supplementary information about decay to be obtained. Because of smaller transition energies, the probabilities for -decay transitions to excited states are substantially suppressed in comparison with transitions to the ground state. The first exclusive studies of coincidence experiments have been done on 100Mo about 15 year ago [22]. But as it was shown in Ref. [23], by using low-background facilities utilising High Purity Germanium (HPGe) detectors, the decay to the level in the daughter nucleus may be detected for such nuclei as , and . In this case the energies involved in the transitions are large enough (1903, 2202 and 2627 keV, respectively), and the expected half-lives are of the order of y. The required sensitivity was only reached for (the transition was detected in three independent experiments [24, 25, 26]) and [28]. Recently additional isotopes, , , and , have also become of interest to studies of the decay to the level (see review in Refs. [21, 29]).

Theoretical estimates of the decay to a excited state have shown that for a few nuclei (, , , and ) the half-lives can be y [30, 31]. This would mean that the detection of such decays becomes possible using the present and new installations in the future.
It is very important to note that in the framework of QRPA models the behaviour of NME(2) parameter is completely different for transitions to the ground and excited ( and ) states [30, 32]. This is why the decay to excited states may probe different aspects of the calculation method than the decay to the ground states. The transition to excited states of daughter nuclei, which provides a clear-cut signature of such decays, is worthy of special note here: in addition to two electrons with fixed total energy, there appears one ( transition) or two ( transition) photons, their energies being strictly fixed as well. In a hypothetical experiment detecting all decay products with a high efficiency and a high energy resolution, the background could be reduced nearly to zero. Possibly this idea will be used in future experiments featuring a large mass of the substance under study (as mentioned in Refs. [21, 29, 33]). In Ref. [34] it was mentioned that detection of this transition will give us the additional possibility to distinguish the mechanisms (the light and heavy Majorana neutrino exchange mechanisms, the trilinear R-parity breaking mechanisms etc.). So the search for transitions to the excited states has its own special interest.
The 100Mo decay scheme is shown in Fig. 1. The decay to the 0 excited state of 100Ru is accompanied by the simultaneous emission of two electrons and two -rays of the energies of 540 keV and 590 keV. The emission of two electrons and of one -ray of energy 540 keV is the signature of the double beta decay to the 2 excited state.
2 NEMO 3 experiment
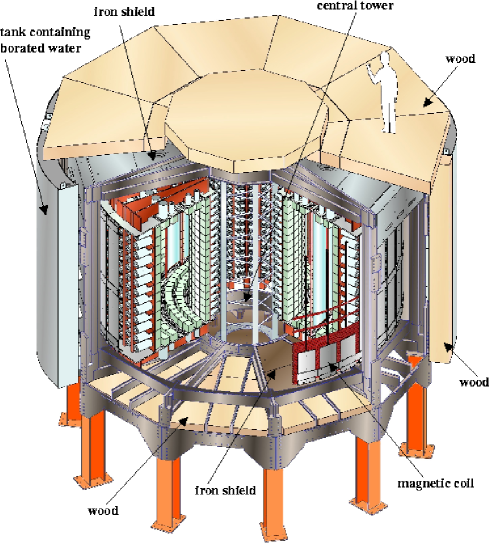
NEMO 3 is a currently running experiment searching for neutrinoless double beta decay. The philosophy behind the NEMO 3detector is the direct detection of the two electrons from decay by a tracking device and a calorimeter [35]. A schematic view of the NEMO 3 detector is shown in Fig. 2. The NEMO 3 detector has three main components, a foil consisting of different sources of double beta decay isotopes and copper, a tracker made of Geiger wire cells and a calorimeter made of scintillator blocks with PMT readout, surrounded by a solenoidal coil. The detector has the ability to discriminate between events of different types by positive identification of charged tracks and photons. The estimated sensitivity of this detector for decay, a function of both the detector design and the isotope type, is of the order of y, which corresponds to an effective neutrino mass at the level of 0.1 – 0.3 eV.
2.1 General description
The NEMO 3 detector is cylindrical in design and is composed of twenty equal sectors. The external dimensions of the detector with shields are about 6 m in diameter and 4 m in height. NEMO 3 is based on the techniques tested on previous incarnations of the experiment NEMO 1 [36], and NEMO 2 [37]:
The wire chamber is made of 6180 open octagonal drift cells which operate in Geiger mode (Geiger cells). A gas mixture of 95% helium, 4% ethyl-alcohol, 1% argon and 0.15% water at 10 mbar above atmospheric pressure is used as the filling gas of the wire chamber. Each drift cell provides a three-dimensional measurement of the charged particle tracks by recording the drift time and the two plasma propagation times. The transverse position is determined from the drift time, while the longitudinal position is deduced from the difference between the plasma propagation times at both ends of the cathode wires. The average vertex position resolution for the two-electron events is cm in the transverse plane of the detector and cm in the longitudinal plane. The Geiger counters information is treated by the track reconstruction program based on the cellular automaton algorithm, described in [38].
The calorimeter, which surrounds the wire chamber, is composed of 1940 plastic scintillator blocks coupled by light-guides to very low-radioactivity photomultiplier tubes (PMTs) developed by Hammamatsu. The energy resolution of the calorimeter ranges from 14.1 to 17.6% for 1 MeV electrons, while the time resolution is of 250 ps at 1 MeV.
The apparatus accommodates almost 10 kg of different double beta decay isotopes, comprising (6914 g), (932 g), (405 g), (454 g), (34 g), (9 g), and (7 g). Most of these isotopes are highly enriched, between 95 – 99%, and are produced in the form of thin metallic or composite foils with a surface density of 30 – 60 mg/cm2. Three sectors are also used for external background measurement and are equipped respectively with pure Cu (one sector, 621 g) and natural Te (1.7 sectors, 614 g of natTeO2). Some of the sources, including 100Mo, have been purified in order to reduce their content of (from 232Th and 228Th, and from 228Ra with half-life of 5.75 y) and (from 226Ra with half-life of 1600 y) either by a chemical procedure [39], or by a physical procedure [35]. The foils are placed inside the wire chamber in the central vertical plane of each sector. The majority of the detector, 12 sectors, is mounted with 6.9 kg of .
The detector is surrounded by a solenoidal coil which generates a vertical magnetic field of 25 Gauss inside the wire chamber. This magnetic field allows electron-positron separation by measuring the curvature of tracks. The ambiguity of the e+/e- recognition based on the curvature reconstruction is 3% at 1 MeV.
The whole detector is covered by two types of shielding against external -rays and neutrons. The inner shield is made of 20 cm thick low radioactivity iron and stops -rays and slow neutrons. The outer shield, comprised of tanks filled with borated water on the vertical walls and wood on the top and bottom, was designed in order to thermalise and capture neutrons.
The experiment is located in the Fréjus Underground Laboratory, the LSM111Laboratoire Souterrain de Modane; http://www-lsm.in2p3.fr, at the depth of 4800 m water equivalent where the remaining cosmic ray flux is only 4.2 muons per m2 per day [40]. In May 2002 the detector took its first data which were used for the study of the detector’s performance. Since February 2003, after the final tuning of the experimental set-up, NEMO 3 has routinely been taking data devoted to double beta decay studies. The calibration with radioactive sources is carried out every 6 weeks. The stability of the calorimeter is checked daily with a laser based calibration system [35].
The advantage of the NEMO 3 detector rests in its capability to identify the two electrons from decay and the de-excitation photons from the excited state of the daughter nucleus. The NEMO 3 calorimeter also measures the detection time of the particles. The use of appropriate time-of-flight (TOF) cuts, in addition to energy cuts, allows an efficient reduction of all backgrounds.
2.2 Background
According to its origin, the background events in NEMO 3 can be divided into two categories. The first category is called internal background and has its origin inside the source foils. This background is mainly due to the presence of radioactive impurities in the foils. Particularly dangerous are -emitters with high values like ( MeV) and ( MeV). These isotopes can produce -like events through three mechanisms: (i) a -decay accompanied by an electron conversion process, (ii) the Möller scattering of a -decay electron, and (iii) a -decay emission to an excited state followed by the Compton scattering of the de-excitation photon.
Great care was taken in the production and subsequent purification of the enriched materials, as well as during the source foil fabrication itself and its installation into the detector to keep any background contamination to the minimum. The source foils were required to satisfy strict radioactivity limits [35].
In addition to the radioactive impurities, the decay is also a source of internal background for the decay to excited states signal because of bremsstrahlung radiation from the electrons. The tail of the distribution from overlaps the window of interest, to some extent, for the decay search. Its contribution depends on the decay half-life and the energy resolution of the detector.
The second category of background in the NEMO 3 experiment is called external background and is caused by electrons or photons generated everywhere else except within the foils. One component of this background is due to radioactive isotopes present in the detector construction materials. This contribution was minimised by a strict selection of low radioactivity materials during the NEMO 3 construction [35, 41]. Another component comes from the laboratory walls and from radon present in the laboratory air. Background from cosmic rays is negligible thanks to the placement of the detector in the underground site. Neutron background is also negligible due to the two types of shields against neutrons and -rays (from neutron capture) and because of use of the magnetic field, which during data processing allows the elimination of e+e- pairs coming from the interaction of high energy photons with the source foils.
The most bothersome external background contribution comes from radon. Radon is a highly diffusive radioactive gas and is outgased into the air from the rock walls of the LSM laboratory. It can enter the detector either through tiny gaps between the sectors, or through gas piping joints. The average radon activity in air of the LSM laboratory is around 10 – 20 Bq/m3, while the measured value of average volume activity of radon inside the NEMO 3 input gas from February 2003 to September 2004 was about 25 – 30 mBq/m3. Radon disintegrates to 214Pb via two -decays. The latter, after a subsequent -decay, generates 214Bi. The decay of to 214Po is generally accompanied by one electron and several photons, it has a recognisable signature consistent with a real event and can only be partially rejected by the TOF cuts. 214Po is an -emitter (T1/2 = 163 s) and decays to 210Pb. NEMO 3 records events with a delay time up to 700 s in order to tag the -particles from the 214Po.
3 Analysis and results
In this work we use the data taken from March 17, 2003 up to September 23, 2004. This time corresponds to the stable period of the operation of the NEMO 3 detector before the installation of an anti-radon factory in order to reduce radon background. The efficient data collection time is 8024 hours (0.92 y) and the total number of triggers was 2.2108.
3.1 Particle identification in NEMO 3
The NEMO 3 detector is capable of identifying electrons, positrons, photons, and -particles by unambiguous topological signatures. We define them in the following way:
-
•
An electron coming from the source foil is recognised as a track going anticlockwise (”negative” track curvature), found by the track reconstruction program and pointing to a fired scintillator. The scintillator has to be isolated from all other fired scintillators.
-
•
A positron is defined like an electron but with the opposite (”positive”) track curvature.
-
•
A photon is defined as a group of one or more fired scintillators, in the same region of the detector, unassociated with any track. It is required that all the scintillators in the group have to be fired close together in time in order to exclude a random coincidence of hits of different origin.
-
•
An -particle is defined as a group of delayed Geiger cell hits, which are in time within 1.5 s and close to each other in space. It is required that an -particle has to be close to the event vertex or to the electron (positron) track.
An example of a typical real event, selected for the study of the double beta decay of 100Mo to the excited 0 state, is shown in Fig. 3.
3.2 Background estimation methods
Two different methods of background estimation are used here to evaluate the decay half-life: the first one is based on Monte-Carlo (MC) simulations (Method 1) [42], while the second one is based on event analysis in selected non-Molybdenum foils (Method 2).
The Method 1 requires the knowledge of activities of all the background sources. These activities have been measured by the HPGe detectors in the LSM laboratory and by radon detectors [35]. A special data analysis allowed the verification of these radioactive contamination levels and further, to determine them with higher precision.
The presence of non-Molybdenum foils in the NEMO 3 set-up allows them to be used for independent background estimation and to provide a cross check (Method 2) to the result obtained with the Method 1. The foils made of Copper, natural and enriched Tellurium, Selenium and Cadmium are used to this end. It is supposed that the contribution from double beta decay to the excited states of other sources such as Tellurium, Selenium and Cadmium can be neglected due to the greater predicted half-lives than for Molybdenum [30, 43]. Consequently, the events selected in the non-Molybdenum foils are expected to be composed only of the sum of the contributions of the internal foil contaminations specific for each source and of the common external background, where the main background component is due to radon in the tracking wire chamber. Knowing the internal contamination values for each source foil [35], one can evaluate the contribution corresponding to the radon background. The number of events due to the internal foil contamination evaluated by MC calculation is found to be negligibly small compared to the number due to the radon background. The number of events from the radon background in non-Molybdenum foils is used to evaluate the radon background in Molybdenum by scaling in proportion to their foil surfaces. The correction due to the variation of the event registration efficiency for different detector parts has been also applied. The recalculation coefficient is determined to be equal to 1.7.
For Method 2 it is not necessary to know the absolute level of the main background from MC simulation. This is an advantage of the method. However its accuracy is limited by low statistics of observed events in non-Molybdenum foils.
3.3 Event selection
In this section we described just the common selection criteria for the four channels of analysis. Other criteria specific for the different channels are given in the section devoted to the each analysis (see Secs. 3.4, 3.5, 3.6 and 3.7).
Only events containing two electrons coming from the source foils and each depositing energy greater than 200 keV in the scintillators are selected. It is required that each track be associated with a unique scintillator which must have a gain greater than 0.17 (keV/ADC channel)-1. Only the tracks starting from the first two Geiger cell layers are kept. The track intersection with the source foil is called a track vertex and then the event vertex, i.e. the presumed double beta decay origin in the source foil, is the average position of the track vertices. Each event has to have its vertex on the source foil. The distance between the track vertex and the event vertex is set to be within 2 cm in the drift plane and within 4 cm in the vertical direction. In order to prevent the wrong determination of the charge of shorter tracks, the events with a track associated with the scintillators on the top or bottom endcaps of the detector close to the source foils are rejected.
To determine whether the origin of the electrons in the event is the source foil (“internal”) or outside the foil (“external”), the time of flight of both particles is used to calculate the corresponding probability of each hypothesis and [35]. The event is accepted as a double beta decay candidate if and .
According to the decay scheme the number of -rays simultaneously emitted from the event vertex (“internal -ray”) must be exactly two for the decay to the 0 state and exactly one for the decay to the 2 state. The estimation of the probability that the -ray was emitted together with each electron from the source foil (internal hypothesis) or crossing the tracking chamber (external hypothesis) was based on the time-of-flight information. Only events with probabilities for electron- pairs and are selected.
In order to suppress the background contribution due to the radon in the tracking chamber, events with -particles must be excluded. The tagging of -particles allows the reduction of the radon background contribution by 40%.
3.4 decay of 100Mo to the 0 excited state of 100Ru
| Number of -clusters per event | Experiment | MC simulation of (00) of 100Mo | MC simulation, radon background |
|---|---|---|---|
| 1 | 24.6% | 15.6% | 24.1% |
| 2 | 56.7% | 56.2% | 55.2% |
| 3 | 14.4% | 21.5% | 16.9% |
| 3 | 4.3% | 6.7 % | 4.4% |
Since in the double beta decay to the 0 excited state there are two electrons and two -rays, it is required that the number of -clusters must be greater or equal to two. This selection criterion is motivated by the fact that a -ray emitted from the source foil can be scattered off a scintillator depositing in it some energy and then hit another scintillator. This requirement allows us to increase the efficiency of the signal selection. The corresponding information about the proportion of events with one, two or more -clusters for the data and MC is given in Table 1.
According to the decay scheme, the energy of each emitted -ray can not be greater than 590 keV. In order to obtain the biggest signal-to-background ratio (S/B), the upper limit on -cluster energy is set to 550 keV and, at the same time, the energy of a cluster corresponding to the “internal -ray” cluster has to be greater than 100 keV. However, if the energy of an extra fired scintillator which is not an “internal photon” is more than 150 keV, the event is rejected. This requirement allows us to suppress events originating from an external -ray that deposits a part of its energy in one scintillator and then interacts with the source foil imitating the signal process.
160 events remained in the data after this event selection. The total number of background events defined by Method 1 and Method 2 is found to be 71.4 and 68.4 events, respectively.
According to both background estimation methods the background is mostly due to the radon in the tracking volume of NEMO 3. To suppress this radon component in the background, events with the cosine of the angle between the two photons less than 0.8 are selected (Fig. 5(e)). A total of 1860 combinations of cuts on the following kinematic parameters has been carried out: the upper limit for the energy sum of the two electrons (E): from 1000 keV to 1900 keV in steps of 100 keV; the upper limit on the energy of each electron (E): from 600 keV to 1000 keV in steps of 50 keV; the lower limit on the energy sum for two “internal -rays” (E): from 300 keV to 800 keV in steps of 100 keV; the lower limit on the energy of each “internal -ray” (E): from 125 keV to 250 keV in steps of 25 keV. For each combination of cuts the two methods of background estimation are used. For each, the results of the calculations of the half-lives for both analysis methods as well as the correlation between them are shown in Fig. 4. The two methods give almost the same average value of the half-life around 61020 y and are in a very good agreement (see Fig. 4).
Finally, after the cut optimisation we have chosen the kinematic cuts providing the maximal value of the product using Method 1, where is the signal registration efficiency. The optimal set of cuts for this criterion is given in Table 2.
| method | Kinematic cuts in keV | 10-4 | S/B | S+B | N | |||
|---|---|---|---|---|---|---|---|---|
| E | E | E | E | |||||
| Method 1 | 1200 | 700 | 500 | 125 | 8.11.0 | 3.0 | 50 | 5.3 |
| Method 2 | 1200 | 700 | 500 | 125 | 8.11.0 | 3.2 | 50 | 5.4 |
The distributions of the decay characteristics of selected events for Method 1 after applying optimal kinematic cuts are shown in Fig. 5(I) and the corresponding background component contributions evaluated by this method are shown in Table 3. In Fig. 5(II) the same spectra obtained using Method 2 are present. The numbers of signal and background events after the cuts obtained for Method 1 are: 37.57.1(stat.)5.2(syst.) and 12.52.9(syst.). For Method 2 the numbers are 38.2 8.4(stat.) 4.7(syst.) and 11.8 4.5(stat.) 0.4(syst.).
The estimation of the systematic uncertainty has been made taking into account the following contributions:
-
•
The two electron detection inefficiency due to the inaccuracy of the GEANT simulation and inaccuracy of the tracking program is estimated to be less than 5%. It is determined by reproducing the activity of the calibrated source placed inside the NEMO 3 detector.
-
•
The efficiency calculation error due to the inaccuracy of the GEANT simulation for -rays is found by comparing the MC simulation and data from the calibration source. For the two -channel it is estimated to be around 10%.
-
•
The effect of the uncertainty in the energy calibration coefficients causes a 2% contribution to the systematic error in the half-life. It has been estimated by the energy scale variation for the experimental data.
-
•
The effect of the single electron energy threshold for the two electron signal is estimated as 3%.
-
•
The effect of the uncertainty of the detector efficiency is evaluated from the comparison of results of the decay to the ground state separately for metallic and composite foils of 100Mo. It is estimated to be around 4%.
-
•
The uncertainty of the radon level measurement is 20% which gives a 6% error in the half-life. This uncertainty is inherent only in analysis Method 1. All other background uncertainties do not introduce any significant error into the evaluation of result.
| Background component | (to g.s.) | internal 214Bi | internal 208Tl | 214Bi (radon inside tracking chamber) | 214Bi (radon outside tracking chamber) |
|---|---|---|---|---|---|
| Number of events | 0.5 | 0.2 | 0.3 | 11.2 | 0.3 |
The total systematic error on the result of analysis Method 1 is 13.8%, and of the Method 2 is 12.4%. It is comparable with the spread of the half-lives for the 1860 kinematic cut combinations presented in Fig. 4.
The final results of the half-life measurements for the two neutrino double beta decay of 100Mo to the 0 excited state of 100Ru for both methods are the following:
3.5 Search for the 0 decay to the 0 excited state of 100Ru
For the study of the neutrinoless double beta decay of 100Mo to the 0 excited state of 100Ru, in addition to the selection criteria described in Sec. 3.3, the energy of each electron is required to be less than 1600 keV and the energy of each photon () to be greater than 125 keV and less than 600 keV according to the particle energy distributions for the 0 mode.
a) b)
The two-dimensional distribution of the energy sum of the two -rays () and the energy sum of the two electrons () is shown in Fig. 6. The expected signal () and the background () efficiencies can be found for each bin of this distribution from the MC simulation. The signal-to-background ratio () may be calculated for each bin, and their average value among all bins is found. It is reasonable to consider only the bins with a significant . If is required, the region searched is composed of 27 bins (see the Fig. 6). 6 experimental events are observed and 6.6 MC background events are expected. Comparing experimental data with the MC background there is no evidence for the 0 signal.
To set the limit we apply a method based on the confidence level computation with small statistics (CLs method) [44] treating each bin of the distribution as independent search channel. The uncertainty in the number of background events has been set at 20% (mostly due to the radon level uncertainty), for the signal efficiency error we use 5%. Using the MCLIMIT program [45] the number of signal events excluded at 90% confidence level is calculated to be 3.9. Taking into account the signal efficiency of 1.3% one may evaluate the limit on the 0 decay half-life:
3.6 Search for the decay of 100Mo to the 2 excited state of 100Ru
This decay produces the emission of two electrons and one photon of 540 keV (Fig. 1). To study this decay channel we perform the same data selection as for the decay to the 0 excited state but with the modified criterion that the number of fired scintillators in event is required to be greater than or equal to 3. The energy sum of all -clusters must be less than 550 keV. In order to select events in the energy region specific for this decay channel, we used the following kinematic cuts for event selection: the total detected energy must be greater than 1000 keV; the energy of the “internal -ray” must be greater than 250 keV; the cosine angle between an electron and the -ray must be less than 0.8. The latter cut is used in order to suppress the possible background from the double beta decay to the ground state accompanied by a -ray tangent to one of electrons emitted by the Bremsstrahlung process in the source foil.
531 events result from this selection, 465 of them can be attributed to the background according to analysis Method 1. The main background contributions according to the MC simulations come from the radon in the tracking chamber (38% of total background), 2 decay to the 0 excited state (15%), 2 decay to the ground state (15%), radon outside the tracking chamber (12%) and internal radioactive contamination of PMTs in 232Th (12%) and 226Ra (12%). The error on the signal () is 43.2 and includes also the systematic uncertainty of the background calculation. The statistical significance of the disagreement between MC and data is 1.5. Using the signal efficiency defined by the MC simulation (0.45%) the half-life limit of the 2 decay of 100Mo to the 2 excited state of 100Ru is calculated to be:
3.7 Search for the 0 decay of 100Mo to the 2 excited state of 100Ru
A similar analysis to that described in Sec. 3.5 has been performed to search for the neutrinoless double beta decay of 100Mo to the 2 excited state. After the preliminary analysis the events with the typical topology were selected and the two-dimensional distribution of the energy sum of the electrons and the energy of the -rays was analysed.
Using the same approach as for the 2 (0) (see sect. 3.5) there are 31 bins of the distribution with ratio greater than the average as shown in Fig. 7.
a) b)
The signal efficiency is found to be 2.9% 222The N* mechanism of decay [46] has been used for MC simulation., 6 events are observed and 5.7 background events are expected. In the limit calculations the background uncertainty (20% mostly due to the radon level uncertainty) and the error on the signal efficiency (5%) have been taken into account. 4.9 signal events are excluded on 90% C.L. and the corresponding limit on the half-life is:
4 Discussion
The results of this analysis of the -decay of 100Mo to the excited states of 100Ru are presented in Table 4 along with previous experimental results and theoretical estimates for the half-lives.
For the transition to the 0 excited state of 100Ru the obtained value is in a good agreement with results of previous experiments. It has to be stressed here that in the present experiment with the NEMO 3 detector, all the decay products (two electrons and two -rays) were detected for the first time and hence all the useful information about the decay was obtained (total energy spectrum, single electron spectrum, single spectrum, and all angular distributions). In previous experiments either individual -rays [24, 25], or the coincidence between the two emitted -rays [26] were detected but no information about electrons was obtained.
| Transi- | T1/2, y | T1/2, y | T1/2, y |
| tion | (this work) | (previous works) | (theor. predictions) |
| ; | 1.61023 | 1.41022(68% C.L.) [47] | 6.81030() |
| 02 | 2.11027() [48] | ||
| ; | 1.11021 | 1.61021 [24] | 3.41022 [49] |
| 02 | (5.5-24)1025 [51] | ||
| 1022 [50] | |||
| 2.11021 [31] | |||
| ; | 8.91022 | 61020 [52] | (7.6-14.6)1024 |
| 00 | () [53] | ||
| 2.61026() [54] | |||
| ; | [5.7(stat)0.8(syst)]1020 | 6.11020 [24] | (0.7 - 1)1021 [55] |
| 00 | [9.3(stat)1.4(syst)]1020 [25] | 2.11021 [49] | |
| [5.9(stat)0.6(syst)]1020 [26] | 1.51021 [51] | ||
| 1.21021 [27] | 1.51020 [31] |
One can compare the measured value with the theoretical predictions, which were obtained using QRPA-based models [49, 31, 55], and the pseudo-SU(3) model [51]. The present accuracy of the theoretical prediction is directly connected to the accuracy of the nuclear matrix elements (NME) calculations and usually is a factor of 4 for the half-life (factor of 2 for the NME). In view of this, it can be seen that there is a reasonable agreement between the experimental and theoretical values of the half-life.
Recently an estimation of the half-life value for the 2 (0 0) transition of 100Mo was carried out using the so-called single state dominance hypothesis (SSDH) [31, 56] and the recent result for electron capture (EC) transition 100Tc 100Mo [57]: T(0) = 4.21020 y [43] (with an accuracy of 50% because of such accuracy of the EC transition [57]). This value is in agreement with our result and if in the future the accuracy of the EC transition can be improved, then a comparison between experimental and estimated values will provide the possibility to check more precisely the SSDH prediction.
Using the phase-space value G = 1.6410-19 y-1 (for gA = 1.254) and the obtained half-life value, one obtains the nuclear matrix element value (NME) for the 2 (0) transition, M(0) = 0.1030.011. One can compare this value with the NME value for the 2-transition to the ground state of 100Ru, which was obtained also with the NEMO 3 detector, M(g.s.) = 0.1260.005 (here T = [7.110.02(stat) 0.6(syst)]1018 [58] and G = 8.910-18 y-1 [30]). One can see that M(g.s.) is 20% greater than M(0). Nevertheless, these values are very close and, taking into account errors and possible uncertainties, their equality can not be excluded. From the viewpoint of the theory it is important to confirm this difference or to rule it out, in particular to ascertain the validity of the SSDH. Future measurements with the NEMO 3 detector where results for both transitions (to the 0+ ground and the 0 excited states) will be improved, will address this further.
The limit obtained for the 2(0) decay is comparable with the limit from Ref. [24] but is 1.5 times lower. In this channel a small excess of events is observed, which probably can be explained by a statistical fluctuation. Future measurements are needed to clarify the status of these extra events. The most optimistic theoretical prediction for 100Mo gives T(0) 210 y [50, 31] for this type of decay which is not very far from the obtained limit. However, the estimation in the framework of the SSDH, which looks more reasonable, gives a higher value, T1/2 = 1.71023 y [43].
Concerning the bound on the 0 decay of 100Mo to 2 and 0 excited states of 100Ru the limits obtained in the present work are better than results of previous experiments by a factor of 10 and 100, respectively. Using the results of theoretical calculations from Refs. [53] and [54] for the 0 decay of 100Mo to the 0 state of 100Ru, one obtains a limit on the effective value of the Majorana mass, 9.3 12.8 eV and 60 eV, respectively. It means that to reach a sensitivity to at the level of of 0.1 eV, the sensitivity to the half-life has to be at the level of 1027 y.
The 0(0) decay had long been accepted to be possible only because of the contribution of right-handed currents and it is not sensitive to the neutrino mass contribution. However, in Ref. [48] it was demonstrated that the relative sensitivities of (0) decays to the neutrino mass and the right-handed currents are comparable to those of 0 decay to the ground state of the daughter nuclei. At the same time, the (0) decay is relatively more sensitive to . Using the limit of T1/2 1.61023 y, the value for the NME from Ref. [48] and the phase-space value from Ref. [59], one can obtain the limits 6.5103 eV and 1.210-4.
5 Conclusion
The results from the NEMO 3 detector for 1 year of measurement and with a higher level of background from 222Rn than expected, have been obtained. Data taking will be continued for a further 5 years with an improved level of radon background. It means that the sensitivity of the experiment will be improved by a factor of . For example, in the case of 2(0) decay 200 events will be detected under conditions of a signal-to-background ratio of 10 and an accuracy for the half-life value reduced by 10%. The sensitivity to the 2(0) decay will be on the level of 1022 y and it could also yield a chance to detect this type of decay (see Table 4). For the 0 transitions to the 2 and 0 excited states the sensitivity will be 1024 y.
References
- [1] A. Faessler and F. Šimkovic, Prog. Part. Nucl. Phys. 46 (2001) 233.
- [2] S.R. Elliot and P. Vogel, Annu. Rev. Nucl. Part. Sci. 52 (2002) 115.
- [3] J.D. Vergados, Phys. Rep. 361 (2002) 1.
- [4] H. Sobel et al., Nucl. Phys. B (Proc. Suppl.) 91 (2001) 127.
- [5] B.T. Cleveland et al., Astrophys. J. 496 (1998) 505.
- [6] S. Fukuda et al., Phys. Rev. Lett. 86 (2001) 5651; Phys. Rev. Lett. 86 (2001) 5656.
- [7] V.N. Gavrin et al., Nucl. Phys. B (Proc. Suppl.) 91 (2001) 36.
- [8] M. Altman et al., Phys. Lett. B 490 (2000) 16.
- [9] Q.R. Ahmad et al., Phys. Rev. Lett. 89 (2002) 011301; Phys. Rev. Lett. 89 (2002) 011302.
- [10] P.C. de Holanda and A.Yu. Smirnov, Phys. Rev. D 66 (2002) 113005.
- [11] J.N. Bahcall et al., J. High Energy Phys. 0207 (2002) 054.
- [12] M. Maltoni et al., Phys. Rev. D 67 (2003) 013011.
- [13] K. Eguchi et al., Phys. Rev. Lett. 90 (2003) 021802.
- [14] S.N. Ahmed et al., Phys. Rev. Lett. 92 (2004) 181301.
- [15] S. Pascoli, S.T. Petcov and W. Rodejohann, Phys. Lett. B 558 (2003) 141.
- [16] S. Pascoli and S.T. Petcov, Phys. Lett. B 580 (2004) 280.
- [17] S.M. Bilenky, hep-ph/0403245.
- [18] S. Pascoli, S.T. Petcov and T. Schwetz, hep-ph/0505226.
- [19] V.A. Rodin et al., Phys. Rev. C 68 (2003) 044302; nucl-th/0503063.
- [20] A.S. Barabash, Czech. J. Phys. 52 (2002) 567.
- [21] A.S. Barabash, Phys. At. Nucl. 67 (2004) 438.
- [22] N. Kudomi, et al., Phys. Rev. 46 (1992) R2132.
- [23] A.S. Barabash, JETP Lett. 51 (1990) 207.
- [24] A.S. Barabash et al., Phys. Lett. B 345 (1995) 408.
- [25] A.S. Barabash et al., Phys. At. Nucl. 62 (1999) 2039.
- [26] L. De Braeckeleer et al., Phys. Rev. Lett. 86 (2001) 3510.
- [27] D. Blum et al., Phys. Lett. B 275 (1992) 506.
- [28] A.S. Barabash, F. Hubert, Ph. Hubert, and V.I. Umatov, JETP Lett. 79 (2004) 10.
- [29] A.S. Barabash, Czech. J. Phys. 50 (2000) 447.
- [30] J. Suhonen and O. Civitarese, Phys. Rep. 300 (1998) 123.
- [31] O. Civitarese, J. Suhonen, Nucl. Phys. A 653 (1999) 321.
- [32] M. Aunola, J. Suhonen, Nucl. Phys. A 602 (1996) 133.
- [33] J. Suhonen, Phys. Rev. 62 (2000) 042501.
- [34] F. Šimkovic and A. Faessler, Prog. Part. Nucl. Phys. 48 (2002) 201.
- [35] R. Arnold et al. (NEMO Collaboration), Nucl. Instr. and Meth. A 536 (2005) 79.
- [36] D. Dassié et al. (NEMO Collaboration), Nucl. Instr. and Meth. A 309 (1991) 465.
- [37] R. Arnold et al. (NEMO Collaboration), Nucl. Instr. and Meth. A 354 (1995) 338.
- [38] I. Kisel et al. (NEMO Collaboration), Nucl. Instr. and Meth. A 387 (1997) 433.
- [39] R. Arnold et al. (NEMO Collaboration), Nucl. Instr. and Meth. in Phys. Res. A 474 (2001) 93.
- [40] C. Berger et al., Nucl. Instr. and Meth. in Phys. Res. A 262 (1987) 463.
- [41] J. Busto et al., Nucl. Instr. and Meth. in Phys. Res. A 492 (2002) 35.
- [42] L. Vála, Ph.D. Thesis, LAL 03-51 (2003).
- [43] P. Domin et al., Nucl. Phys. A 753 (2005) 337.
- [44] Th. Junk, Nucl. Instr. and Meth. A 434 (1999) 435.
- [45] http://cern.ch/thomasj/searchlimits/ecl.html
- [46] M. Doi et al., Progr. Theor. Phys. 66 (1981) 1739.
- [47] H. Ejiri et al., Nucl. Phys. A 611 (1996) 85.
- [48] T. Tomoda, Phys. Lett. B 474 (2000) 245.
- [49] S. Stoica and I. Mihut, Nucl. Phys. A 602 (1996) 197.
- [50] J. Schwieger, F. Šimkovic and A. Faessler, Phys. Rev. C 57 (1998) 1738.
- [51] J.G. Hirsch et al., Phys. Rev. C 51 (1995) 2252.
- [52] D. Dassié et al. (NEMO Collaboration), Phys. Rev D 51 (1995) 2090.
- [53] F. Šimkovic et al., Phys. Rev. C 64 (2001) 035501.
- [54] J. Suhonen, Nucl. Phys. A 700 (2002) 649.
- [55] A. Griffiths and P. Vogel, Phys. Rev. C 46 (1992) 181.
- [56] J. Abad et al., An. Fis. Ser. A 80 (1984) 9.
- [57] A. Garcia et al., Phys. Rev. C 47 (1993) 2910.
- [58] R. Arnold et al. (NEMO Collaboration), Phys. Rev. Lett. 95 (2005) 182302.
- [59] T. Tomoda, Rep. Prog. Phys. 54 (1991) 53.