Branching Fraction for the Doubly-Cabibbo-Suppressed Decay
S. A. Dytman
W. Love
V. Savinov
University of Pittsburgh, Pittsburgh, Pennsylvania 15260
O. Aquines
Z. Li
A. Lopez
S. Mehrabyan
H. Mendez
J. Ramirez
University of Puerto Rico, Mayaguez, Puerto Rico 00681
G. S. Huang
D. H. Miller
V. Pavlunin
B. Sanghi
I. P. J. Shipsey
B. Xin
Purdue University, West Lafayette, Indiana 47907
G. S. Adams
M. Anderson
J. P. Cummings
I. Danko
J. Napolitano
Rensselaer Polytechnic Institute, Troy, New York 12180
Q. He
J. Insler
H. Muramatsu
C. S. Park
E. H. Thorndike
F. Yang
University of Rochester, Rochester, New York 14627
T. E. Coan
Y. S. Gao
F. Liu
Southern Methodist University, Dallas, Texas 75275
M. Artuso
S. Blusk
J. Butt
J. Li
N. Menaa
R. Mountain
S. Nisar
K. Randrianarivony
R. Redjimi
R. Sia
T. Skwarnicki
S. Stone
J. C. Wang
K. Zhang
Syracuse University, Syracuse, New York 13244
S. E. Csorna
Vanderbilt University, Nashville, Tennessee 37235
G. Bonvicini
D. Cinabro
M. Dubrovin
A. Lincoln
Wayne State University, Detroit, Michigan 48202
D. M. Asner
K. W. Edwards
Carleton University, Ottawa, Ontario, Canada K1S 5B6
R. A. Briere
I. Brock
Current address: Universität Bonn; Nussallee 12; D-53115 Bonn
J. Chen
T. Ferguson
G. Tatishvili
H. Vogel
M. E. Watkins
Carnegie Mellon University, Pittsburgh, Pennsylvania 15213
J. L. Rosner
Enrico Fermi Institute, University of
Chicago, Chicago, Illinois 60637
N. E. Adam
J. P. Alexander
K. Berkelman
D. G. Cassel
J. E. Duboscq
K. M. Ecklund
R. Ehrlich
L. Fields
L. Gibbons
R. Gray
S. W. Gray
D. L. Hartill
B. K. Heltsley
D. Hertz
C. D. Jones
J. Kandaswamy
D. L. Kreinick
V. E. Kuznetsov
H. Mahlke-Krüger
P. U. E. Onyisi
J. R. Patterson
D. Peterson
J. Pivarski
D. Riley
A. Ryd
A. J. Sadoff
H. Schwarthoff
X. Shi
S. Stroiney
W. M. Sun
T. Wilksen
M. Weinberger
Cornell University, Ithaca, New York 14853
S. B. Athar
R. Patel
V. Potlia
J. Yelton
University of Florida, Gainesville, Florida 32611
P. Rubin
George Mason University, Fairfax, Virginia 22030
C. Cawlfield
B. I. Eisenstein
I. Karliner
D. Kim
N. Lowrey
P. Naik
C. Sedlack
M. Selen
E. J. White
J. Wiss
University of Illinois, Urbana-Champaign, Illinois 61801
M. R. Shepherd
Indiana University, Bloomington, Indiana 47405
D. Besson
University of Kansas, Lawrence, Kansas 66045
T. K. Pedlar
Luther College, Decorah, Iowa 52101
D. Cronin-Hennessy
K. Y. Gao
D. T. Gong
J. Hietala
Y. Kubota
T. Klein
B. W. Lang
R. Poling
A. W. Scott
A. Smith
P. Zweber
University of Minnesota, Minneapolis, Minnesota 55455
S. Dobbs
Z. Metreveli
K. K. Seth
A. Tomaradze
Northwestern University, Evanston, Illinois 60208
J. Ernst
State University of New York at Albany, Albany, New York 12222
H. Severini
University of Oklahoma, Norman, Oklahoma 73019
(September 22, 2006)
Abstract
We present a measurement of the branching fraction for the
doubly-Cabibbo-suppressed decay
, using 281 of data
accumulated with the CLEO-c detector on the
(3770) resonance. We find
,
where the first uncertainty is statistical, the second is systematic,
and the last error is due to the uncertainty in the reference mode
branching fraction.
pacs:
13.25.Ft
††preprint: CLNS 06/1969††preprint: CLEO 06-14
The Cabibbo-favored hadronic decays of the quark proceed
through
( a virtual boson).
The doubly-Cabibbo-suppressed decays proceed through ,
, and are expected to be suppressed
by a factor
.
The doubly-Cabibbo-suppressed decay
was first observed in 1994 KPRef , and its branching fraction is
now known to good precision (2.8%, relative PDGValue ).
Its ratio to the Cabibbo-favored decay
is measured to be
(3.76 0.09) PDGValue ,
in qualitative agreement with the simple expectations.
Very recently BaBar has observed babar a second doubly-Cabibbo-suppressed decay
(charge-conjugate mode implied
also, throughout). Here we report confirmation of BaBar’s result, with
slightly better accuracy. These measurements can provide insight into
the decay mechanisms for : the validity of SU(3),
and the roles of the annihilation, exchange, and color-suppressed
spectator diagrams relative to the color-favored spectator diagram
theoretical1 ; theoretical2 . A more extensive
picture will be provided by the measurement of the remaining two
doubly-Cabibbo-suppressed decays,
and .
For this measurement, we have used a 281 sample of
colliding beam events, collected at a center-of-mass energy
of 3770 MeV. The events were produced
with the CESR-c storage ring and detected with the CLEO-c
detector. The data sample contains about events (our target sample), one million
events, five million or
continuum events, one million events, and one million radiative return events
(sources of background), as well as Bhabha events, -pair
events, and events (useful for luminosity
determination and resolution studies).
The CLEO-c detector is a general purpose solenoidal detector which
includes a tracking system for measuring momenta and specific
ionization () of charged particles, a Ring Imaging Cherenkov detector
(RICH) to
aid in particle identification, and a CsI calorimeter for detection of
electromagnetic showers. The CLEO-c detector is described in detail
elsewhere CLEODeter002 ; CLEODeter003 ; CLEODeter004 .
The (3770) resonance is below the kinematic threshold
for production, and so the events of interest, ,
have mesons with energy equal to the beam energy.
Having picked the particles being considered to make up
a meson, following Mark III MARK3 we define the two
variables:
(1)
and
(2)
where are the energy and momentum of
each decay product. For a correct combination of particles,
will be consistent with zero, and the beam-constrained mass
will be consistent with the mass.
In addition to , we have studied
the singly-Cabibbo-suppressed decay , as a higher-rate decay possessing kinematics similar to
, and the Cabibbo-favored
decay , as a high-rate,
low-background mode used for normalization. We distinguish between
and using information from the RICH and
information from the central drift chamber. We identify
’s via , detecting the
photons in the CsI calorimeter. We require that the
calorimeter clusters have a measured energy above 30 MeV, have a
lateral distribution consistent with
that from photons, and are not matched to any charged track. We
require that the invariant mass be within 3
standard deviations of the mass.
The mass resolution is 5.4 MeV (Gaussian width ) for
both and . The resolution is 14 MeV for , 15 MeV for , and
5.6 MeV for . The
resolution is 1.90 MeV for , 1.96 MeV for , and 1.35
MeV for .
We select candidate combinations that have between
40 MeV and +35 MeV for and ,
and between 20 MeV and +20 MeV for .
These requirements correspond to roughly 3 standard deviations.
The asymmetric cut for and is due to a low-side tail on energies, and the
wider window is due to poorer energy resolution. To study background,
we select combinations with between 100 and 50 MeV,
and between +45 and +100 MeV (+50 and +100 MeV for ). When an event contains more than one
combination that passes our requirement (a
1.4% occurrence), we
choose the combination with value closest to zero. Multiple
candidates per event for and for are
comparable in frequency, and are
removed by the same procedure. Thus, we allow only one candidate per
event per decay mode per charge.
For those multiple candidate events that contain a real decay, Monte Carlo studies indicate that
our algorithm for picking the “best candidate” gets the right one 2/3
of the time. Because the algorithm uses only, and our
procedure for extracting yield uses a fit to , the
algorithm introduces no bias.
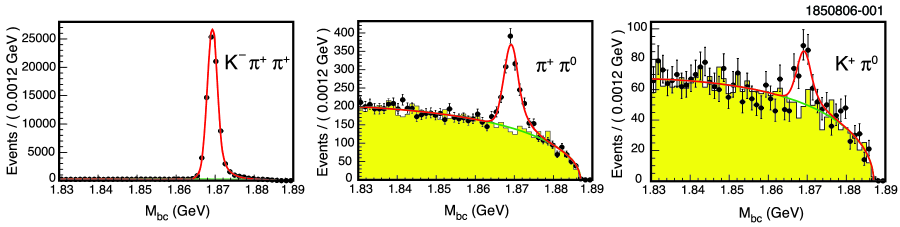
Figure 1: distributions of ,
and
. The points
are obtained by selecting the signal region, the shaded
histogram is from the sidebands, and the lines are
the fit described in the text.
The distributions for candidate combinations are shown in
Fig. 1. The normalization mode is essentially background-free. The mode background is well described by the distribution
obtained from the sideband, as is that for the mode. There is a clear peak in .
Our Monte Carlo studies indicate that 80% of the background to comes from continuum events, 11% from events, 8% from radiative return events, and 1%
from -pair events. The
requirement cleanly separates and decays, so there is no cross-talk between
these modes. There is no evidence for peaking backgrounds.
We perform an unbinned maximum likelihood fit to extract signal yields
from the distributions.
For the signal, we use a Crystal Ball line shape CBFunc ,
which is a Gaussian with a high-side tail. As Monte
Carlo studies show that and
have the same signal shapes, we
have determined the line shape parameters (Gaussian peak location,
Gaussian width, point at which high-side tail begins) from the
distribution, and used
them in the fit to the
distribution. We have varied the shape of the high-side tail as
part of the systematic error study.
For the background, we use an
ARGUS function ArgusFunc ,
with shape parameter determined from the sideband distribution, high-end cutoff given by
, and normalization determined from the fit to the
signal region.
Monte Carlo studies demonstrate that the shape parameter determined
from the sideband correctly describes the shape of the
background in the signal region.
We have also performed a fit with the ARGUS shape parameter free
in the fit, and obtained essentially the same result.
Table 1: The efficiencies (from Monte Carlo, but corrected for
-finding (see below)),
fit yields from data, and branching fractions from data.
Only statistical uncertainties are included.
Mode
(%)
Signal yield
(%)
52.16 0.16
79612 291
9.51 (Input)
47.65 0.15
964 54
0.1326 0.0075
42.30 0.14
148 23
0.0228 0.0036
Results of the fits are shown in Table 1.
Also given in Table 1 is
the detection efficiency for each mode, and the branching fractions
obtained for and . Those branching fractions are obtained
by measuring the respective efficiency-corrected yields
relative to that for , taking that
branching fraction as %, which is taken from
the 2006 Particle Data Group (PDG) value PDGValue .
The branching fraction for is in good agreement with our
previously-published branching fraction using the same data set,
)% BluskPaper . We
emphasize that these results are not independent, and
the value in this paper should not be used in place of
the previous result.
We have considered many sources of systematic error to the branching fraction, including: signal
Monte Carlo statistics, track-finding efficiency,
-finding efficiency, particle identification, the requirement, final state radiation, and the uncertainty from
our fitting procedure (background shape, signal shape). The only
ones greater than 1/10 of the statistical error are -finding
efficiency, background shape, and signal shape.
The Monte Carlo simulation of the calorimeter response to photons is
imperfect, particularly in those angular regions where there is
considerable material between the interaction point and the
calorimeter. The Monte Carlo simulation
overestimates the efficiency for detecting ’s. Various
data-Monte Carlo comparisons suggest a correction factor of (0.95
0.04), which we apply.
The background shape is determined by a fit to the
sideband data. The error on the shape parameter thus obtained
translates into a 4.4% relative error in the branching fraction. The signal shape is
determined by a fit to the
signal. Uncertainty comes from the determination of Gaussian
width , and the point at which non-Gaussian tail sets in
. We have obtained the error ellipse in the
determination of these two parameters, and noted the variation in
fitted yield as one travels
around this error ellipse. In this way, we obtain a relative systematic
error of 2.6%. Note that both the background shape
uncertainty and signal shape uncertainty are really statistical
errors, hence will decrease as additional data are taken.
We have also considered systematic errors to our normalizing mode,
, i.e., to the yield and to
the efficiency. Because this mode is essentially background-free,
background shape and signal shape contribute negligible
errors. Kaon particle identification tends to cancel in the ratio to
.
Pion particle identification efficiency is well-modeled by Monte
Carlo simulation.
Track-finding efficiency – 3 tracks
in normalizing mode vs. 1 track in signal mode, with 0.7% uncertainty
per track – is the largest error, and is less than 1/10 the overall
statistical error (1.4% vs. 16%).
Our final result is
where the first error is statistical, the second error
is systematic, and the third error is from the uncertainty in the
branching fraction,
(9.51 0.34)% PDGValue , used as the normalizing mode.
Our result is in good agreement with the only other measurement of
this branching fraction, BaBar’s recent babar . It can be converted to a width, using the PDG
value for the lifetime ((1040 7) s)
PDGValue , and compared with the width for
doubly-Cabibbo-suppressed decay , using the PDG values for the branching fraction ()
PDGValue and lifetime ( s)
PDGValue . In this way we obtain
The spectator model diagram, expected to be the dominant contribution, predicts
1/2 for the ratio. Annihilation and exchange diagrams, which contribute
differently to the two decays, can shift the ratio away from 1/2. Our result,
and the BaBar result babar , suggest that such a shift is small.
In summary, we have measured the branching fraction for to
be , in agreement with the only other
measurement of that branching fraction, and of comparable accuracy.
We gratefully acknowledge the effort of the CESR staff
in providing us with excellent luminosity and running conditions.
D. Cronin-Hennessy and A. Ryd thank the A.P. Sloan Foundation.
This work was supported by the National Science Foundation,
the U.S. Department of Energy, and
the Natural Sciences and Engineering Research Council of Canada.
References
(1) D. Cinabro . (CLEO Collaboration),
Phys. Rev. Lett. 72, 1406 (1994).
(2) W.-M. Yao . (Particle Data Group),
J. Phys. G 33, 1 (2006).
(3) B. Aubert . (BaBar Collaboration),
Phys. Rev. D 74, 011107(R) (2006).
(4) L.-L. Chau and H.-Y. Cheng, Phys. Lett. B
333, 514 (1994)
(5) C.-W. Chiang and J.L. Rosner, Phys. Rev. D
65, 054007 (2002).
(6) Y. Kubota . (CLEO Collaboration), Nucl. Instrum. Methods
Phys. Res., Sect. A 320, 66 (1992).
(7) D. Peterson ., Nucl. Instrum. Methods
Phys. Res., Sect. A 478, 142 (2002).
(8) M. Artuso ., Nucl. Instrum. Methods
Phys. Res., Sect. A 554, 147 (2005).
(9) J. Adler . (Mark III Collaboration),
Phys. Rev. Lett. 62, 1821 (1989).
(10) T. Skwarnicki, Ph.D thesis, Institute for
Nuclear Physics, Krakow, Poland, 1986.
(11) H. Albrecht . (ARGUS Collaboration), Phys. Lett. B 229,
304 (1989).
(12) P. Rubin . (CLEO Collaboration),
Phys. Rev. Lett. 96, 081802 (2006).