First MINOS Results from the NuMI Beam
Abstract
As of December 2005, the MINOS long-baseline neutrino oscillation experiment collected data with an exposure of protons on target. Preliminary analysis of these data reveals a result inconsistent with a no-oscillation hypothesis at level of 5.8 sigma. The data are consistent with neutrino oscillations reported by Super-Kamiokande and K2K, with best fit parameters of and .
I Introduction
The MINOS long-baseline neutrino oscillation experiment Thomson:2005hm was designed to accurately measure neutrino oscillation parameters by looking for disappearance. MINOS will improve the measurements of first performed by the Super-Kamiokande Fukuda:1998ah ; Ashie:2005ik and K2K experiments Aliu:2004sq . In addition, MINOS is capable of searching for sub-dominant oscillations, can look for CPT-violating modes by comparing to oscillations, and is used to observe atmospheric neutrinos Adamson:2005qc .
The MINOS experiment uses a beam of created at Fermilab National Laboratory and directed at the Soudan mine in northern Minnesota, a distance of 735 km. The composition and energy spectrum of the beam is measured in two detectors, the Near (1 km downstream from the target) and the Far (735 km downstream), allowing for precision measurements of the spectral distortion of the beam.
II The NuMI Neutrino Beam
The Fermilab Main Injector has a minimum cycle time of 1.87 s, with a maximum intensity of protons per pulse for a maximum average power of 0.4 MW of power on the target. Protons are extracted from the Main Injector in a single turn, taking s.
The NuMI neutrino beam Kopp:2005bt is created by directing these protons onto a water-cooled segmented graphite target. Secondary pions from the proton-carbon interactions are deflected into the forward direction by two parabolic focusing elements (horns) before being allowed to decay in a 675 m evacuated decay volume. Undecayed secondaries are stopped by an absorber wall at the end of this volume. The primary proton beam is monitored for position and intensity on target. The secondary hadrons and muons are monitored for position and intensity to ensure good alignment and composition of the beam.
The NuMI beam has been in operation since late 2004. Near the end of 2005, a total exposure of protons were delivered to the target. This exposure was used in the following analysis. At the end of the run period in March 2006, the maximum intensity delivered to the target was in excess of protons per pulse, with a maximum target power of 250 kW.
III The MINOS Detectors
The MINOS Near and Far detectors are constructed to have nearly identical composition and cross-section. The detectors consist of sandwiches of 2.54 cm thick steel and 1 cm thick plastic scintillator, hung vertically. The polyethylene scintillator is in the form of 4 cm-wide strips, with a co-extruded TiO2 reflective coating. Along one side of each strip a groove holds a glued wavelength-shifting optical fibre. Scintillation light created in the scintillator is caught by the fibre, shifted, and transported efficiently to the end of the strip. Clear readout fibres carry the light to multi-anode photomultipliers for readout.
The detectors act as tracking, sampling calorimeters. Strips in adjacent planes are oriented orthogonally, allowing events to be reconstructed in two transverse views. Both detectors are equipped with magnet coils which generate 1.2 T toroidal magnetic fields, which act to contain long muon tracks and provide curvature information for estimating energies.
The Near detector has a total mass of one kiloton, and 282 of these steel planes, 153 of which are instrumented. It uses sampling electronics to distinguish neutrino events in time, due to the large instantaneous intensity during a beam spill. The Far detector masses 5.4 kilotons, and consists of 485 steel planes, 484 of which are instrumented. Because of the low rate in the Far detector, the strips are read out via an 8-fold optical multiplexing.
IV Data Selection
Charged-current events in the MINOS detectors appear as long muon tracks accompanied by short hadronic showers near the event vertex. The two other distinguishable event classes are neutral-current events, which appear only as short, sparse hadronic showers, and charged-current events, which appear as short, dense electromagnetic showers. For this analysis, only charged-current events are considered.
Neutrino events are selected by first taking time-coincidence with the beam spill. This is performed by hardware trigger in the Near detector. In the Far detector candidate events are required to occur at after beam spill (the time-of-flight for neutrinos traveling to Soudan). Charged-current events require a well-reconstructed track in both scintillator views, and confinement of the track vertex to the defined fiducial volumes of each detector. The curvature of the track is selected to be consistent with a . Finally, charged-current events must pass a particle identification cut, which relies on event length, the proportion of calorimetric energy in the shower, and the track . These variables are assembled into a probability density functions and used to create a likelihood-based particle ID parameter shown in Figure 1. A cut is performed on this variable to select a pure CC sample. The total efficiency and purity of this selection is shown in Figure 2.
For selected events, the neutrino energy is reconstructed by taking the sum of the muon energy and the shower energy. Muon energy is found using the range of the muon (if contained) with an accuracy of 6%, or by using the muon curvature (if uncontained) with an accuracy of 10%. The shower energy is found using calorimetry, with an uncertainty of approximately .
V The Near Detector Spectrum
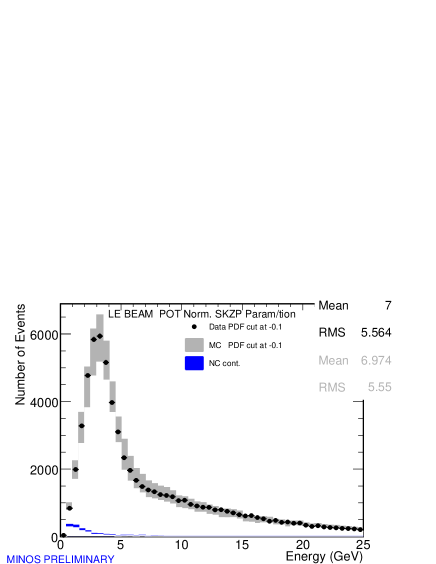
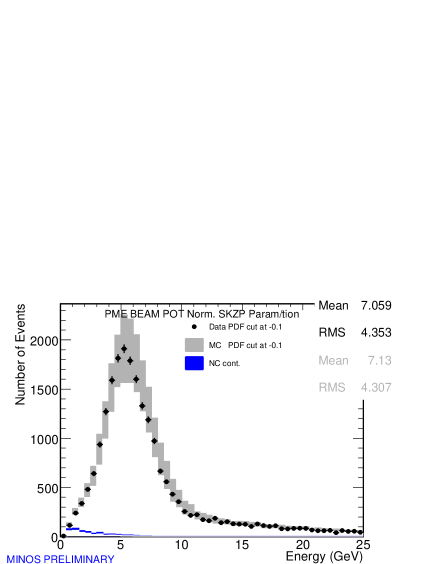
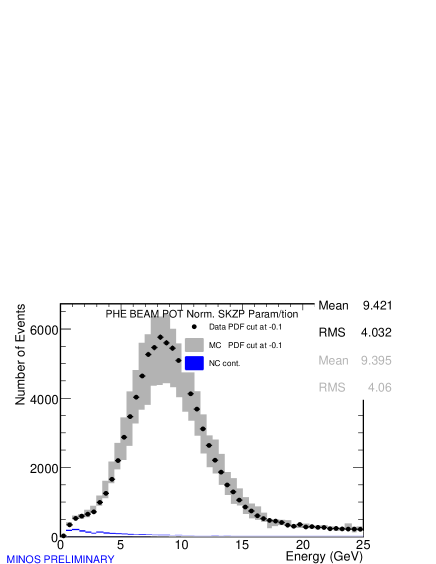
The Near detector neutrino sample is used as the control in the experiment, providing the unoscillated beam spectrum. One of the advantages of the NuMI beam is that the target may be moved relative to the horns, allowing a varying focus of the pions and therefore different neutrino energies. Three such settings are used to create ’high’, ’medium’ and ’low’ energy beams. Although the bulk of data was taken in the low energy configuration (to maximize sensitivity at the oscillation minimum) data was also taken in the other configurations to test beam modeling in the Near detector.
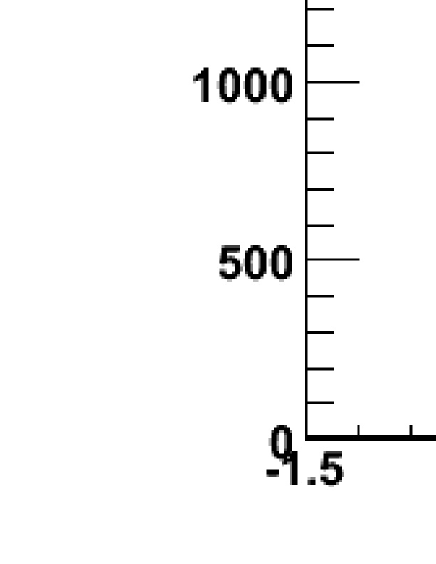
Monte Carlo simulation of the beam predicted the neutrino flux for all beam configurations to within 10%. The residual disagreement was a strong function of beam configuration rather than neutrino energy, implying that the simulation error was due to the modeling of the secondary pions. An empirical function was used to modify the secondary pion simulation as a function of and . This function was fit to data from all configurations. These data and their associated Monte Carlo spectra are shown in Figure 3.
The measured Near detector spectrum was used to predict the Far detector spectrum. First, the observed Near detector reconstructed energy spectrum was corrected for purity and efficiency to obtain the true neutrino spectrum.
Second, the spectrum was corrected for the difference in solid angles subtended by the Near and Far detectors. The smaller range of angles observed by the Far detector results in a narrower spectrum relative to the Near detector. This difference can be robustly estimated by using knowledge of the pion two-body decay kinematics and the geometry of the NuMI beamline. Using the beam Monte Carlo, a matrix is created that transforms a true Near detector spectrum into a true Far detector spectrum.
Last, the predicted true Far detector spectrum is simulated by Monte Carlo to create an expected reconstructed neutrino spectrum which can be compared to data.
VI Far Detector Results
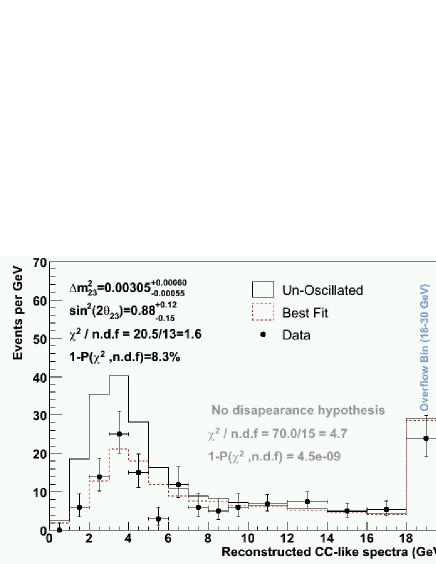
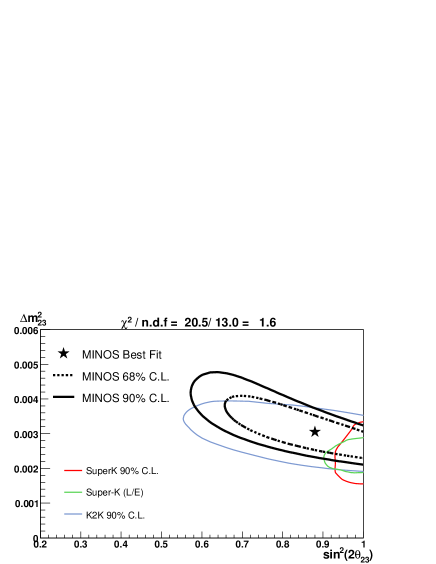
The observed reconstructed neutrino spectrum at the Far detector is shown in Figure 4. The data do not agree with the unoscillated prediction; this null hypothesis is excluded at 5.8 sigma. When fitted to a two-neutrino oscillation hypothesis, a fit is found with reasonable probability within a parameter space shown in Figure 5. In this fitting procedure, only statistical errors were considered.
Systematic errors were estimated by taking Monte Carlo data samples simulated near the best fit point for the data. Systematic errors were introduced to the Monte Carlo and not corrected in analysis. The resulting shift in the best fit point is taken as the systematic error on that parameter. The systematic errors considered are shown in Table 1. These systematics are briefly discussed below.
- Normalization
-
changes the overall expected number of events at the Far detector, based upon a combination of uncertainty on protons-on-target and the fiducial mass. This is known to 4%.
- Muon energy scale
-
is the uncertainty on the average energy of muons due to incorrect steel density or magnetic field modeling. This is known to 2%.
- Relative shower energy scale
-
is the degree of confidence to which the hadronic calorimetry in the Near detector matches that in Far. The energy scale between these two detectors after calibration should agree to within 3%.
- NC contamination
-
is the uncertainty on the number of neutral current background events erroneously accepted into the charged current sample. A conservative error of 30% is used.
- CC Cross section
-
is allowed to vary in several ways: the KNO parameters governing the relative fraction of resonance to deep inelastic scattering fraction were allowed to change by 20%, and the axial mass for quasi-elastic events and resonance events were allowed to change by 5%.
- Beam uncertainty
-
is the difference in measured parameters given that the data is fit without re-tuning the Monte Carlo beam simulation to the Near detector data. That is, an incorrect beam matrix was used to extrapolate the beam to find the shift in fit values.
- Intra-nuclear rescattering
-
gives the uncertainty due to poor modeling of the energy loss of pions scattered or re-absorbed as they leave the target nucleus. This energy cannot be detected, and so an uncertainty on this interaction creates an uncertainty on the absolute hadronic shower energy scale at both detectors.
| Description | ||
|---|---|---|
| Normalization 4% | 0.025 | |
| Muon energy scale 2% | 0.020 | |
| Relative Shower energy scale | 0.020 | |
| NC contamination 30% | 0.035 | |
| CC cross-section uncertainties | 0.016 | |
| Beam uncertainty | 0.012 | |
| Intra-nuclear re-scattering | 0.030 | |
| Total Systematic Error | 0.063 | |
| Total Statistical Error | 0.15 |
Table 1 also shows the sum of these systematic errors taken in quadrature, as compared to the statistical errors. It can be seen that for this limited data set, MINOS is statistically limited. Systematic errors have a negligible effect on the contour at this sensitivity.
.
VII Conclusions
MINOS has completed a preliminary analysis of the first protons on target, and found a result incompatible with no oscillations at a significance level of 5.8 sigma. The signal is consistent with oscillations seen by Super-Kamiokande and K2K at the 90% confidence limit. Systematic errors are believed to be under control at the limit of the current statistics. This result will significantly improve the world average on .
MINOS currently has a data sample of approximately protons on target, and will be analyzing this expanded data set for summer 2006. MINOS intends to continue collecting data until at least 2010, at which time it’s physics sensitivity is expected to be considerably improved.
Acknowledgements.
This work was supported by the U.S. Department of Energy, the U.K. Particle Physics and Astronomy Research Council, the U.S. National Science Foundation, the State and University of Minnesota, the Office of Special Accounts for Research Grants of the University of Athens, Greece, and FAPESP (Fundacao de Amparo a Pesquisa do Estado de Sao Paulo) and CNPq (Conselho Nacional de Desenvolvimento Cientifico e Tecnologico) in Brazil. We gratefully acknowledge the Minnesota Department of Natural Resources for their assistance and for allowing us access to the facilities of the Soudan Underground Mine State Park. We particularly thank the Fermilab Beams Division and the rest of the Fermi National Laboratory for their work and support in creating, operating, and improving the NuMI beam.References
- (1) M. A. Thomson, Nucl. Phys. Proc. Suppl. 143, 249 (2005).
- (2) Y. Fukuda et al. [Super-Kamiokande Collaboration], Phys. Rev. Lett. 82, 2644 (1999) [arXiv:hep-ex/9812014].
- (3) Y. Ashie et al. [Super-Kamiokande Collaboration], Phys. Rev. D 71, 112005 (2005) [arXiv:hep-ex/0501064].
- (4) E. Aliu et al. [K2K Collaboration], Phys. Rev. Lett. 94, 081802 (2005) [arXiv:hep-ex/0411038].
- (5) P. Adamson et al. [MINOS Collaboration], Phys. Rev. D 73, 072002 (2006) [arXiv:hep-ex/0512036].
- (6) S. E. Kopp, arXiv:physics/0508001.