MIXING STUDIES AT THE TEVATRON
Measurement of the oscillation frequency via mixing analysis provides a powerful constraint on CKM matrix elements. This note briefly reviews the motivation behind these analyses and describes the various steps that go into a mixing measurement. Recent results on mixing obtained by the CDF and DØ collaborations using the data samples collected at Tevtron Collider in the period 2002 - 2005 are presented.
1 Introduction
Mixing is the process whereby some neutral mesons change from their particle to their anti-particle state, and vice versa. This kind of oscillation of flavor eigenstates into one another was first observed in the meson system. It has since then been seen for mesons, first in an admixture of and by UA1 and then in mesons by ARGUS . The combinations of these results already indicated that the frequency of mixing oscillations was higher than the frequency of oscillation. The frequency of the oscillation is proportional to the small difference in mass between the two eigenstates, , and for the system can be translated into a measurement of the CKM element . has been precisely measured (the world average is ps-1) but large theoretical uncertainties dominate the extraction of from . This problem can be reduced if the mass difference, , is also measured. can then be extracted with better precision from the ratio:
| (1) |
where is estimated from Lattice QCD calculations to be . The above has motivated many experiments to search for oscillations though a statistically significant signal hasn’t been observed before this work, a lower limit of ps-1 at 95% C.L. has been set. Since this current limit indicates that the oscillations are at least 30 times faster than the oscillations, a mixing measurement is experimentally very challenging. If the Standard Model is correct, then is expected from global fits to the unitarity triangle to be in the range ps-1 at the one standard deviation confidence level .
In the - system there are two
mass eigenstates, the heavier (lighter) one having mass
() and decay width ().
Denoting and
, the time dependent
probability that a oscillates into a
(or vice versa) is given by
while the probability that the does not oscillate is
given by
,
assuming that is small and neglecting CP violation.
2 Tevatron Detectors
2.1 CDF detector
The CDF detector is described in detail elsewhere . The components most relevant to this analysis are briefly described here. The tracking system is in a 1.4 T axial magnetic field and consists of a silicon microstrip detector surrounded by an open-cell wire drift chamber (COT). The muon detectors used for this analysis are the central muon drift chambers (CMU), covering the pseudorapidity range , and the extension muon drift chambers (CMX), covering , where and is the polar angle.
2.2 DØ detector
The DØ detector is described in detail elsewhere . The central tracking and muon systems are the components most important to this analysis. The central tracking system consists of a silicon microstrip tracker (SMT) and a central fiber tracker (CFT), both located within a 2 T superconducting solenoidal magnet, with designs optimized for tracking and vertexing for pseudorapidities and , respectively. An outer muon system, at , consists of a layer of tracking detectors and scintillation trigger counters in front of 1.8 T toroids, followed by two similar layers after the toroids .
3 Analysis Technique
The analysis starts with the reconstruction of the final state of the meson. At CDF, the mesons reconstructed in semileptonic as well as in hadronic decays of . DØ uses only the semileptonic decays of the meson for the final state reconstruction. CDF has about 18,200 in 765 of data. It also has about 2300 signal candidates in Hadronic channels. DØ analyzes 1 fb-1 of data and reconstruct events in the decay .
In order to know the initial flavor of the mesons, an Initial State Flavor tagging technique is used. The second meson (or baryon) in the event was used to tag the initial flavor of the reconstructed meson. The tagging technique utilized information from identified leptons (muons and electrons) and reconstructed secondary vertices. For reconstructed decays both leptons having the same sign would indicate that one hadron had oscillated while opposite signs would indicate that neither (or both) had oscillated. The performance of the flavor tagging is characterized by the efficiency, , where is the number of tagged mesons, and is the total number; the tag purity , defined as , where is the number of mesons with correct flavor identification; and dilution, related to purity as . The tagging can be performed on the opposite side as well as on the same side of the reconstructed meson. Three main tagging algorithms were used in the present analysis viz. Soft Lepton Tagging (where lepton could be a muon or an electron), Jet Charge Tagging and Same Side Tagging (only at CDF). The performance of the CDF’s combined Opposite Side Tagging (OST) is, . The Same Side Tagging (SST) Performance is, . The DØ combined OST Performance is, . The taggers were tuned by measuring the mixing oscillations and DØ finds ps-1 in good agreement with the world average of ps-1 . After applying the tagging to the DØ data, tagged events were found.
Once the tagging is performed, the proper decay time of candidates is needed. The proper decay length of each mesons is found as , where is the vector in the transverse plane from the primary to the decay vertex, and GeV . However, in the case of semileptonic decay, the undetected neutrino does not allow a precise determination of the meson’s momentum and Lorentz boost. To take into account the effects of neutrinos and other lost or non-reconstructed particles, a factor was estimated from Monte Carlo (MC) simulation by finding the distribution of for a given decay channel. The proper decay length of each meson is then , where is the measured visible proper decay length (VPDL). The VPDL uncertainty was determined by the vertex fitting procedure and track parameter uncertainties. To account for possible mismodeling of detector uncertainties, resolution scale factors were introduced as determined by examining the pull distribution of the the vertex positions of a sample of decays.
4 Results and Conclusions
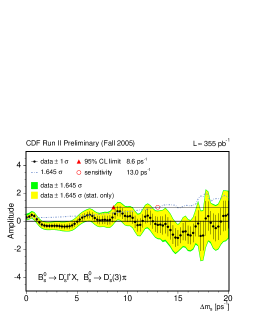
Using the Amplitude Fit Method and 365 pb -1 of data, CDF puts a limit on oscillations frequency of 8.6 ps-1 and sensitivity of 13.0 ps-1 at 95% C.L.
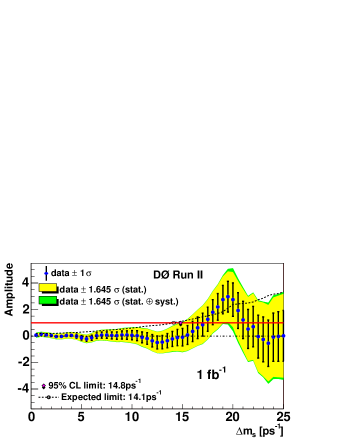
DØ using the similar method finds a limit of 14.8 ps-1 and sensitivity of 14.1 ps-1 at 95% C.L. DØ also performed a likelihood scan as a function of . Figure 2 shows the value of as a function of , indicating a favored value of 19 ps-1, while variation of from the minimum indicates an oscillation frequency of ps-1 at the 90% C.L. The uncertainties are approximately Gaussian inside this interval. The parametrized MC test shows that for a true value of ps-1, the probability was 15% for measuring a value in the range ps-1 with a - lower by at least 1.9 than the corresponding value at .
To test the statistical significance of the observed minimum, an ensemble test using the data sample was performed by randomizing the flavor tag and retaining all other information for the candidate, effectively simulating a oscillation with an infinite frequency. The ensemble test results shows that the probability to observe a minimum in the range ps-1 with a decrease in with respect to the corresponding value at ps-1 of more than 1.7, corresponding to our observation including systematic uncertainties, was found to be . This range of was chosen to encompass the world average lower limit and the edge of our sensitive region.
5 outlook
Further improvements are planned for future which includes improvements both in detector and analysis technique. After this conference, CDF updated their mixing analysis and the latest CDF results can be found here .
Acknowledgments
I am grateful to Prof. D.S. Kulshrestha for his continuous guidance and helpful suggestions. My sincere thanks to Fermilab and the organizers of the Moriond QCD conference for supporting me to attend this conference.
References
References
- [1] C.Albajar et al. (UA1 Collaboration),“Search for B0- Anti-B0 Oscillations at the CERN P- Anti-P Collider,” Phys. Lett. B186, 247 (1987).
- [2] H.Albrecht et al. (ARGUS Collaboration),“Observation of B0- Anti-B0 Mixing,” Phys. Lett. B192, 245 (1987).
- [3] The Review of Particle Physics by the Particle Data Group, S.Eidelman et al., Phys. Lett. B592, 1 (2004).
- [4] J. Charles et al. [CKMfitter Group], “CP violation and the CKM matrix: Assessing the impact of the asymmetric B factories,” arXiv:hep-ph/0406184.
- [5] D. Acosta et al. [CDF Collaboration] Phys. Rev. D 71, 032001 (2005).
- [6] V. Abazov et al. [DØ Collaboration] “The Upgraded DØ Detector,” submitted to Nucl. Instrum. Methods Phys. Res. A., arXiv:hep-physics/0507191.
- [7] V.M. Abazov et al., Nucl. Instrum. Meth. Phys. Res. A 552, 372 (2005).
- [8] H.G.Moser and A.Roussarie, Nucl. Instrum. Methods A 384, 491 (1997).
- [9] V. Abazov et al. [DØ Collaboration] “First Direct Two-Sided Bound on the Oscillation Frequency,” submitted to Physical Review Letters, arXiv:hep-ex/0603029.
-
[10]
D. Acosta et al. [CDF Collaboration],
http://www-cdf.fnal.gov/physics/new/bottom/060406.blessed-Bsmix/