Baryon decays in Belle
We report recent observations of baryonic decays with charmless and charmed baryons in the final state. We show the angular distributions of the di-baryon low-mass enhancements in the charmless three-body baryonic decays and the branching fractions of decays with two charmed baryons or charmonium in the final states. We also report the observation of the decay at Belle.
1 Introduction
Observations of several baryonic decays have been reported by Belle. The measured branching fractions for charmless and charmed baryonic decays are shown in Fig. 1. In the charmless final states, only the three-body decays have been observed. In this contribution, we report on the angular distribution of the di-baryon low-mass enhancements seen in the charmless three-body baryonic decays. The data support the quark fragmentation interpretation, while the gluonic resonance picture is disfavored. In the charmed final states, we observed the two-body and three-body decays with two charmed baryons or charmonium. From the latter we can extract the branching fractions of into baryon pairs and - for the first time - into . Measuring decay rates of to different di-baryon modes is a very useful check for theoretical predictions and can shed light on quark-diquark dynamics. The data sample was collected with Belle detector at the KEKB asymmetric-energy (3.5 GeV on 8.0 GeV) collider. KEKB operates at the resonance ( = 10.58 GeV) with a peak luminosity that has exceeded 1.5 cm-2s-1.


2 Charmless baryonic decays
Observations of several charmless baryonic decays have been reported at Belle. One common feature of these observations is the peaking of the di-baryon mass spectra toward threshold. We first measured the differential branching fractions for (a), (b), (c) and (d) modes. There are two kinematic variables in the center of mass frame which are usually used to extract the candidates: the beam energy constrained mass = , and the energy difference = , where is the beam energy, and and are the momentum and energy of candidates. signal yield is obtained by a 2D fit to the (,) distribution for each bin of di-baryon invariant mass. The efficiency as a function of the di-baryon mass is based on the MC simulation. The differential branching fraction for each bin in the di-baryon mass is obtained from the fitted yield and the signal efficiency (Fig. 2). The branching fraction is a sum of the differential branching fractions.
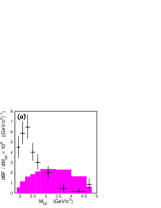
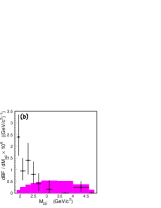
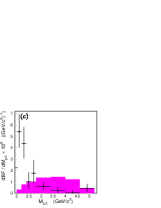

The angular distribution of the proton is studied in the di-baryon system. Fig. 3 shows the angular distributions for the four decay channels. The angle is defined for (a) as the angle between the directions of and in the rest frame. There is a clear forward peak and the angular asymmetry, defined as
| (1) |
where and stand for the efficiency corrected yield with 0 and 0, respectively, amounts to 0.59 for the mode. The asymmetry of the distribution indicates that the fragmentation picture is favored. Antiprotons are emitted along the direction most of the time, which can be explained by a parent penguin transition followed by fragmentation into the final state. The distribution for (b) is flat, but we have to note that in this case the statistics is low and carries no flavor information. If in (c) we choose the angle of with respect to the in the rest frame of the system, the distribution is quite flat. However, the shows a forward peak structure if the angle is defined as the direction relative to the direction in the rest frame. It is evident that the fragmentation interpretation is supported: the proton tends to emerge parallel to the baryon. The angle of (d) is measured between the proton direction and the direction in the baryon pair rest frame. There is also a clear forward structure in the distribution and the angular asymmetry A is 0.36. This distribution supports the fragmentation picture where the tends to emerge opposite to the direction of the photon.


3 Charmed baryonic decays
In the analysis, we reconstruct the following decay modes: and , , , and . We use a simultaneous two-dimensional binned maximum likelihood fit to the vs. distributions (for the two channels) with a common value of . For this fit, we constrain the ratio to the recent Belle measurement of . The fit gives the product of branching fractions of with the value of 4.8 and a statistical significance of 8.7 . We also check the mode which is an isospin partner of the mode. The product of branching fraction of is measured to be (9.3) . The uncertainties in the products of branching ratios are statistical, systematic and the uncertainty from the branching fraction.
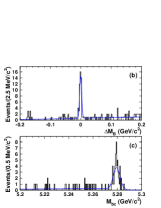
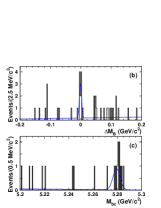
The and decays are three-body decays that proceed via a transition. We detect the via the , and decay channels. When a and are combined as decay daughters, at least one of is required to have been reconstructed via the decay process. Here, the parameter mass difference is used instead of the energy difference , since shows a correlation with . The mass difference is defined as , where is the reconstructed mass of the candidate and is the world average meson mass. Fig. 4 shows and projections for and decays. A two-dimensional binned maximum likelihood fit is performed to determine the signal yield. From the fit we obtain signal yields of 48.5 and 10.5 events with statistical significances of 15.4 and 6.6 , for and , respectively. Hence, we obtain the branching fractions of
where the first and the second errors are statistical and systematic, respectively. The last error is due to the 52 % uncertainty in the absolute branching fraction, .
We study two-body baryonic decays of charmonia in the meson decays, and . The signal yields are obtained from 10 MeV/c2 wide () mass bins from the kinematic threshold to 4.5 GeV/c2. The results of are the mass of M = 2.971 0.003 GeV/c2(2.9740.007 GeV/c2) and the width of = 48 5 MeV/c2(40 19 5 MeV/c2) from () mode. We define the signal region as 2.940 GeV/c2 3.020 GeV/c2. The fitted signal yield, efficiency and branching fraction are shown in Table 1. In this study the decay has been observed for the first time, with . The observed is which is consistent with theoretical expectation. We define the signal region as 3.075 GeV/c2 () 3.117 GeV/c2 and use events in this signal region to study the proton angular distribution in the helicity frame of the . The helicity angle is defined as the angle between the proton flight direction and the direction opposite to the flight of the kaon in the rest frame. The angular distribution of the kaon direction in the rest frame is parameterized as with . We determine to be -0.60 0.13 0.14 () and -0.44 0.51 0.31 (.
| Modes | Yield | Efficiency(%) | |
|---|---|---|---|
| 195.1 | 35.8 0.3 | 1.58 0.12 0.47 | |
| 19.5 | 5.3 0.1 | 0.87 | |
| 317.2 | 37.3 0.4 | 2.21 0.13 0.31 0.10 | |
| 45.9 | 5.9 0.3 | 2.00 0.34 0.08 |
References
References
- [1] Belle Collaboration, M.-Z. Wang et al., Phys. Rev. Lett. 90, 201802(2003).
- [2] Belle Collaboration, M.-Z. Wang et al., Phys. Rev. Lett. 92, 131801(2004).
- [3] Belle Collaboration, Y.-J. Lee, M.-Z. Wang et al., Phys. Rev. Lett. 93, 211801 (2004).
- [4] Belle Collaboration, M.-Z. Wang et al., Phys. Lett. B 617, 141(2005).
- [5] Belle Collaboration, Y.-J. Lee, M.-Z. Wang et al., Phys. Rev. Lett. 95, 061802(2005).
- [6] M. Anselmino, F. Caruso, S. Forte and B. Pire, Phys. Rev. D 38, 3516 (1988).
- [7] S. Kurokawa and E. Kikutani, Nucl. Instrum. Methods Phys. Res. A499, 1(2003).
- [8] Belle Collaboration, R. Chistov et al., hep-ex/0510074.
- [9] Belle Collaboration, N. Gabyshev et al., hep-ex/0508015.
- [10] Belle Collaboration, T. Lesiak et al., Phys. Lett. B 605, 237 (2005), Erratum 617, 198 (2005).
- [11] F. Murgia and M. Melis, Phys. Rev. D 51, 3487 (1995).