NEW RESULTS ON DIRECT CP VIOLATION IN CHARGED KAON DECAYS BY NA48/2
The NA48/2 result, based on the data collected during the 2003 run, on direct CP violation in decay is presented. The main goal of the experiment is to reach a sensitivity at level of in the measurement of the charge asymmetry parameter , where is the linear slope of the Dalitz plot in the decay. Thanks to the simultaneous collection of the two kaon charges and to the high resolution of the main sub-detectors, the systematics uncertainties are kept under the statistical error level. The experimental procedure, the analysis technique and the main systematics are discussed to present the final result
This result based on more than events, correspondig to one half of the whole two year data taking, is about an order of magnitude more precise with respect to the previous measurement.
1 Introduction
In spite of the fact that more than 40 years have passed since the discovery of the CP violation , the full understanding of this phenomenon is still far to be reached. After the discovery of direct CP violation in the neutral kaon decay into two pions in the first part of the 90s, by the NA31 experiment , and the clear confirmation after few years, by NA48 and KTEV , the only other environment in which this effect was detected is the neutral B system . On the other hand, the study of the tiny effects due to the violation of this symmetry in all the systems where it’s possible, represents an important window on the contribution of new physics beyond the Standard Model (SM). In fact new effects could appear in a relevant way in the heavy quark loops which are at the core of the mechanism allowing CP violation in the decay. In the kaon sector the most promising places, besides , where this kind of contributions could play some role are the rates of GIM suppressed rare decays and the charge asymmetry between charged kaons. In particular in this asymmetry could give a strong qualitative indication of the validity of the CKM description of the direct CP violation or the existence of possible sources outside of this paradigm. Quantitative tests or predictions are, at the moment, very difficult from a theoretical point of view due to the complexity of the calculation involving non-perturbative hadronic effects. As soon as the intense theoretical efforts to improve the understanding of this sector of the particle interactions will produce tools to make reliable predictions, the experimental measurements could also be used as strong quantitative test.
From an experimental point of view, the easiest way to look for any possible differences between and decay into three pions is to compare the shape of the Dalitz plot distribution instead of the decay rates. Exploiting the small Q value of the decay it’s possible to use a polynomial expansion of the matrix element bbbDue to the strong interaction process this simple parametrization isn’t fully adequate to describe the matrix element . Nevertheless this expansion is adopted here for the CP violation measurement.:
| (1) |
where g,h,k are called linear and quadratic slope parameters and where the Lorentz invariant Dalitz plot parameters u and v are related to the energy () of “odd” and “even” pion (i.e. the unpaired pion and the same sign two pions, respectively) in the center of mass, through the definition:
| (2) |
where , being and the kaon and the pions (with and for the “odd” pion) four-momenta, , and , the kaon and charged pion mass, respectively. The present value for the linear slope cccThe linear slope for the v variable is forbidden for symmetry reasons. appearing in (1) are, for the two possible decay mode:
| (3) |
and (). A difference between and , the linear slopes in the and decay, represents a signal of direct CP violation. This can be formalized defining the CP violating parameter as:
| (4) |
where and is the average between and . In the SM framework the prediction of the value is very difficult due to hadronic effects contribution, but all the calculations are in the range between and few , both in the neutral (the ) and in the charged (the ) decay mode. Calculations involving models beyond the SM allow for an enhancement up to the level of few . Several experiments in the past have searched for the asymmetry in “neutral” and “charged” mode as summarized in tab.1 .
| Asymmetry | # of events | Experiment |
|---|---|---|
| 115K | CERN PS(1975) | |
| 620K | Protvino IHEP (2005) | |
| 3.2M | BNL AGS (1970) | |
| 54M | HyperCP (2000) prelim. |
The sensitivity reached so far is at level of few , dominated by the systematic uncertainties. The main goal of the NA48/2 experiment is to reach the sensitivity of both in “neutral” and in “charged” mode, covering the gap existing between the experimental results and the “beyond the SM” theory predictions.
The NA48/2 experiment (basically an upgrade of the NA48 experiment, devoted to the direct CP violation measurement in the system) will be briefly described, the analysis of the charged asymmetry in will be discussed and the final result, based on about a half of the whole NA48/2 data sample, will be presented.
2 NA48/2: beam line and experimental apparatus
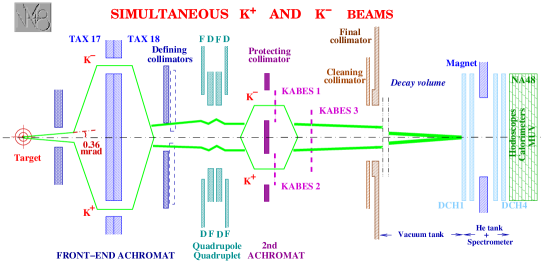
A novel high intensity beam line was designed in order to allow for the simultaneous collections of and decays. The possibility to collect at the same time, with the same detector, the decay of both charges, represents a fundamental point in the reduction of the systematic error. The beam transport line is schematically sketched in fig.1. The hadron beam, of both charges, is produced by the SPS 400 GeV/c protons ( protons per pulse) impinging on a 40 cm long and 2 mm diameter beryllium target with an angle of zero degrees. A magnetic device, called first achromat, selects the momentum of the beam in the range GeV/c, splitting the two charges. After being recombined the beams are focused by a quadruplet of quadrupoles. The second achromat system houses a spectrometer for the beam, called KABES , to measure the particles’ momentum with a resolution of , useful in particular for rare decays studies. The beam, recombined again along the beam axis, contains particles per 4.8 s spill (about 12 times more pions than kaons) with kaon charge ratio , which is irrelevant for the measurement . In the 114 m long decay region the two beams, both 5 mm wide (RMS) are superimposed at level of 1 mm. The central detector is based on the old NA48 detector described elsewhere . The spectrometer magnet was operated in order to give and the resolution in momentum (GeV/c) is . The LKr electromagnetic calorimeter is employed to detect the photons from decay with an energy resolution (GeV) of . Thanks to these performances the resolution on the reconstructed kaon mass is good enough ( in the “neutral” mode, in the “charged” mode) for a precise calibration of the detector instabilities.
A two level trigger is employed to reduce the rate of data collected. A hardware level trigger (L1) using informations from the fast hodoscope counter and from a dedicated LKr read out system is followed by a L2 section based on processors for fast reconstruction of kinematical quantities. In particular for the online selection, the missing mass of the charged pion is required to be far from the mass, in order to reduce the contribution of the more frequent decay. The final trigger rate is 10 KHz.
3 Strategy of the measurement
The method to extract ( for the “neutral” mode) is based on the comparison between the u projections of the Dalitz plot distribution. The ratio between the two distributions is well described by:
| (5) |
The presence of magnetic fields both in the beam sector (achromat) and in the detector (spectrometer magnet) introduces an intrinsic charge dependent acceptance of the apparatus. In order to equalize this asymmetry the main magnetic field are frequently reversed during the data taking (the spectrometer magnet on a daily basis, while the achromat system on a weekly basis). For each achromat polarity, it’s possible to define two ratios in which the same side (the two sides are called Jura (J) and Saleve (S)) of the spectrometer is involved:
| (6) |
In each of these ratios the acceptance asymmetry due to the spectrometer is cancelled. The full cancellation of the detector asymmetry is obtained exploiting the quadruple ratio:
| (7) |
where U and D stands for the path followed by the in the achromat (up and down) and is an inessential normalization constant. This method is independent from the relative size of the four samples collected with different fields configuration and from the and flux difference. The method allows for the cancellation of:
-
•
local detector bias (left-right asymmetry), thanks to the fact that each single ratio in (7), is defined in the same side of the detector;
-
•
beam local biases, because in each single ratio the path of the particle through the achromat is the same;
-
•
global time variation biases, because the decays from both charges are collected at the same time.
The result remains sensitive only to the time variation of the detector with a characteristic time smaller than the inversion period of the magnetic field. In fact each of the ratios employed in the (7) is constructed using data of subsequent days. Other systematic biases induced by effects not cancelled by the alternation of the magnetic field (for instance the Earth’s magnetic field and any misalignment of the spectrometer) have to be carefully corrected.
The intrinsic cancellations of the acceptance asymmetries in the quadruple-ratio allow to avoid the use of simulation input for the measurement. Nevertheless a GEANT3 based MonteCarlo, including the time variation of beam and detectors, is used for systematic studies and as a cross-check of the result.
4 Data Analysis in mode
The reconstruction of the event in the “neutral” mode exploits the LKr and the spectrometer. In the preselection phase the tracks and the photons are selected according to quality criteria. The fiducial region of the detectors is chosen to avoid edge effects or miscalibrated regions. In particular the spectrometer’s inner radial cut is chosen according to the actual beam position, whose displacement during the run is measured by three-track events. The decay vertex is recostructed from the impact positions on the LKr, for each , by using the relation:
| (8) |
Among all the possible pairings, the two pairs with minimum vertex difference are selected and the final decay vertex is obtained as the arithmetic average of the two vertices. The kaon invariant mass is used to select the charged pion and to identify a good , by requiring . The measurement of the charged pion momentum, slightly biased by variable DCH misalignment, is corrected by exploiting the condition in the reconstruction of the mode. The same decay mode is used to follow the variation of the absolute value of the spectrometer magnetic field after each periodical inversion, monitored online only at level of . The position of the photons impact point is corrected to take into account the projective geometry of the calorimeter. These effects gives, after the correction, a negligible contribution to the systematics error.
A potential source of systematic bias is the trigger. This was studied directly from the data with downscaled sample of control triggers, uncorrelated with the main trigger. In the “neutral” mode the L1 trigger level is essentially composed by a coincidence of a signal in the scintillating hodoscope (Q1) and a pattern compatible with 4 photons on the LKr (NTPEAK). The Q1 efficiency is obtained by using all the events with one track in the charged hodoscope, re-weighted according to the distribution of the events. The inefficiency () is constant during the run and the upper limit of the systematic error on given by this part of the trigger is .
The largest systematic uncertainty () comes from the neutral part of the L1. The NTPEAK inefficiency is different at the beginning () and at the end () of the data taking. The estimation of this systematics is limited by the statistics of the control sample. The L2 inefficiency ( on average during the run) is mostly () due to the DCH wires inefficiencies and was studied by using MonteCarlo simulation, including the detailed time variation of the spectrometer’s behaviour. The systematic error assigned to is , including also other effects like data buffer overflows, algorithm inefficiency and synchronization effects in the trigger chain. All the sources of systematics are summarized in table 4 .
| Systematic effect | Effect on |
|---|---|
| U calculation & fitting | |
| LKr non linearity | |
| Shower overlapping | |
| Pion decay | |
| Spectrometer Alignment & Momentum scale | |
| Beam Geometry | |
| Accidentals | |
| L1 Trigger: Q1 | |
| L1 Trigger: NTPEAK | (stat.) |
| L2 Trigger | |
| Total systematic uncertainty | |
| Trigger statistical uncertainty |
During the 2003 data taking (one half of the whole statistics) and decays in the “neutral” mode have been selected for the asymmetry measurement presented in this paper. The final result in terms of (related to through (4) ) , obtained as average of three independent analyses that agree within few , is:
| (9) |
where the external error depends on the uncertainties on the value of () . This result, fully compatible with the SM predictions, is almost one order of magnitude better than the previous measurement by other experiments , . The ongoing analysis of the 2004 sample will improve the statistical error of a factor of , with a similar reduction in the systematic error.
5 Result in charged mode
An analogous analysis in the “charged” mode using decays, from the 2003 sample, gives the result :
| (10) |
The statistical precision is similar with respect to the result given in (9) because, even though the “neutral” mode is statistically disfavored due to lower branching ratio and acceptance, the population density of the Dalitz plot is more favourable and . A preliminary study on the combined 2003 and 2004 data ( events) leads to a compatible result :
| (11) |
References
References
- [1] J. H. Christenson et al. Phys. Rev. Lett. 13, 138 (1964)
- [2] G. Barr et al. (NA31), Phys. Lett. B 317, 233 (1993)
-
[3]
A. Lai et al (NA48), Eur, Phys. J. C 22, 231 (2001)
J. R. Batley et al. (NA48), Phys. Lett. B 544, 97 (2002) - [4] A. Alavi-Harati et al. (KTeV) Phys. Rev. D 67, 012005 (2003), Erratum: Phys. Rev. D 70, 079904 (2004)
-
[5]
K. Abe et al. (Belle), Phys. Rev. Lett. 93, 021601 (2004)
B. Aubert et al. (Babar), Phys. Rev. Lett. 93, 131801 (2004) - [6] G. D’Ambrosio and G. Isidori, Phys. Lett. B 530 (2002) 108 [arXiv:hep-ph/0112135].
- [7] J. R. Batley et al. [NA48/2 Collaboration], Phys. Lett. B 633 (2006) 173 [arXiv:hep-ex/0511056].
- [8] S. Eidelman et al. (PDG) Phys. Lett. B 592,1 (2004)
-
[9]
L. Maiani and N. Paver,”The Second DANE Physics Handbook”,INFN, LNF, Vol 1.(1995) 51
A. A. Belkov, A. V. Lanyov, G. Bohm, A. Schaale and D. Ebert, Nucl. Phys. Proc. Suppl. 16 (1990) 367.
A. A. Belkov, G. Bohm, A. V. Lanyov and A. Schaale, arXiv:hep-ph/9309329.
G. Faldt and E. Shabalin, arXiv:hep-ph/0503241.
E. Gamiz, J. Prades and I. Scimemi, arXiv:hep-ph/0410150.
-
[10]
G. D’Ambrosio, G. Isidori and G. Martinelli,
Phys. Lett. B 480 (2000) 164
[arXiv:hep-ph/9911522].
E. Shabalin, ITEP-8-98 - [11] K. M. Smith et al., Nucl. Phys. B 60 (1973) 411.
- [12] G. A. Akopdzhanov et al., Eur. Phys. J. C 40 (2005) 343 [arXiv:hep-ex/0406008].
- [13] W. T. Ford, P. A. Piroue, R. S. Remmel, A. J. S. Smith and P. A. Souder, Phys. Rev. Lett. 25 (1970) 1370.
- [14] W. S. Choong, Ph.D. thesis, Berkeley (2000) LBNL-47014
- [15] R. Batley et al., CERN-SPSC-2000-003
- [16] B. Peyaud, Nucl. Instrum. Meth. A 535 (2004) 247.
- [17] V. Fanti et al. (NA48) Phys. Lett. B 465, 335 (1999)
- [18] GEANT Description and Simulation Tool, CERN Program Library Long Writeup W5013, (1994)
- [19] J. R. Batley [NA48/2 Collaboration], Phys. Lett. B 634 (2006) 474 [arXiv:hep-ex/0602014].
- [20] E. Goudzovski arXiv:hep-ex/0604002