Measurement of Direct Photon Emission in the
Decay Mode
M. Arenton13
A.R. Barker6,∗∗
L. Bellantoni8
A. Bellavance10
E. Blucher5
G.J. Bock8
E. Cheu1
R. Coleman8
M.D. Corcoran10
G. Corti13
B. Cox13
A.R. Erwin14
C.O. Escobar4
A. Glazov5
A. Golossanov13
R.A. Gomes4
P. Gouffon12
K. Hanagaki9
Y.B. Hsiung8
H. Huang6
D.A. Jensen8
R. Kessler5
K. Kotera9
A. Ledovskoy13
P.L. McBride8
E. Monnier5,∗
K.S. Nelson13
H. Nguyen8
R. Niclasen6
D.G. Phillips II13
H. Ping
14
V. Prasad5
X.R. Qi8
E.J. Ramberg8
R.E. Ray8
M. Ronquest13,†
E. Santos12
J. Shields13
W. Slater2
D. Smith13
N. Solomey5
E.C. Swallow5,7
P.A. Toale6
R. Tschirhart8
C. Velissaris14
Y.W. Wah5
J. Wang1
H.B. White8
J. Whitmore8
M. Wilking6
B. Winstein5
R. Winston5
E.T. Worcester5
M. Worcester5
T. Yamanaka9
E.D. Zimmerman6
R.F. Zukanovich12 (KTeV Collaboration)
1University of Arizona, Tucson, Arizona 85721
2University of California at Los Angeles, Los Angeles, California 90095
3University of California at San Diego, La Jolla, California 92093
4Universidade Estadual de Campinas, Campinas, Brazil 13083-970
5The Enrico Fermi Institute, The University of Chicago, Chicago, Illinois
60637
6University of Colorado, Boulder, Colorado 80309
7Elmhurst College, Elmhurst, Illinois 60126
8Fermi National Accelerator Laboratory, Batavia, Illinois 60510
9Osaka University, Toyonaka, Osaka 560 Japan
10Rice University, Houston, Texas 77005
11Rutgers University, Piscataway, New Jersey 08855
12Universidade de Sao Paulo, Sao Paulo, Brazil 05315-970
13The Dept. of Physics and Institute of Nuclear and Particle
Physics, University of Virginia, Charlottesville, Virginia 22901
14University of Wisconsin, Madison, Wisconsin 53706
The study of the direct photon emission in
decays gives insight into both the structure of the kaon and the sources
of CP violation in this mode. This decay proceeds via two main
processes [1, 2]. The
first of these is the inner bremsstrahlung process (IB) in which one of the
charged pions from a CP violating decay emits
an E1 electric dipole photon by bremsstrahlung. The second process is
the emission of a CP violating E1 electric dipole photon or a CP
conserving M1 magnetic dipole photon together with the pair
directly from the primary decay vertex. The photons produced by the
IB process have a typical bremsstrahlung spectrum with in the
center of mass peaking toward zero and falling off like ,
while the direct photon emission produces an energy spectrum peaked toward
larger . The M1 amplitude is expected to require a
form factor
according to chiral perturbation theory [4] in order to incorporate
the effects of the structure of the on photons emitted at the primary
decay vertex (as opposed to the photons of the bremsstrahlung process emitted
from the charged pions). In this form factor and are
the mass squared of the (770 MeV/c2) and K (497 MeV/c2) mesons..
The KTeV collaboration previously reported a measurement [3] using 8669
candidate decays accumulated in the
1996 KTeV E832 run at Fermi National Accelerator Laboratory which indicated
clearly the presence of the M1 process and the need for the associated form
factor. In addition, the presence of M1 photon emission and the need for a
form factor have also been demonstrated by the KTeV E799 experiment [5, 6] and
NA48 [7] measurement of the
mode. While this mode differs from the since the
photon is virtual converting internally to a Dalitz pair in the
decay, both modes have the same amplitudes
contributing except for the presence of an extra “charge radius” amplitude in the
decay. Thus we expect the same
amplitude and associated form factor to be present in the
decay. This has been demonstrated by the
measurements detailed in Refs [5, 6, 7].
Values of , its form factor, and the ratio
DE/(DE+IB) presented in this paper were determined by using the much larger,
complete KTeV E832 1997 data set
containing candidate decays.
We have analyzed the decay mode using the
double differential decay rate
(2)
from the model of Ref. [8]. In this expression,
is the angle of the photon with respect to the
in the center of mass system, is the photon energy in
the rest frame, and
(3)
(4)
(5)
where and are
the isospin = 0,1 strong interaction
phase shifts evaluated at the kaon mass and at the particular
mass of a given decay.
is the amplitude for the CP
violating decay.
Note that there is no interference
term between the E1 and M1 amplitudes. However,
there can still be an interference term in the differential decay rate
between the and amplitudes. The interference
will generate a contribution to
the energy spectrum intermediate in energy between the lower energy
bremsstrahlung photons and the higher energy M1 photons.
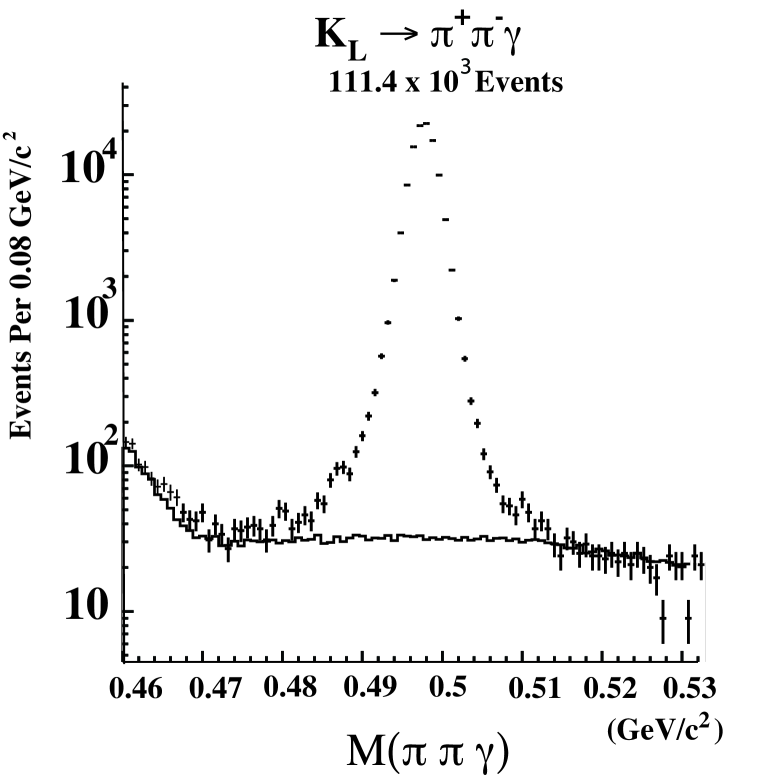
The signal of events
above a background of 671 41 events, obtained after the analysis cuts
described below, is shown in Fig. 1. Details of the detector
and beam can be found in Ref. [10] so we only give a brief
overview here. A proton beam with a typical intensity of delivered
in a 20 second spill every minute was incident at an angle of 4.8 mr on a BeO target
producing two nearly parallel beams, one of which intercepted a
regenerator and the other of which remained a “vacuum” beam.
The data for the measurement were obtained from
the “vacuum” beam decays. The configuration of
the KTeV E832 vacuum beam and detector consisted of a vacuum decay
tube, a magnetic spectrometer with four drift chambers, photon vetoes, a
Cesium Iodide (CsI) electromagnetic calorimeter, and a muon detector.
Approximately events were extracted from two track
triggers [10] by requiring that the two tracks to pass track
quality cuts and form a vertex with a good vertex .
These tracks were also required to have opposite charges and ,
where E was the energy deposited by the track in the CsI,
and p was the momentum obtained from magnetic deflection. Showers chosen as
photons are required to be far from pion showers and to have a transverse shower shape
consistent with electromagnetic showers. Only photons
with 20 MeV in the rest frame were
included in this analysis.
To reduce backgrounds arising from other types of decays in
which decay products have been missed, the candidate ’s
were required to have transverse momentum relative to the
direction of the be less than and
, the invariant mass of the system,
to be .
FIG. 1.: invariant mass
for events passing all physics cuts except
for the cut.
Crosses are data and the solid line is the fit to the background components
The major background to the mode was
due to an accidental calorimeter cluster in coincidence with a
decay
in which the muon was misidentified as a pion. This background was suppressed
by the muon detector identification as well as the and
cuts. A smaller background was
due to decays
in which there was an accidental photon, and the electron was misidentified as
a pion. This background was suppressed by electron E/p identification
and and cuts. The
spectrum shapes due to the and backgrounds were similar.
A still smaller background to the mode was
in which one of the photons from the
decay was not detected in the CsI calorimeter or the photon vetos. To reduce
the background, the longitudinal momentum
of all candidate events
was calculated (under the assumption that the events were really
) in the frame where the
momentum was transverse to the direction. In this frame, is (except
for resolution effects) for decays. In
contrast, the decays should have
. The requirement ,
together with the and mass cut, suppressed the
background.
Hyperon decays such as plus an
accidental photon with the proton misidentified as a , or
with a misidentified
proton and one of the photons missed, were
determined to contribute a few events. Other sources of background
such as coincident with
an accidental photon or produced
in the neutral beam production target were completely negligible.
The magnitude of the remnant background after all cuts
was determined by a fit (see Fig. 1) of the sideband regions
above and below the mass peak to shapes obtained from a Monte Carlo of
the backgrounds leading to an estimated total background of
events. The best estimate of the composition of this background is 9%
, 30% ,
60% , and the remainder due to the other
minor backgrounds mentioned above. The candidate events,
including the estimated 671 events of background, were analyzed
in a likelihood fit based on equations 1 and 2. The likelihood was a function
of the two independent variables and , the values of the fit parameters
/, and and nominal values from
the PDG [11] for the other model parameters such as .
The strong interaction phase shifts of the system are
taken from Ref. [12]. The likelihood was calculated using a
Monte Carlo event sample generated with nominal values of the
fit parameters, traced through the spectrometer undergoing multiple
scattering, bremsstrahlung, and secondary decays. The resulting events are
then reconstructed using the same reconstruction
code as was used on data. These reconstructed Monte Carlo events are then reweighted
with a new set of fit parameters using the
matrix element of Ref. [8] and a likelihood is calculate for the new
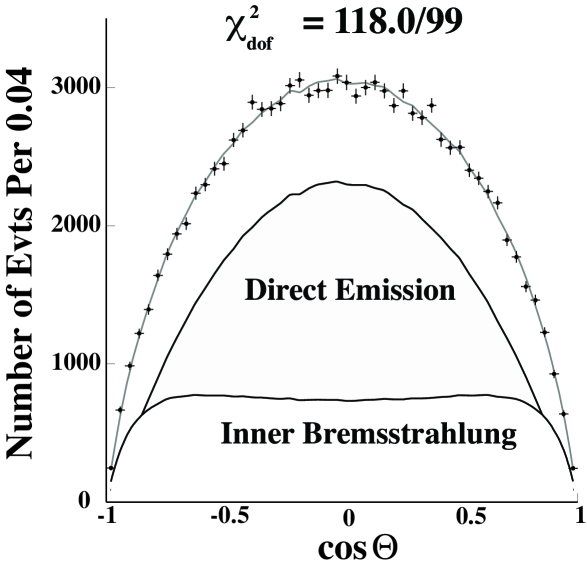
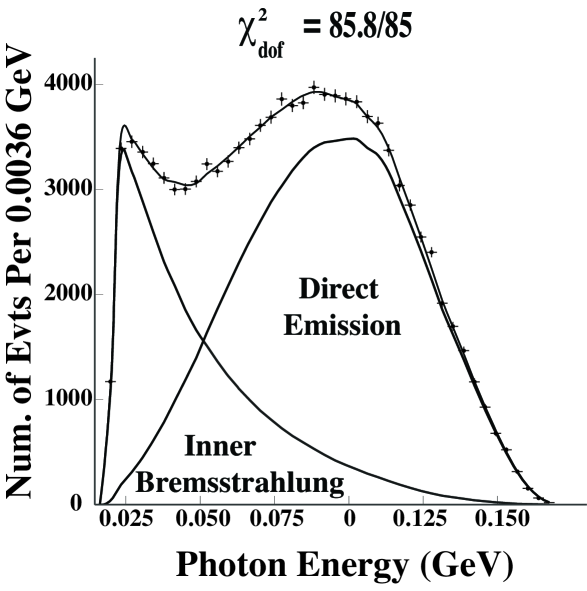
parameters. The maximum likelihood fits to the two
independent variables cos and
are shown in Fig. 2a) and Fig.2b) respectively.
Possible systematic uncertainties in /, and due
to disagreements between data and Monte Carlo simulations were investigated
by varying analysis cuts and observing variations in these fit parameters.
In addition, the momentum spectrum of the
system observed in the decays
has been adjusted to agree with the momentum spectrum observed in
mode and the data has been refit after the
adjustment. Any differences between /,
and before and after the final adjustments were taken to be
a systematic error due to uncertainty in the kaon beam momentum spectrum.
Systematics due to uncertainties of parameters such as , and the
strong interaction phase shifts that were not determined by
the fit were studied by varying
each parameter over of their published values and observing
the variation of /, , and .
Bremsstrahlung radiation from the pions was studied using the PHOTOS
program [13]. This radiation could lead to
final states in which one of the photons is not observed causing shifts of the
kinematics of the original decay.
Possible systematic effects due to the non-orthogonality of drift chamber
planes were also studied. Final overall systematic
errors in /, , and were obtained by adding
the individual errors in quadrature. Table I lists the non-zero
systematic uncertainties of / and , and .
FIG. 2.: Likelihood fit to the two independent variables in the rest frame:
a) the angle between the and the in the center of
mass and b) the photon energy spectrum in the rest frame.
The components of the photon energy spectrum and the cos spectrum due
to the bremsstrahlung and M1 direct emission processes are shown.
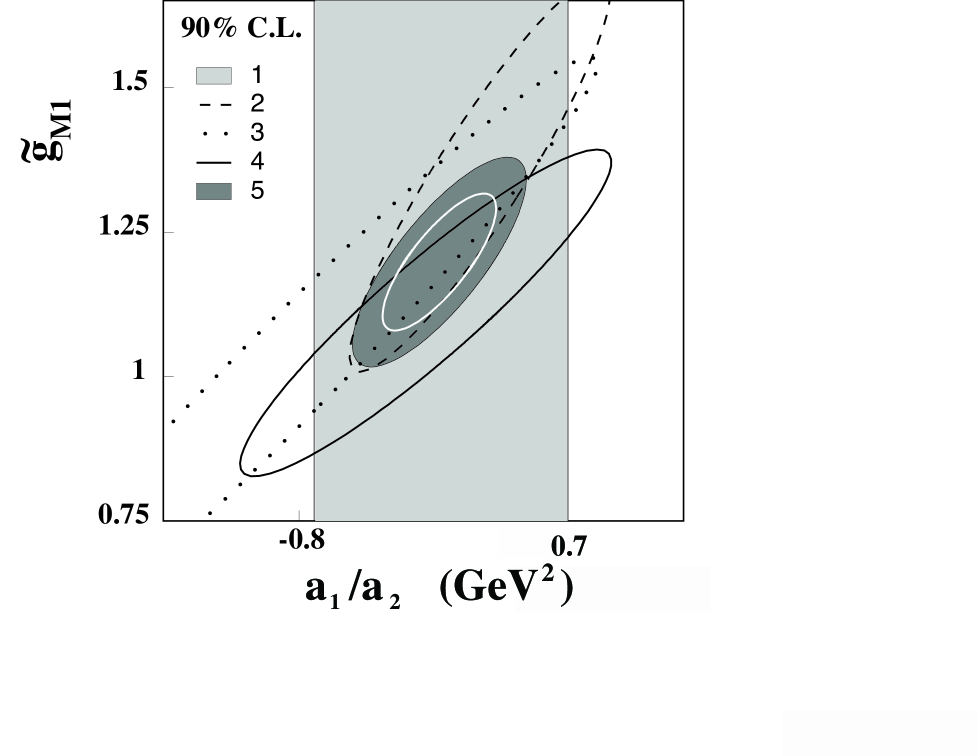
The results, including systematic errors of the measurement of the
M1 direct photon emission amplitude and
the attendant vector form factor, are and
. These measurements are in good agreement with
the measurements of Ref. [3, 5, 6, 7] (see
Fig. 3). After incorporating the systematic errors, an upper limit of
(90% CL) was obtained.
Using the result for and its associated form factor and
taking to be equal to zero, the ratio of direct to total
photon emission in decay was determined
by integrating the M1 and bremsstrahlung processes over and
(for 20 MeV) to be DE/(DE+IB)= .
This result is in good agreement with Ref. [3].
FIG. 3.: 90% CL contours of vs. for
various experimental measurements; 90% CL results from
the mode from this paper (5-shaded
contour) with the 68% CL contour also shown (white contour);
For comparison, we show the results from the mode
for NA48 data (3-dotted contour) of Ref. [7],
for KTeV 1997 data (2-dashed contour) in Ref. [5],
and for KTeV 1997+1999 data (4-solid contour) of Ref. [6],
and for from earlier KTeV 96
data (1-light gray vertical region) of Ref. [3].
In conclusion, this paper presents the best measurements achieved to
date for the M1 direct photon emission form factor parameters
and
in the
and decay modes. These measurements
are in good agreement with our previous measurement of using the 1996 KTeV
data [3] and with our
measurements of and using the 1997 and 1999
KTeV data [5, 6] and with
NA48 results [7] from
. We have also determined an upper
limit (90%CL) for CP violating E1 direct photon emission in the
mode consistent with that measured
using decays [6].
We thank the FNAL staff for their contributions. This work was supported
by the U.S. Department of Energy, the U.S. National Science Foundation,
the Ministry of Education and Science of Japan, the Fundao de Ampaaro
Pesquisa do Estado de So Paulo-FAPESP, the Conselho Nacional de
Desenvolvimento Cientifico e Technologico-CNPq, and the CAPES-Ministerio da Educao.
† To whom correspondence should be addressed.
Electronic address: ronquest@uvahep.phys.virginia.edu
∗ Permanent address C.P.P. Marseille/C.N.R.S., France
∗∗ Deceased
REFERENCES
[1] L.M. Sehgal and M. Wanninger, Phys. Rev. D46,
1035(1992); ibid.D46, 5209(E)(1992).
[2] P. Heiliger and L.M. Sehgal, Phys. Rev. D48,
4146(1993).
[3] A. Avati-Harati et al.,Phys. Rev. Lett. 86,
761(2001).
[4] Y.C.R. Lin and G. Valencia, Phys. Rev. D37, 143(1988).
[5] A. Avati-Harati et al., Phys. Rev. Lett. 84,
408(2000).
[6] E. Abouzaid et al., hep-ex/05080010.
[7] A. Lai et al. Eur. Phys. Jou. C30, 33(2003).
[8] L.M. Sehgal and J. van Leusen, Phys. Rev. Lett. 83,
4933(1999).
[9] J.K. Elwood, M.B. Wise, and M.J. Savage, Phys. Rev. D52,
5095(1995); J.K. Elwood et al., ibid., D53,
2855(E)(1996); J.K. Elwood et al., ibid., D53,
4078(1996).
[10] A. Avati-Harati et al., Phys. Rev. D67,
012005(2003); ibid.D70, 079904(2004).
[11] S. Eidelman et al., Phys. Lett. B592,
010001(2004).
[12] S. Pislak et al., Phys. Rev. Lett. 87,
221801(2001).
[13] E. Barberio and Z. Was, Comput. Phys. Commun. 79, 291(1994).
Source
Differing initial MC parameters
0.0093
0.0021
0.013
Kaon Beam Momentum Uncertainty
0.0031
0.0004
0.005
Background uncertainty
0.0355
0.0067
0.045
Pion bremsstrahlung
0.0326
0.0140
0.097
Non-Orthogonality of chambers
0.0402
0.0013
0.009
Physics cut variations
0.0463
0.0056
-
Fitting resolution
0.014
0.0056
0.024
,cos resolution
0.023
0.0042
0.038
uncertainty
0.0171
0.0014
-
phase uncertainty
0.0111
0.0021
-
phase uncertainty
0.0053
-
-
Total Systematic Error
0.086
0.018
0.117
TABLE I.: Contributions to the systematic errors (67% CL) for /, , and
.