Measuring cosmogenic 9Li background in a reactor neutrino experiment
Abstract
Cosmogenic isotopes 9Li and 8He produced in the detector are the most problematic background in the reactor neutrino experiments designed to determine precisely the neutrino mixing angle . The average time interval of cosmic-ray muons in the detector is often on the order of the lifetimes of the 9Li and 8He isotopes. We have developed a method for determining this kind of background from the distribution of time since last muon for muon rate up to about 20 Hz when the background-to-signal ratio is small, on the order of a few percents.
keywords:
Neutrino oscillation , 9Li , ReactorPACS:
14.60.Pq , 02.70.Uu , 28.60.Hw, , , , ,
1 Introduction
Recently new experiments are proposed to determine the neutrino mixing angle using reactor anti-neutrinos with sensitivity in sin on the order of 0.01 [1], about a factor of ten better than the current limit [2]. Comparing to the past reactor neutrino experiments [2, 3, 4], the systematic error of the proposed experiments will be greatly reduced by carrying a relative measurement with detectors located at two different baselines to cancel the reactor-related errors, and other improvements to the detectors for reducing the detector systematic errors. However, the cosmogenic 9Li and 8He background will remain an irreducible systematic uncertainty in the measurement.
The proposed reactor neutrino experiments detect the anti-neutrinos via the inverse -decay reaction with liquid scintillator. The inverse -decay process is the interaction of an electron anti-neutrino with a proton (hydrogen) resulting in the production of a positron and a neutron. A neutrino event is identified by the coincidence of the energy deposited by the positron (1 MeV to 8 MeV) followed by the energy released from neutron capture. Although the proposed experiments will be carried out underground, a nontrivial number of cosmic-ray muons can still pass through the hermetically shielded detectors. Some of these cosmic muons interact with the carbon nuclei in the liquid scintillator to produce unstable isotopes. Among them, 9Li and 8He have -neutron cascade decay modes, with branching fraction of 49.5% and %, respectively. The -decay of 9Li and 8He has a Q value of 13.6 MeV and 10.7 MeV, respectively, which overlaps with the positron signal of the neutrino events. The beta particle can thus mimic the prompt signal of a neutrino event while the neutron provides the delayed signal. Hence the cosmogenic 9Li and 8He isotopes are indistinguishable from the neutrino events. Since these two isotopes are relatively long-lived, with a half-life of 0.178 s for 9Li [5] and 0.119 s for 8He [6], they are difficult to reject with a muon veto.
Production of 8He and 9Li has been measured with 190 GeV muons on a liquid-scintillator target at CERN [7]. Since their lifetimes are so close it is hard to determine their individual cross sections. The cross section is measured to be , and the energy dependence of the cross section is suggested to be , with . In the KamLAND experiment, about 85% of the isotopes are found to be produced by inelastic scattering of energetic muons [4, 8]. From the time distribution and the -energy spectrum of the -neutron events, the contribution of 8He relative to 9Li is less than 15% at the 90% confidence level. Furthermore, the 8He contribution could be determined by tagging the cascade 8He Li Be decay sequence [9]. Hence, for simplicity, we assume that the cosmogenic isotope background is solely 9Li in our investigation.
While KamLAND can measure the 9Li background well from the time distribution of the -neutron event since last muon, it is not necessarily true for other experiments with less overburden. The average overburden of the KamLAND detector is 2700 m.w.e. (meter-water-equivalent), resulting in a muon flux of 0.0015 Hz/m2, or 0.2 Hz of cosmic-ray muons in the active volume of the detector. This implies the mean time interval of two adjacent muons is 5 s, much longer than the lifetime of 9Li. For most reactor experiments proposed to measure , the overburden ranges from about 300 to 1 200 m.w.e. [1]. The muon rate can be as high as 20 Hz, resulting a mean time interval of muons significantly shorter than the lifetime of 9Li. However, we find that it is still possible to determine the 9Li content since the anti-neutrino rate and the 9Li rate are significantly lower than the muon rate. The probability of having two -neutron events (either neutrino or 9Li candidates here) in the time window used in the analysis is negligible. Thus the muons immediately following neutrino candidates can simply be ignored. In this paper, we show that it is possible to measure the 9Li and 8He background in-situ even when the cosmic-ray muon rate, comparing to the isotope lifetime, is relatively high.
2 Method of Least Squares
Suppose the muons are randomly distributed in time. The time interval of two adjacent muons follows a normalized exponential function
| (1) |
where the constant is the mean time interval between two adjacent muons, , with being the muon rate. The neutrino events are also randomly distributed and independent of the muons. The time interval between a neutrino event and the last muon preceding it obeys the same exponential distribution, but with a different constant , where is the neutrino rate. The neutrino rate is normally several orders lower than the muon rate. The difference in and can thus be ignored. Therefore, we have . Here, the variable is the time of the neutrino event since the last muon.
The 9Li events are correlated with the muons. If the muon rate is high, a 9Li event might be the product of any of the preceding muons. When summed over the contributions of all preceding muons, the probability density function (p.d.f.) of the 9Li events in terms of the time since last muon is
| (2) | |||||
where s is the lifetime of 9Li, and is the time interval of two adjacent preceding muons. The first term corresponds to the contribution from the last muon. The second term is that from the second-to-the-last muon, and so on. Because the time since last muon is , the time interval between the two muons immediately before and after a 9Li event must be greater than . This condition has a probability of . Therefore the p.d.f. of the time since last muon for the 9Li events becomes
| (3) |
In a reactor neutrino experiment, the observed distribution of the time since last muon for all -neutron events is a combination of the distribution of the genuine neutrino events and that of the 9Li events. As a result, the observed distribution can be described by
| (4) |
where and are number of 9Li and neutrino events, respectively. The background-to-signal ratio is simply . The amount of the 9Li background can then be measured by minimizing the function which is a sum of the squares of the residuals of the observed time distribution divided in bins from the expectation given by Eq. 4.
3 Method of Maximum Likelihood
In the least-squares method, contributions of all preceding muons are included in the p.d.f. and expressed as a function of the time since last muon. Similarly, an unbinned maximum-likelihood fit can be performed with the same p.d.f.. The log-likelihood function (MLa) is thus defined as
| (5) |
where is the time of the -th -neutron event since last muon. Here we assume that each -neutron event has a probability of being a 9Li event and to be a neutrino candidate. To precisely determine , it is desirable to have the background-to-signal ratio as small as possible. In this case, can be taken as such a ratio.
Alternatively, the maximum-likelihood method can exploit the contributions to a -neutron event from each preceding muons, instead of averaging them into the time distribution since last muon. When the muon rate is not too high but contributions from the preceding muons other than the last one cannot be ignored, we can construct a log-likelihood function (ML) as
| (6) |
where sums over all -neutron events in the sample and sums over all preceding muons of the -th -neutron event. Here is the time of the -th -neutron event since last muon, and is its time since the -th preceding muon. As in the least-squares method, the term is included in the probability density function of the 9Li to account for the condition that there is no muon between the -neutron event and the last muon. In practice, only muons in a finite time window are included. This truncation will lead to an error in the probability on the order of for a two-second window.
The statistical error of the parameter in the fit can be estimated for the maximum-likelihood method when the sample size is very large. In this case, the variance of the parameter is given by [10]
| (7) |
where is the density function, is the expectation of the parameter , is the sample space, and denotes the mathematical expectation in the sample space. For the MLa given in Eq. 5, the variance is
| (8) |
If , which is the case for most reactor neutrino experiments, the above integral can be simplified. The statistical error of is approximated to be
| (9) |
where is the total event number of -neutron events. It is interesting to note that the error is independent of . When the muon rate is high, as expected, the error gets worse.
4 Monte Carlo Simulation
To validate the formulation, we have simulated data samples of a reactor neutrino experiment, with neutrino, muon, and 9Li events taken into account. For each sample, two independent data sets are first generated, one contains neutrino events, and the other contains muons and 9Li events. The neutrino events are generated randomly in time. For a given muon rate , the number of muons is determined. Muons are then generated randomly in time. The probability of producing the 9Li isotope by each muon is calculated with a Poisson distribution based on the production cross section measured at 190 GeV. If a 9Li is created, its decay time is generated according to an exponential function using the 9Li lifetime. Neither the energies of the 9Li and neutrinos nor the muon-energy dependence of the yield of 9Li is taken into account here. The two independent data sets are then combined and sorted by time to form the -neutron sample for analysis.
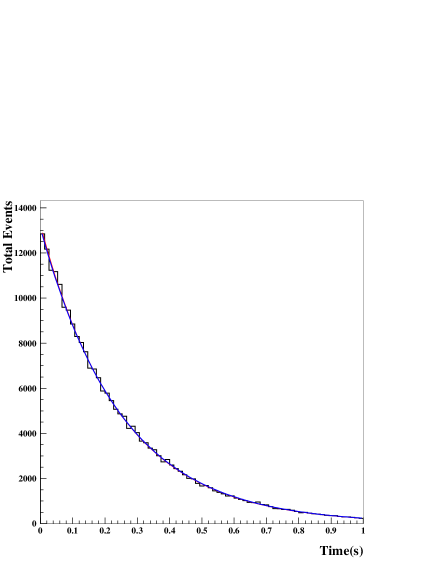
The distribution of the time since last muon for all the -neutron events in a Monte Carlo sample with an input muon rate of 4 Hz and a value of 0.01 for B/S is shown in Fig. 1. The red curve is the best fit of Eq. 4 to the distribution, whereas the blue curve is a fit with B fixed to 0 and S as a fit parameter. Since the amount of 9Li background is small, the two curves are almost identical.
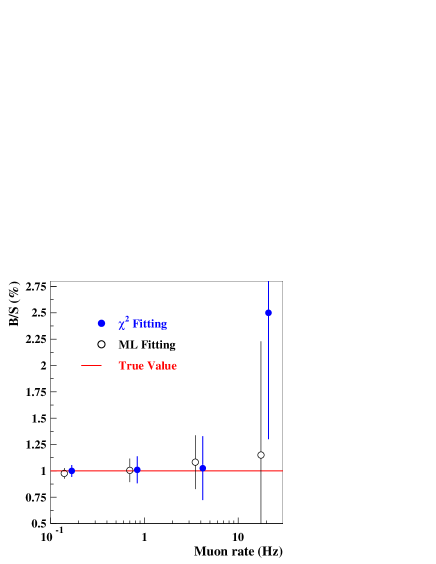
The results obtained with the least-squares and maximum-likelihood (ML) methods are shown in Fig. 2. For each given muon rate, the background-to-signal ratio, B/S, is fixed at 1% since the statistical error is independent of it (see Eq. 9). In addition, 400 samples are generated and analyzed for each given muon rate to investigate the potential bias and precision of the fit. It is clear from Fig. 2 that both the least-squares and maximum-likelihood methods can determine the background-to-signal ratio reliably up to a muon rate of about 20 Hz.
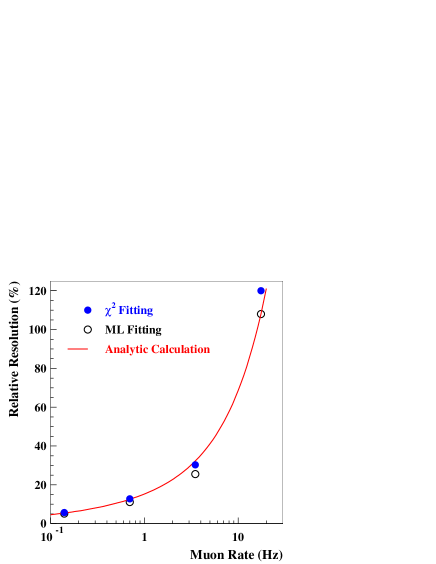
Along with the analytical estimation of Eq. 9, the relative resolution of B/S obtained with the least-squares and maximum-likelihood fits as a function of the muon rate are shown in Fig. 3. Here the relative resolution is defined as the statistical error (standard deviation) obtained from the fit normalized to the input value of 1% for the B/S ratio. The results from the two fitting methods are in excellent agreement with the analytical calculation.
5 Conclusions
We have shown that, as long as the occurrence of (anti-)neutrino events and 9Li decays is low comparing with the 9Li lifetime, it is possible to measure in-situ the cosmogenic 9Li background for a reactor neutrino experiment with relatively high muon rate. The muons immediately following a -neutron event can be safely ignored because they have very small probability to be associated with another -neutron event. We have obtained probability density functions that can be utilized for determining the amount of 9Li background using the least-squares or maximum-likelihood fit, with the latter method having a slightly better precision. When the background-to-signal ratio is small such that , the precision of the in-situ measurement can be estimated with a simple formula in Eq. 9, which depends on the muon rate and the number of -neutron events in the sample.
6 Acknowledgements
Y.F.W. was supported by grants from the National Science Funds for Distinguished Young Scholars (10225524). K.B.L. was grateful for the hospitality of IHEP during sabbatical visit, and was partially supported by the US Department of Energy’s Office of Science.
References
- [1] For example, see Y. Wang, Recent results of non-accelerator-based neutrino experiments, Proceedings of ICHEP 2004, vol. 1, 188. [hep-ex/0411028]. K. Luk, Determining using nuclear reactors, ibid, 204.
- [2] M. Apollonio et al., Eur. Phys. J. C27 (2003), 331.
- [3] F. Boehm et al., Phys. Rev. D62 (2000), 072002.
- [4] K. Eguchi et al., Phys. Rev. Lett. 90 (2003), 021802; T. Araki et al., ibid, 94 (2005), 081801.
- [5] Booth et al., Nucl. Phys. A119 (1968) 233; Abramov et al., Sov. J. Nucl. Phys. 23 (1976) 636.
- [6] F. Ajenberg-Selove, Nucl. Phys. A490 (1988) 1.
- [7] T. Hagner et al., Astro. Phys. 14 (2000), 33.
- [8] K. S. McKinny, Ph.D. thesis (unpublished), University of Alabama, 2003.
- [9] F. Ardellier et al., hep-ex/0405032.
- [10] For example, see John A. Rice, Mathematical Statistics and Data Analysis (second edition), Wadsworth Publishing Co. Inc. (1993).