The KLOE Collaboration
Precise measurement of with the KLOE detector at DAΦNE
Abstract
Using a sample of over 400 million decays produced during the years 2001 and 2002 at the DAΦNE collider, the ratio has been measured with the KLOE detector. The result is , which is in good agreement with the previously published result based on the KLOE data sample from the year 2000. The average of the KLOE results is , reducing the total error by a factor of three, to .
pacs:
13.25.Es, 14.40.AqI Introduction
The ratio = / is a fundamental parameter of the meson. Since the sum of the branching ratios (BR’s) for the two dominant decays of the short-lived neutral kaon differs from unity by just , the measurement of provides the BR’s for and with only small corrections. The latter BR is a convenient normalization for the BR’s of all other decays to charged particles. In particular, it is used to obtain , which is of interest in testing many predictions of the Standard Model, as discussed in LABEL:\cite[citep]{\@@bibref{AuthorsPhrase1Year}{missing}{\@@citephrase{,_}}{}}plbpennew. From one can also derive phenomenological parameters of the kaon system such as the relative magnitude and phase of the and -scattering amplitudes. Isospin-breaking effects and radiative corrections to the scattering amplitudes are discussed in Refs. Cirigliano et al., 2000, 2004. Finally, enters into the double ratio that quantifies direct violation in transitions:
| (1) |
where = /. The most accurate measurement of to date was performed by KLOE using data collected in 2000 for an integrated luminosity of 17: KLOE Collaboration, A. Aloisio et al. (2002). This result, which was more precise than the PDG average at the time Groom et al. (2000), for the first time properly included photon radiation and increased the PDG value for by 0.5% S. Eidelman, et al., Particle Data Group (2004). The overall accuracy of the previous result, 0.7%, was limited by systematic uncertainties. The present result is based on the analysis of 410 of integrated luminosity acquired during the years 2001 and 2002, and improves on the total error by a factor of three, to .
The paper is organized as follows. In the next section, a brief description of the KLOE detector is given. In Section III, the selection criteria for the decays of interest are summarized. In Section IV, a general description of the scheme used to evaluate the efficiency corrections is given, followed by a detailed discussion on the tagging efficiencies, acceptances, and trigger efficiencies. The result of the analysis is presented in Section V.
II Experimental setup
The data were collected with the KLOE detector at DAΦNE, the Frascati factory. DAΦNE is an collider that operates at a center-of-mass energy of 1020 MeV, the mass of the meson. Positron and electron beams of equal energy collide at an angle of mrad, producing mesons with a small momentum in the horizontal plane: MeV. mesons decay 34% of the time into nearly collinear pairs. Because the kaon pair is in an antisymmetric state, so that the final state is always . The contamination from and final states is negligible for the purposes of this measurement Dunietz et al. (1987); Paver and Riazuddin (1990); Close et al. (1993). Therefore, the detection of a signals the presence of a of known momentum and direction, independently of its decay mode. This technique is called tagging in the following. A total of 1.3 billion mesons were produced, yielding 430 million pairs.
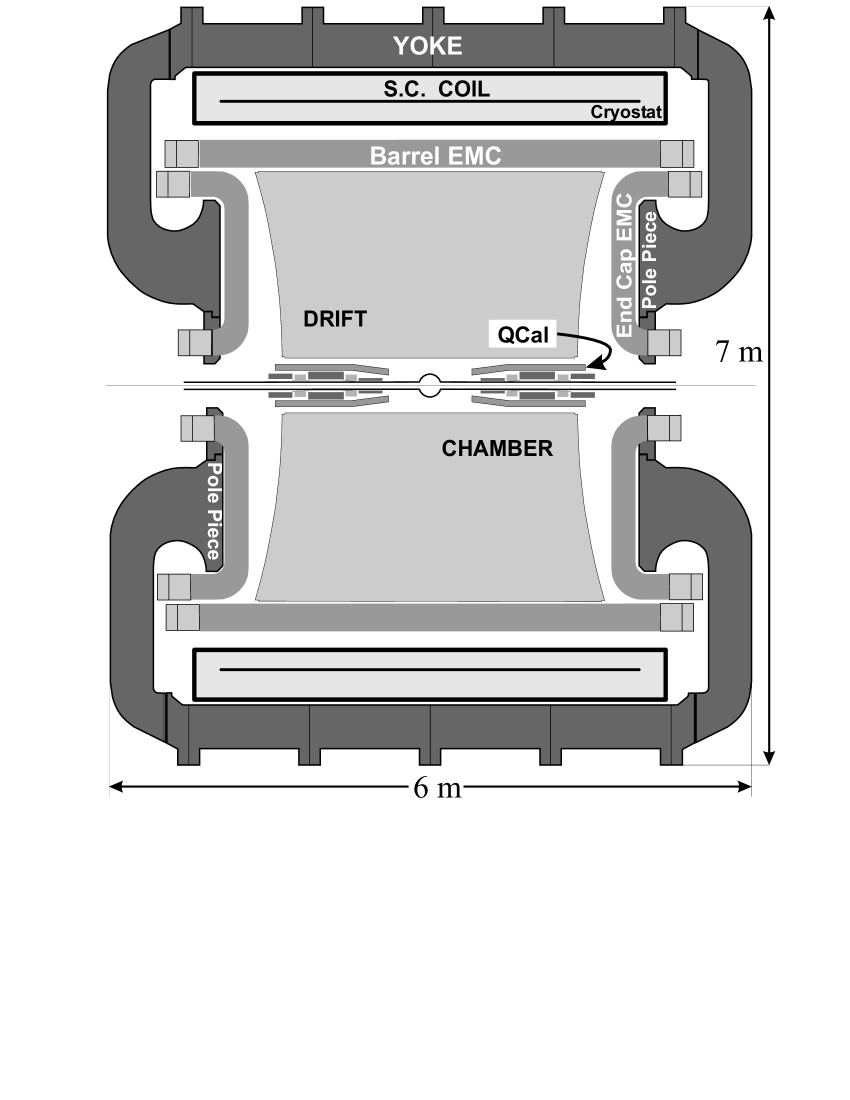
The KLOE detector (Fig. 1) consists of a large cylindrical drift chamber (DC) surrounded by a lead/scintillating-fiber sampling calorimeter (EMC). A superconducting coil surrounding the calorimeter provides a 0.52 T magnetic field. The drift chamber KLOE Collaboration, M. Adinolfi, et al. (2002a), which is 4 m in diameter and 3.3 m long, has 12,582 all-stereo tungsten sense wires and 37,746 aluminum field wires. The chamber shell is made of carbon-fiber/epoxy composite, and the gas used is a 90% helium, 10% isobutane mixture. These features maximize transparency to photons and reduce regeneration and multiple scattering. The DC position resolutions are and The momentum resolution is Vertices are reconstructed with a spatial resolution of The amount of material traversed before particles enter the DC volume affects the detection efficiency for decay products. Particles traverse the beam pipe and the inner DC wall, which are made of a 500 m-thick layer of Albemet alloy (60% Al-40% Be) and a 800 m-thick layer of carbon-fiber/epoxy composite aluminized on each side with a foil of 100 m. The total amount of material corresponds to and to an average conversion probability of for each photon from a decay. Moreover, assuming a disappearance (including absorption, charge exchange, and inelastic processes) cross section of 400 mb for with MeV interacting on carbon Navon et al. (1980), and using the same value for beryllium and aluminum, the average probability of disappearance for each pion emitted from a decay is .
The calorimeter KLOE Collaboration, M. Adinolfi, et al. (2002b) is divided into a barrel and two endcaps, contains a total of 88 modules, and covers 98% of the solid angle. The modules are read out at both ends by photomultiplier tubes. The arrival times of particles and the three-dimensional positions of the energy deposits are determined from the signals at the two ends. The readout granularity is ; the 2440 “cells” are arranged in five layers. Cells close in time and space are grouped into a “calorimeter cluster.” For each cluster, the energy is the sum of the cell energies, and the time and position are calculated as energy-weighted averages over the fired cells. The energy and time resolutions are and respectively.
Only the calorimeter trigger KLOE Collaboration, M. Adinolfi, et al. (2002c) is used for the present measurement. This requires two local energy deposits (trigger sectors) above a threshold of MeV in the barrel and MeV in the endcaps. Events with only two fired trigger sectors in the same endcap are rejected, because this topology is dominated by machine background. A single particle hitting the calorimeter barrel and releasing enough energy to fire two contiguous sectors generates a valid trigger.
Recognition and rejection of cosmic-ray events is also performed at the trigger level: events with two energy deposits above a 30 MeV threshold in the outermost calorimeter plane are rejected as cosmic-ray events. Moreover, to reject residual cosmic rays and machine background events an offline software filter (FILFO) exploits calorimeter and DC information before tracks are reconstructed KLOE Collaboration, F. Ambrosino et al. (2004).
The trigger has a large time spread with respect to the beam crossing time. However, it is synchronized with the machine RF divided by 4, with an accuracy of 50 ps. The time of the bunch crossing producing an event is determined offline during event reconstruction.
The response of the detector to the decays of interest and the various backgrounds were studied by using the KLOE Monte Carlo (MC) simulation program KLOE Collaboration, F. Ambrosino et al. (2004). Changes in the machine operation and background conditions are simulated on a run-by-run basis to improve agreement with data when averaged over the sample. The most important parameters are the beam energies and the crossing angle, which are obtained from the analysis of Bhabha scattering events with polar angles above 45 degrees. The average value of the center-of-mass energy is evaluated with a precision of 30 keV for each of integrated luminosity.
Particularly important for correct evaluation of the acceptance for and events is the rate of accidental clusters from the machine (). This is extracted from the analysis of events, where the low-energy and out-of-time hits due to machine background are easily separated from the two 510 MeV photon clusters.
For the present analysis, an MC sample of decays that corresponds to an integrated luminosity of 550 is used; for the other -meson final states, an MC sample equivalent to 90 of integrated luminosity has been used.
III Signal selection
The mean decay lengths of the and are and , respectively. About 50% of ’s therefore reach the calorimeter before decaying. The interaction in the calorimeter barrel ( crash, in the following) is identified by requiring a cluster of energy above a given threshold not associated with any track, and whose time corresponds to a velocity compatible with the kaon velocity in the center of mass, , after the residual motion is considered. Events with clusters with are selected. These events are used to tag a “beam” of known momentum. The trajectory is determined with an angular resolution of and the momentum is evaluated with a resolution better than 2 MeV from , where the momentum is calculated by using the values of the center-of-mass energy and of the momentum and the position of the cluster.
The interaction time, which must be known for the measurement of the cluster times, is obtained from the first particle reaching the calorimeter (pions or photons for the events of interest) assuming a velocity This definition of interaction time ( in the following) does not require the decay to be identified when applying the tagging algorithm. In order to reduce the probability that is accidentally determined from a particle due to machine background, the is required to be given by a cluster with energy MeV and distance to the beam line This is referred to as a “ cluster.”
events are selected by requiring the presence of two tracks of opposite charge with their point of closest approach to the origin inside a cylinder 4 cm in radius and 10 cm in length along the beam line. The tracks momenta and polar angles must satisfy the fiducial cuts MeV and The tracks must also reach the EMC without spiralling, and at least one of them must have an associated cluster.
events are identified by the prompt photon clusters from decays. A prompt photon cluster must satisfy being the energy-dependent time resolution, and must not be associated to any track. Machine background is reduced by cuts on the cluster energy and polar angle: MeV and To accept a event, three or more prompt photons are required.
The numbers of and events and the corresponding selection efficiencies are then used to compute :
| (2) |
where is the purity of the sample (the fraction of selected events that are signal), as evaluated from MC.
IV Efficiency evaluation
IV.1 General scheme
The fractional statistical error from the counting is ; the overall uncertainty is dominated by systematics. Therefore, in the analysis, great effort has been put into carefully estimating all possible systematic effects, as discussed in detail in LABEL:\cite[citep]{\@@bibref{AuthorsPhrase1Year}{missing}{\@@citephrase{,_}}{}}notappoonew.
The selection efficiency is expressed for each of the two channels (, ) as follows:
| (3) |
where is the joint efficiency for reconstructing both the tagging interaction and the decay; , , and are the efficiencies for the trigger, the cosmic-ray veto, and the offline background filter (FILFO). The tagging efficiency and the signal acceptance are correlated by the determination, and cannot be simply factorized, as discussed below.
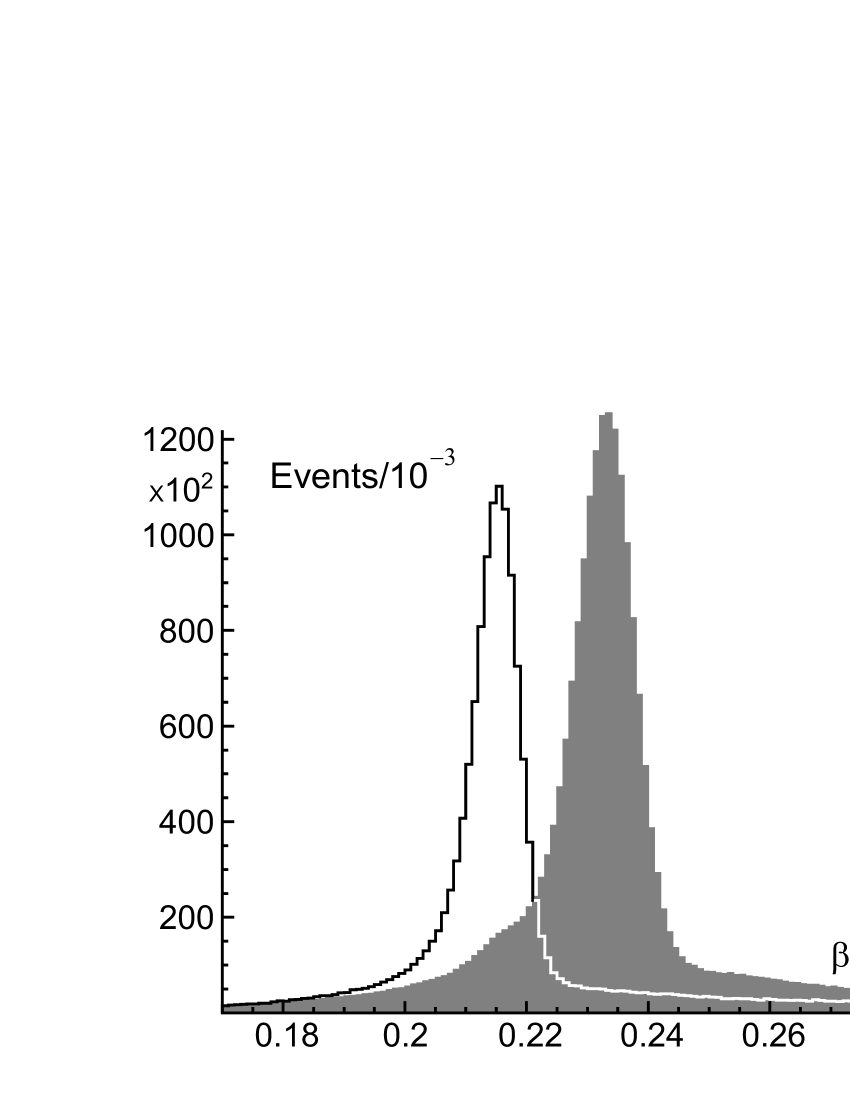
For essentially all of selected events, the corresponds to the true collision time: if this is not the case, the prompt photon cluster selection fails and the event is lost. For the purposes of selection, the velocity is therefore correctly evaluated (open histogram of Fig. 2). In contrast, for most events, the does not correspond to the true collision time. Most charged pions arrive at the EMC later than ’s from decays and the time is therefore delayed by one RF period, ; in a few percent of the cases, larger displacements are observed. This results in a 10% overestimation of the velocity and a difference in the tail populations (shaded histogram of Fig. 2). The displacement of the two distributions within the accepted region affects the tagging efficiency, which then differs for each of the two final states. In order to parametrize this effect, two classes of events are defined: events selected by the algorithm on the basis of the true value of the collision time are called , the rejected ones are non-. While all of events are , the net effect due to incorrect determination on the tagging efficiency for events is that a fraction of is lost, while a fraction of non- creeps into the selection (the fractions and are defined more precisely in Sec. IV.2).
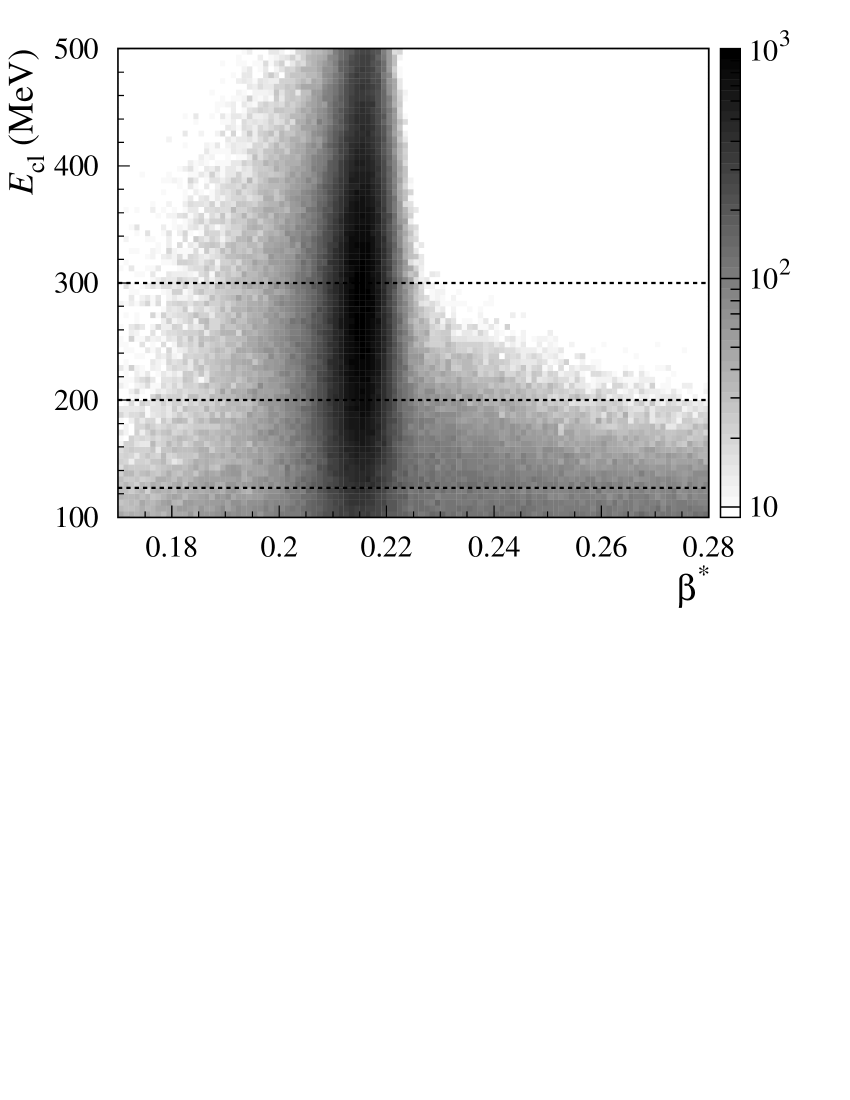
Furthermore, and non- events have different topologies: the first category is dominated by real interactions in the EMC, with lying around the peak; the second category is mostly due to in-flight decays before the EMC. These two topologies also correspond to different energy releases in the EMC, the latter topology being much softer than the former (Fig. 3).
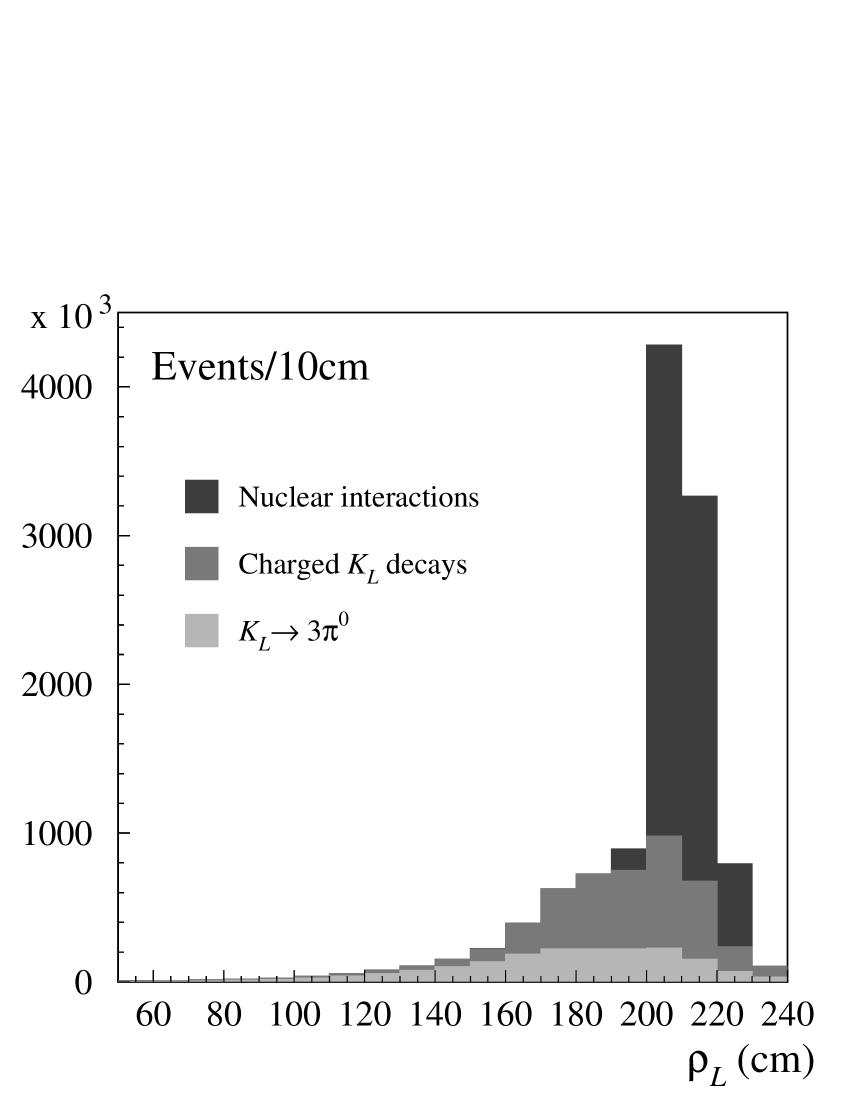
If the tag is selected using a low value for the minimum energy cut ( MeV), there is substantial contamination from in-flight decays occurring before the EMC. This is shown by the MC distribution of the transverse position () corresponding to the decay or interaction producing the cluster (Fig. 4). This contamination completely disappears when the cut is increased to 300 MeV.
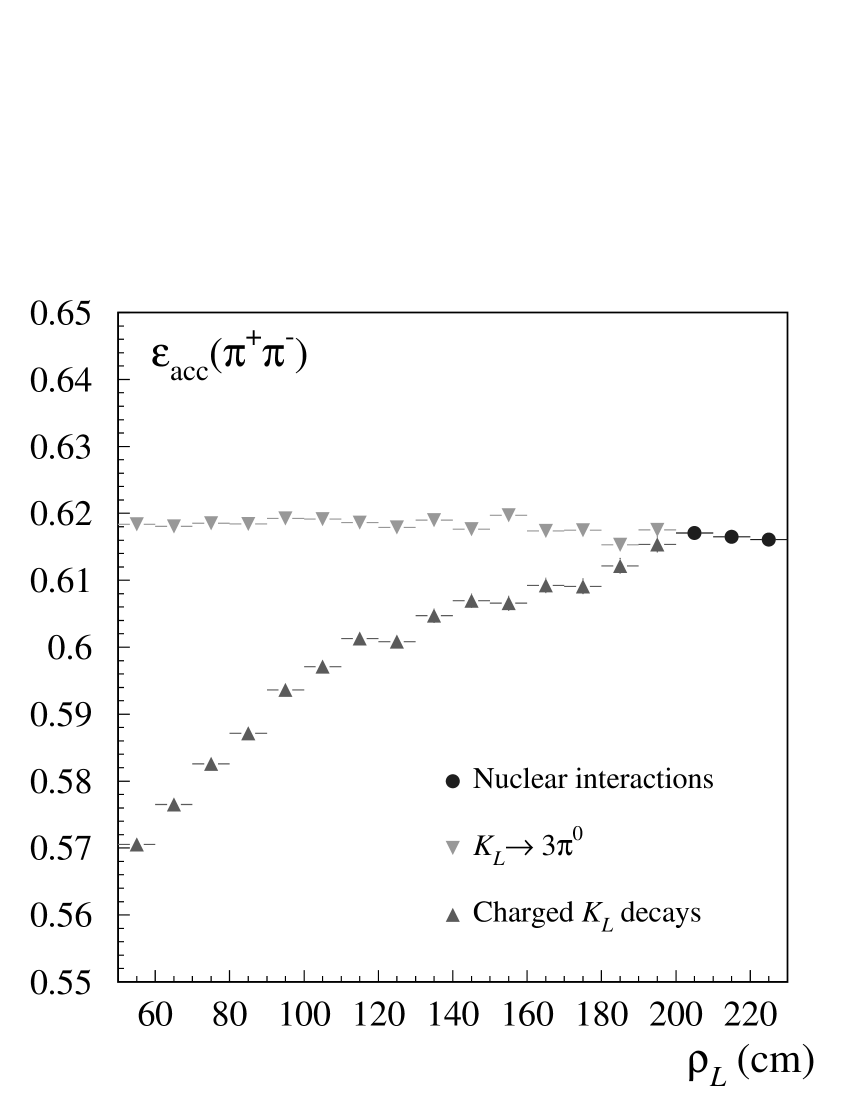
Due to interference between and decay products, which undermines reconstruction performance, the signal acceptance is a function of the decay mode and of the position (Fig. 5). Therefore, the signal acceptance for the events, which are dominated by interactions in the EMC, is a few percent higher than that for non- events, .
Finally, the selection efficiency of Eq. 3 is expressed by combining the acceptances with the probabilities and for having a or non- event, respectively:
| (4) |
The fractions and are evaluated using data control samples, while the efficiency is taken from MC (Sec. IV.2). The acceptances and are evaluated using the MC, with data-driven corrections as explained in Secs. IV.3 and IV.4 for and events, respectively. The efficiencies , , and are evaluated using data control samples as discussed in Sec. IV.5. All of the efficiencies in Eq. 4 are to be understood as conditional probabilities, with each defined relative to the sample from the previous step in the analysis, according to the order in which they are applied.
The analysis is carried out for three different cuts on the cluster energy: , 200, and 300 MeV. The tagging efficiencies are very different in each case: , 0.22, and 0.11, respectively. The fraction of in-flight decays entering the selection varies significantly as well. Moreover, some of the corrections applied and the related systematic uncertainties vary considerably with the cut value. This allows the robustness of the result to be tested.
The data were divided into 17 different samples following small changes in the machine energy. The large number of events allowed a statistical error at the few per-mil level to be obtained for each single data period. Comparison of the independent measurements from each data sample provides a stringent test of the validity of the corrections for possible variations in the selection efficiency during data taking. Results will be presented for each energy cut, averaging over all 17 samples. The final result is obtained by choosing the value of which minimizes the total error. Numerical details concerning all of the quantities involved in Eqs. 2 and 4 are given in the following sections for a representative sample (no. 10).
IV.2 Tagging efficiencies
This section concerns the evaluation of the quantities involved in the determination of the tagging efficiency: , , and .
The following parametrizations are used: , , where
-
•
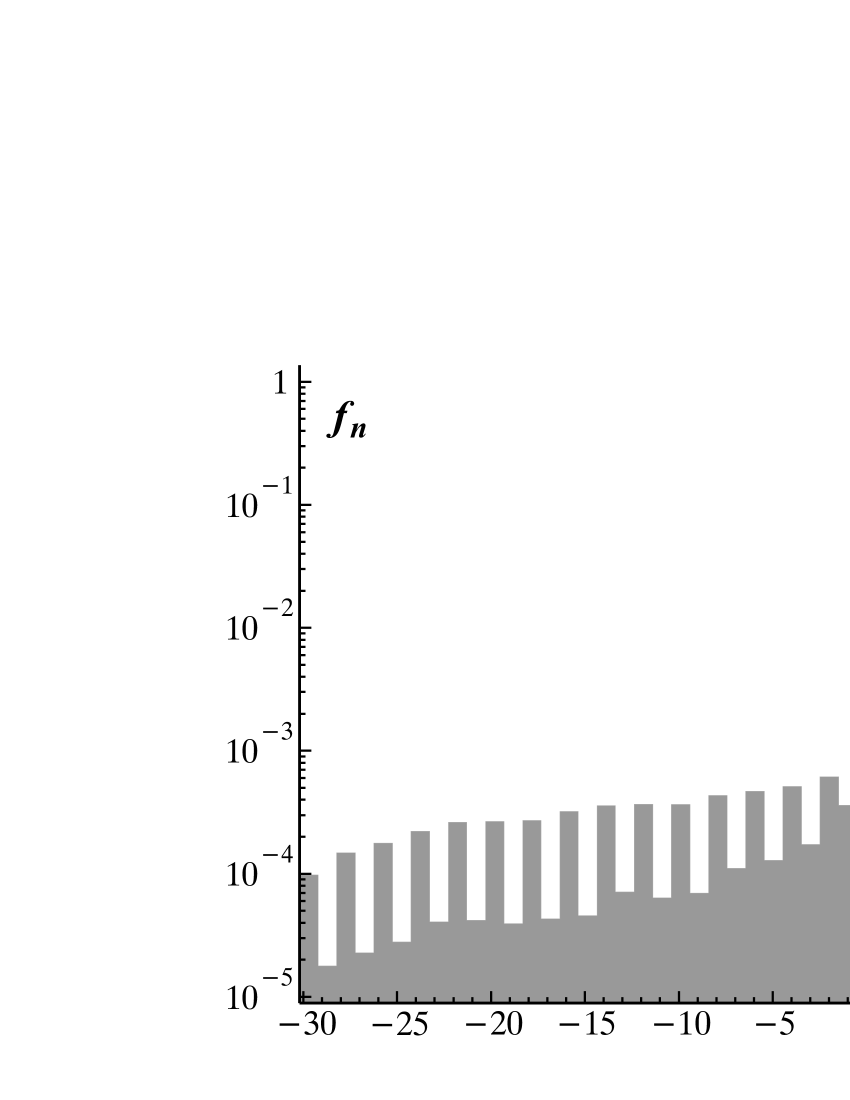
is the spectrum, i.e., the fraction of events in which is shifted by with respect to the true collision time ;
-
•
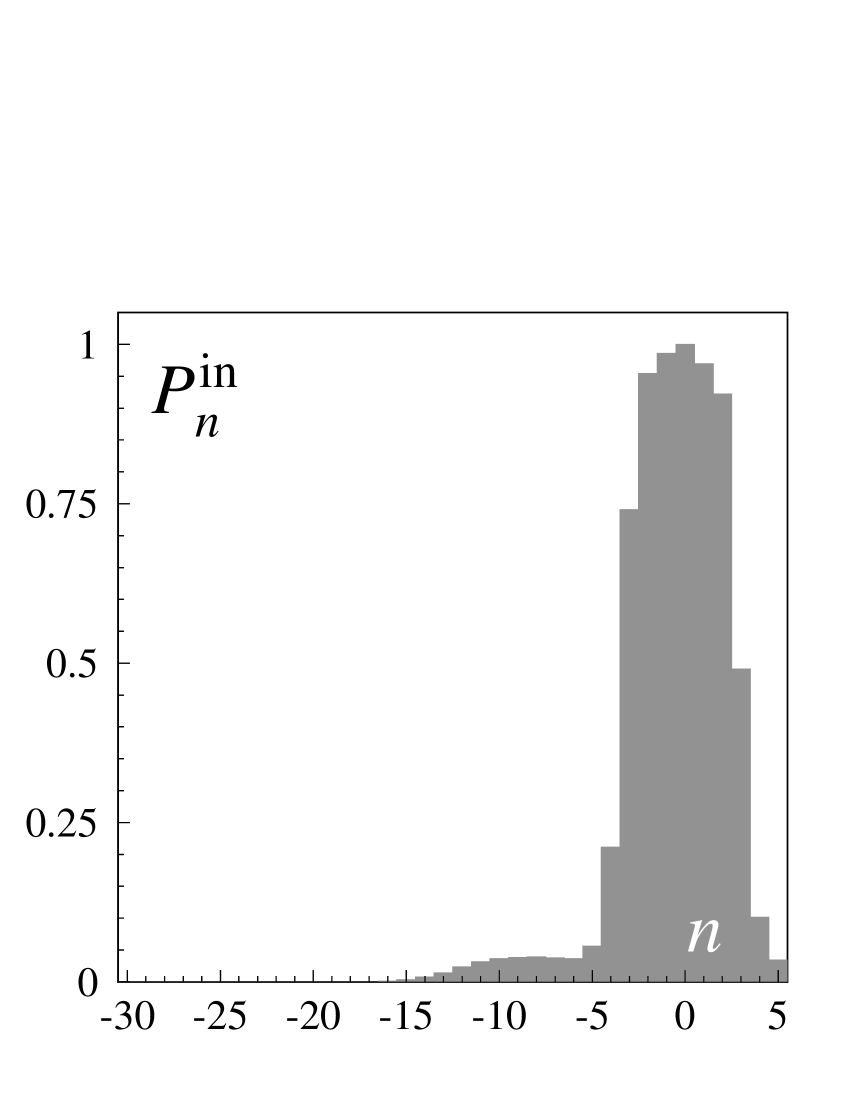
is the probability that, given a found event, the tag is again found even after the determination is shifted by ;
-
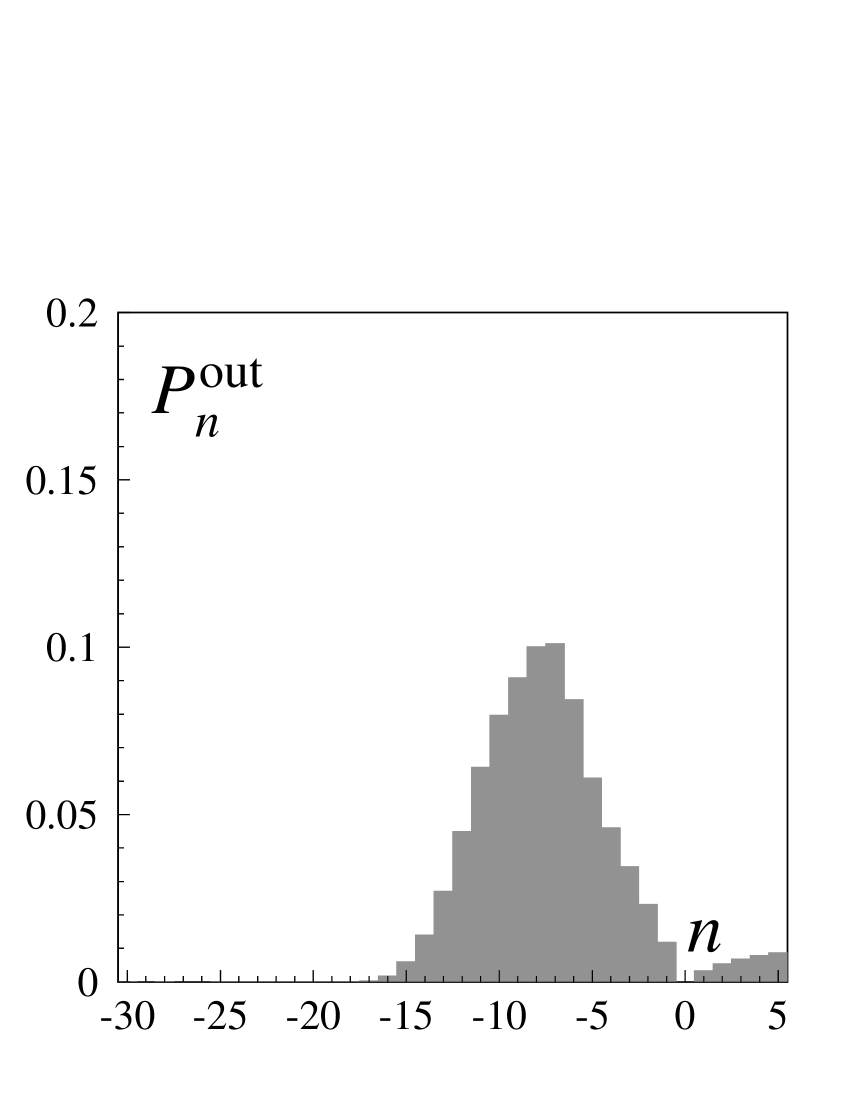
•
is the probability that, in the absence of a found event, a tag is newly found after the determination is shifted by .
All of these quantities are taken from data control samples.
The spectrum () is evaluated for both and events after the signal selection requests have been applied. For the charged mode, a subsample of events is selected in which both charged pions are associated to clusters. For each pion, an estimate of is obtained from the cluster time and the time of flight calculated from the track parameters. The robustness of this estimate is increased by requiring that both pions give the same result. The spectrum is obtained as the normalized distribution of (Fig. 6). As previously mentioned, overestimates the true collision time by one RF period 97% of the time. The negative tail of the spectrum shows peaks corresponding to the bunch-crossing times, and is dominated by events in which is determined by a cluster from machine background occurring at random with respect to the collision time.
For events the situation is much simpler, because the request of having at least three prompt clusters is fulfilled only if . Therefore is negligible for , and the values and are used.
For the charged mode, the probabilities and are needed for the evaluation of and . For this purpose, a sample of events selected on the basis of a reconstructed decay (without reference to the tag) is used. The estimate of the true collision time described above is used to divide these events into and non-. The value is then artificially shifted by with respect to . For events, the probability of still finding the is evaluated, as is the probability of finding a not originally present for non- events. The probabilities and are shown as a function of the shift in Fig. 7.
|
|
From the probabilities , , and the fractions and are calculated. The results for events are listed in Tab. 1. The value of increases with , reaching 99% for MeV. The tails of the spectrum are indeed suppressed by increasing the energy cut, as shown in Fig. 3. This reduces the acceptance losses due to incorrect determination. The maximal variation of during data taking is 1%.
Possible biases in the estimate of the spectra have been checked using the MC, by evaluating the ratio . Here, is evaluated from MC truth and is evaluated with the same method used for data. The above ratio is applied as a correction to the estimate of for data; the systematic error, taken as 100% of the correction, amounts to for MeV. Given the small value of , no correction is applied. A similar comparison with MC truth allows a systematic error of to be assigned to the assumption . The total systematic error from the evaluation of the spectra and of the probabilities , is at MeV (see Tab. 5).
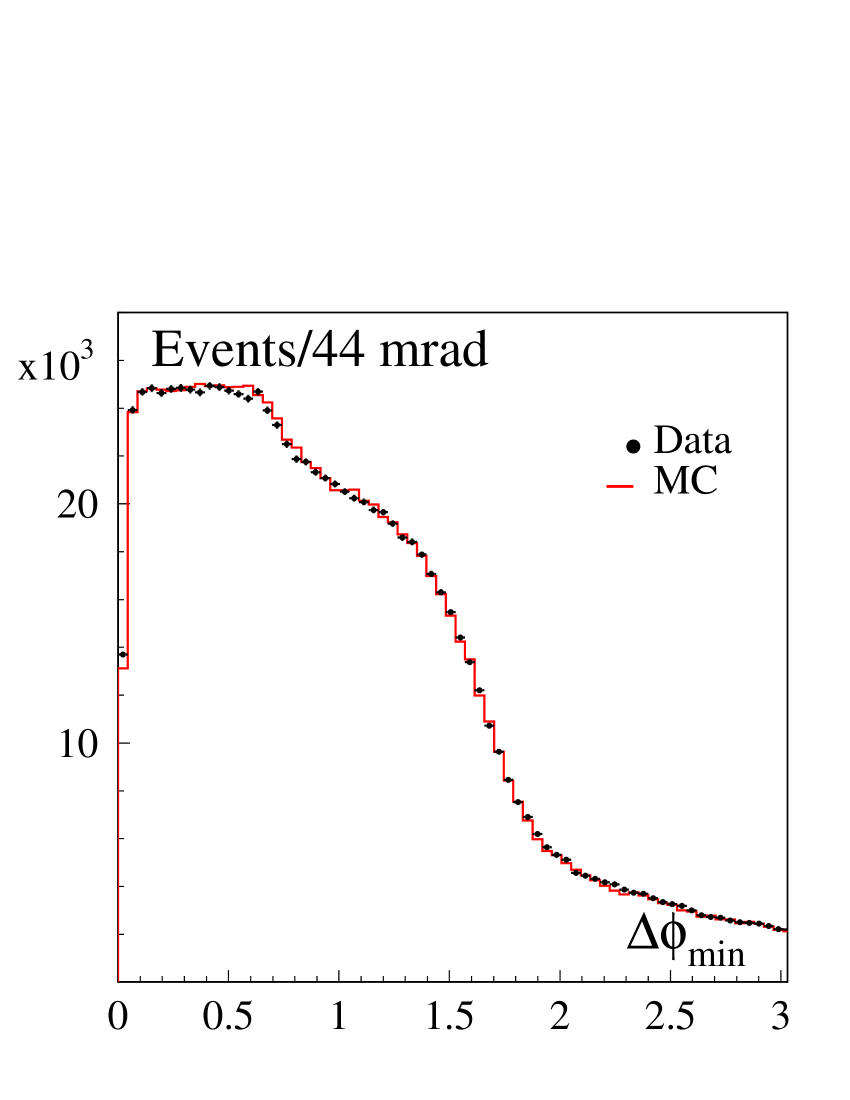
When computing the ratio between and selection efficiencies (see Eqs. 2 and 4) the values of the efficiencies and are needed; since and , the ratio of selection efficiencies depends on the ratio rather than on the values for each channel. This ratio varies with , ranging from 1.003 at MeV up to 1.014 at MeV (Tab. 1). This is due to the geometrical overlap in the EMC between daughter particles and the , which affects the reconstruction efficiency in a manner dependent on the decay channel. For events, the efficiency drops when the pions get closer to the because of the higher probability of associating the cluster to one pion track; for events, a drop is observed when a photon and the hit the same calorimeter cell, thus spoiling the cluster reconstruction. These effects have been studied using MC control samples of signal events in which at least one decay product reaches the EMC barrel. The effects are then visible in the dependence of on the minimum distance between the and the closest decay product on the barrel and in the dependence of on the minimum angular distance in the transverse plane (Fig. 8). Biases are present only when daughter particles enter the EMC close to the impact point.

|

|
The reliability of the MC in reproducing this overlap effect is checked by comparing data and MC distributions of and for events with a tag found (Fig. 9). The ratio of data and MC distributions is constant in the region safe from overlap effects. A significant discrepancy is only present for events when cm. The MC evaluation of is corrected by scaling the number of events found for small values according to the ratio measured for data. The systematic error, taken as 100% of the correction, amounts to for MeV (Tab. 5).

|
|
| value | 125 MeV | 200 MeV | 300 MeV | |
|---|---|---|---|---|
| 0.9634(1) | 0.9866(1) | 0.9933(1) | ||
| 3.4489(6) | 1.6675(1) | 0.71563(3) | ||
| 0.3106(2) | 0.2231(2) | 0.1082(2) | ||
| 0.3097(3) | 0.2217(3) | 0.1067(2) | ||
IV.3 Acceptance and purity for
The acceptance is evaluated from MC. Since no cut is applied on the invariant mass, the selection includes events with photon energies up to the end point (160 MeV in the rest frame). However, due to the fact that both pion tracks must extrapolate to the calorimeter without spiralling, the acceptance depends on the photon energy: the harder the photon in the final state, the higher the probability that one of the pion tracks spirals in the chamber before reaching the EMC. The MC simulation includes final-state radiation Gatti (2005). The acceptance obtained by MC is shown in Fig. 10 as a function of the photon energy in the rest frame.
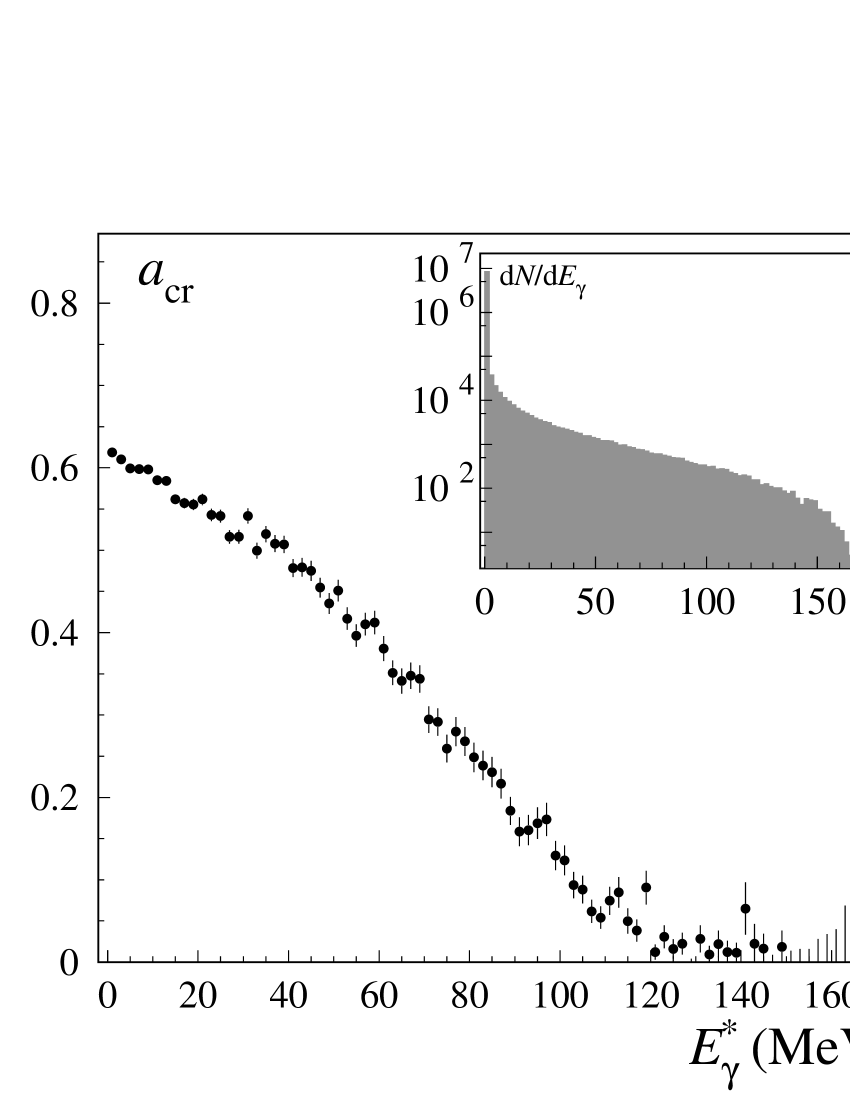
The simulated spectrum is also shown in the inset of Fig. 10. The fraction of events with and 50 MeV are and , respectively, in excellent agreement with the measured values and Ramberg et al. (1993). The MC calculation thus provides a fully inclusive acceptance, which is 0.3% lower than that obtained with a pure simulation.
A crucial issue when evaluating the acceptance is to correctly reproduce the DC tracking efficiency, including all possible variations correlated with the level of machine background and with the hardware performance of the apparatus. For this purpose, accidental background hits in the DC are extracted from real events and are overlaid with the simulated events; moreover, the measured hardware hit efficiency is used to sample the MC hit generation KLOE Collaboration, F. Ambrosino et al. (2004). To take into account residual differences in the tracking efficiencies for data and MC, the acceptance calculation is performed by weighting the contribution of each single pion with the ratio . The single-track efficiencies for data and MC are evaluated from a subsample of events tagged by a . Using the momentum as determined from and by the flight direction, it is indeed possible to identify the final state by selecting a single pion track (“tagging” track) with the expected momentum in the rest frame: MeV. This selection reduces background to a negligible level, while at the same time providing a good estimate of the momentum of the other pion: . The single-track efficiency is then obtained by counting the fraction of times in which a second pion track is found; it is evaluated in bins of transverse and longitudinal momenta, separately for each particle charge. This method takes into account not only differences in for data and MC, but also differences between the real and simulated nuclear interaction cross sections for the pions.
The MC calculation is also corrected for data-MC differences in the efficiency for a single pion with impact on the calorimeter to provide a cluster. This is evaluated using various data control samples (, ) as a function of the track momentum and the angle of incidence on the EMC, distinguishing between and tracks (or and tracks, in case of in-flight pion decays), and separately treating tracks reaching the barrel or the endcaps.
The values of and are listed in Tab. 2, together with the number of events selected as . The errors quoted on and are due to the statistics of the MC sample and of the control samples used for the efficiency determination. The maximal variation of the acceptance during data taking is 2%, and is due to variations in the machine operating conditions (background levels and center of mass energy). The acceptance is 3% lower than for all values of , because of the presence of ’s decaying into charged particles before reaching the EMC, which disturb the reconstruction of pion tracks as discussed in section IV.1. The value of increases by as the cut is moved from 125 to 300 MeV. This is due to the contamination from late decays in the sample (Fig. 4), which is suppressed when the energy cut is raised. The above variation is taken as a conservative estimate of the systematic error from the simulation of this - interference. A further contribution to the systematic error comes from the efficiency correction, ; it is estimated by MC as the difference between the result of the method described above and the MC truth. A non-zero difference is found and is ascribed to interference between the two decay products of the , which is not correctly taken into account by the above method. The difference is at MeV (Tab. 5). This value is both applied as a correction and taken as a conservative estimate of the systematic error.
The purity of the sample is estimated by MC to be 0.9989 and is independent of (see Tab. 2). Two sources contribute to the background contamination: decays to semileptonic final states () and decays (). Semileptonic decays are able to satisfy with high efficiency the loose kinematic criteria used to select events. Events with decays enter the selection when an early accidental cluster establishes and one of the two high-energy photons from the is erroneously selected as the . The systematic error on the purity comes from the uncertainty on the BR’s for the decays involved and, for the contribution, from the uncertainty on the rate . The error from these sources is at MeV (Tab. 5).
| value | 125 MeV | 200 MeV | 300 MeV |
|---|---|---|---|
| 1,218,000 | 907,400 | 490,900 | |
| 0.6187(5) | 0.6192(6) | 0.6195(8) | |
| 0.5968(5) | 0.5991(5) | 0.6016(5) | |
| 0.99882(4) | 0.99891(4) | 0.99886(6) |
IV.4 Acceptance and purity for
The acceptance is evaluated from MC. To take into account data-MC differences in the cluster efficiency for low-energy photons, the acceptance calculation is performed by weighting each photon with the ratio (data)/(MC). The single-photon detection efficiencies are evaluated from control samples of events, which are selected using DC information only: two tracks with opposite charge from the interaction point (IP) are required, with a missing four-momentum compatible with the mass hypothesis. A photon from decay is identified (“tagging” photon, ) as a cluster with time of flight and energy in an appropriate interval around the expected values. The energy is derived from the momentum and the position of the cluster for using the relation . The above selection provides a good estimate of the momentum of the second photon, . The photon efficiency is then obtained by counting the fraction of times in which the second photon is found in a cone around the expected direction. The result is evaluated in bins in the expected polar angle and energy; photons from events have a wider energy spectrum than that for events, so that the efficiency can be successfully evaluated up to the end point, .
The values of are listed in Tab. 3, together with the number of events selected as . The maximal variation in the acceptance during data taking is 1% and is due to variations in the machine background. The various sources of systematic uncertainty on the acceptance evaluation are discussed below.
A first contribution to the systematic uncertainty on the photon counting arises from uncertainty in the data-MC cluster-efficiency correction. This has been evaluated by varying the cut on the minimum cluster energy, , from the default value of 20 MeV to values between 7 and 50 MeV and checking the stability of the number of selected events after efficiency corrections, . When the cut is moved from 7 to 50 MeV, the acceptance decreases by 18%. The data-MC cluster efficiency correction is 0.9965 with the cut at 7 MeV, and is negligible with the cut at 50 MeV. The variation of normalized to is shown as a function of in Fig. 11.

The associated fractional systematic error is .
An additional systematic uncertainty in photon counting arises from a data-MC difference in the probability for a photon to produce more than one prompt cluster (“splitting”). If this occurs, an event with only two real prompt photons might be accepted as a three-prompt-photon event. The relative bias induced in the acceptance is proportional to the difference between data and MC splitting probabilities:
| (5) |
where () represents the number of events with () prompt photons. The splitting probabilities are evaluated for data and MC using events with a and five prompt clusters. In this sample, there is always either one split or one accidental cluster. The splitting probability is then evaluated as , where is the number of five-prompt events in which a pair of clusters closer than 80 cm is found. The results for data and MC are and . Given a ratio , the bias on the acceptance from Eq. 5 is ; this is taken both as a correction and as an estimate of the systematic uncertainty due to this effect.
Photons from have a probability of to convert to an pair before entering the DC volume. Moreover, there is a probability of that at least one undergoes a Dalitz decay S. Eidelman, et al., Particle Data Group (2004). These two categories of events produce at most three prompt clusters and are therefore selected with a lower efficiency instead of . The acceptance, which is averaged over the populations with and without pairs in the final state is therefore subject to error if the MC does not reproduce the real -conversion cross section (the uncertainty due to the BR for the Dalitz decay is negligible). This effect has been checked by searching for for tracks from the IP in events selected as in data and MC. If an pair is produced, at least one track is reconstructed with a probability . Having measured for data and MC the fraction of events with at least one track pair from the IP, the correction to the acceptance is evaluated as follows:
| (6) |
The difference is . This results in a bias on the acceptance, which is taken both as a correction and as an estimate of the systematic uncertainty due to photon conversion.
The total systematic error on the acceptance due to “cluster counting” effects is therefore at MeV (Tab. 5).
In addition to the above effects, the consequences of possibly incorrect estimates have been considered. An error on the results in an incorrect evaluation of the time of flight for each photon and causes the event to be lost. This can occur due to the presence of machine background clusters, which determine the value of in 1-2% of the events. The uncertainty in (Sec. II) therefore gives rise to a systematic error on the acceptance for events. However, the acceptance for events is also affected by an error on , because drift times are wrongly evaluated when is incorrect. The two effects partially cancel out when evaluating the ratio of and acceptances, leaving a residual systematic error of at MeV (Tab. 5).
When the determination is incorrect because two photons hit the same calorimeter cell, or because one photon cluster overlaps with a noisy EMC channel, a further loss of events occurs. In such cases, the time of the cluster is badly reconstructed. The fraction of events lost because of these mechanisms is 1%. The associated correction has been evaluated from data samples of events tagged by decays in the DC, which can be selected independently of the determination. The corresponding systematic error is (Tab. 5).
The sample is contaminated mainly by events in which one of the two kaons undergoes a decay to near the origin, while the other decays to ’s within the DC. If the flight path of this second kaon is between 90 and 160 cm, one of the two photons from a decay can be taken as a . This probability for this to occur strongly decreases with . The purity is evaluated from MC and depends on as shown in Tab. 3. A systematic error on this estimate comes from the uncertainties on the BR’s involved in the decay chains and from the acceptance for . The uncertainty is at MeV and negligible at MeV (Tab. 5). A minor source of background, also included in , is due to events in which multiple clusters from machine background generate both the tag and three prompt clusters. The residual contamination is evaluated using data; it is at MeV and decreases by a factor of two at MeV. The systematic error due to these events is conservatively estimated to be equal to the contamination itself.
| value | 125 MeV | 200 MeV | 300 MeV |
|---|---|---|---|
| 811,800 | 587,700 | 312,900 | |
| 0.8905(7) | 0.8911(8) | 0.8910(9) | |
| 0.9940(1) | 0.99761(8) | 0.99938(6) |
IV.5 Trigger, cosmic-ray veto, and offline filter efficiencies
The trigger efficiency for each channel is obtained from data. The trigger requires at least two fired sectors in the EMC and this condition can be satisfied by decay products or by the alone. The idea is therefore to extract the probability for the () to fire trigger sectors by requiring that the trigger condition be satisfied by the set of () clusters, which are identified on the basis of the time of flight. The trigger efficiency is then calculated by combining and trigger sector probabilities. interactions always fire at least one sector, so . Events are lost when only one sector is fired by the () and no decay product complements the cluster to satisfy the trigger:
| (7) |
The trigger efficiency is given in Tab. 4 for and events, and for the three different values of . The maximal variations in during data taking are 0.5% and 0.1%, respectively, and are due to variations in the energy threshold of the calorimeter trigger (related to small changes in the gain of the calorimeter photomultipliers). The systematic error is evaluated using MC events as the difference between the result given by the above method and the MC truth. It is for events with MeV, and negligible for .
The contribution of accidental clusters to the trigger gives an additional systematic error. This is important only for the channel, for which the trigger inefficiency is 1.3%, as opposed to 0.1% for . This has been studied using an independent estimate of the trigger efficiency for events, which is obtained by weighting MC kinematics with data-extracted trigger-sector efficiencies. In contrast to the method for determining the trigger efficiency described above, this method does not include the possible contribution to the trigger from accidental clusters. The difference between the results from the two methods is ; this is taken as a further systematic error on the trigger efficiency.
The overall systematic error on the ratio of trigger efficiencies is at MeV (Tab. 5).
The cosmic-ray veto causes 3.5% of the events selected with a tag to be lost. The difference between veto efficiencies for and events is very small, since in the majority of the rejected events the cluster satisfies the cosmic-ray veto by depositing energy in two adjacent sectors of the outermost EMC layer, and this is independent of the decay channel. Nevertheless, veto efficiencies are evaluated for each channel using a subsample of selected events for which the cosmic-ray veto was present but not enforced at acquisition. The cosmic-ray veto efficiency is given in Tab. 4 for and . The maximal variation in these efficiencies during data taking is . The statistical error on the ratio of and efficiencies is and is included in the statistical error on the efficiency corrections (Tab. 5).
The background-rejection filter FILFO makes use of EMC cluster properties and the number of DC hits and is intended to eliminate machine-background or cosmic-ray events before DC reconstruction. The ratio of FILFO efficiencies for and events is estimated by MC to be different from unity by at MeV. Since FILFO is based on variables with distributions depending on the run conditions, such as the number of DC hits and the fraction of DC hits in the innermost DC layers, the reliability of this prediction has been checked by studying a data subsample for which the FILFO decision is registered but not enforced during reconstruction. The ratio of FILFO efficiencies for and events in data is found to be different from unity by less than (Tab. 4), and is used to correct the prediction from MC. The systematic error on the ratio of FILFO efficiencies is assumed to be equal to the ratio predicted by MC, which is at MeV (Tab. 5).
| value | 125 MeV | 200 MeV | 300 MeV | |
|---|---|---|---|---|
| 0.9863(1) | 0.9867(1) | 0.9879(2) | ||
| 0.9646(3) | 0.9626(4) | 0.9598(6) | ||
| 0.99964(2) | 0.99963(3) | 0.99944(4) | ||
| 0.99948(3) | 0.99948(3) | 0.99951(4) | ||
| 0.9625(9) | 0.959(1) | 0.954(2) | ||
| 0.99956(3) | 0.99953(3) | 0.99937(5) | ||
V Results
The ratio for MeV is shown in the top panel of Fig. 12. The data have been divided into 17 samples of comparable statistical weight; the first six samples correspond to data collected during 2001, samples from 7 to 16 were acquired during 2002, and the last sample refers to data from a dedicated scan performed by varying the center of mass energy by MeV around the peak. The variations observed for are significantly greater than the statistical fluctuations and are due to variations in the overall efficiencies. The most sizable corrections appearing in the ratio of and selection efficiencies of Eq. 4 are shown in the first five panels of Fig. 13: these are the acceptances for and events, the ratio of trigger and cosmic-ray veto efficiencies, and the tagging-efficiency factor . The variations observed are more pronounced for the samples collected during 2001, for which the rates of machine background were higher and more unstable than for 2002. These have particularly affected the DC efficiency for the innermost layers, and therefore the acceptance.
Each measurement of is obtained by correcting the number of and events by the ratio of the selection efficiencies and the background contaminations (Eq. 2) shown in the sixth panel of Fig. 13. In order to avoid statistical correlations between the event counts and the efficiency corrections evaluated from data, each sample has been split into three parts on a random basis. The first of these is used for event counting, the second for the calculation of the tagging efficiency, and the third for the evaluation of the trigger efficiency. The result for is shown in the bottom panel of Fig. 12; the error bars represent the total statistical error, which for most of the samples corresponds to a fractional uncertainty of . The probability of the fit to a constant is 62%. All quantities entering into the measurement of are listed in Tabs. 1 to 4.


The systematic errors have been evaluated for each sample separately and then averaged by weighting the result from each sample with the corresponding statistical error. The various contributions to the total statistical and systematic errors are shown in Tab. 5 for minimum energies of 125, 200, and 300 MeV; the “syst-stat” error listed in the second row refers to the statistical uncertainty from all of the corrections; all of the sources of systematic error have been discussed in the previous sections.
The final result is obtained by choosing the value of which minimizes the total error. The best accuracy is obtained for a cut of 300 MeV (see Tab. 5). The result is:
| (8) |
where the first error is from the statistics of and events, the second is due to the statistical error in estimating all of the corrections, and the last is the systematic uncertainty; again it must be emphasized that the error from event counting refers to one third of the total available sample.
| value | 125 MeV | 200 MeV | 300 MeV | |
| Source | Fractional statistical error, () | |||
| Event count, “stat” | 0.34 | 0.40 | 0.54 | |
| Efficiencies, “syst-stat” | 0.55 | 0.65 | 0.93 | |
| Total statistical | 0.64 | 0.76 | 1.1 | |
| Source | Fractional systematic error, () | |||
| - interference | 0.80 | 0.80 | 0.80 | |
| correction | 2.0 | 1.8 | 1.4 | |
| Background | 0.10 | 0.10 | 0.10 | |
| Cluster counting | 0.78 | 0.61 | 0.66 | |
| Wrong from | 0.60 | 0.60 | 0.61 | |
| Physics background | 0.35 | 0.14 | 0.04 | |
| Machine background | 0.13 | 0.09 | 0.07 | |
| / | Accidental rate | 0.47 | 0.48 | 0.52 |
| , , evaluation | 0.67 | 0.53 | 0.45 | |
| 0.39 | 0.62 | 0.44 | ||
| Trigger | 0.91 | 0.78 | 0.67 | |
| FILFO | 0.45 | 0.46 | 0.74 | |
| Total systematic | 2.8 | 2.5 | 2.2 | |
| Total | 2.8 | 2.6 | 2.5 | |
Some of the corrections show variations as a function of : the most important of these are the tagging efficiencies [ and , Tab. 1], and the contamination in the selection (, Tab. 3). In order to check the reliability of these corrections, the results of the analysis are compared when choosing values of 125, 200, and 300 MeV. Note that the event yield decreases by a factor of three in going from 125 to 300 MeV. In order to avoid correlation effects in the comparison, the data set has been split using a finer granularity, corresponding to 94 samples, each of 5 of integrated luminosity. The analysis is performed using a different energy cut on each successive sample. The of the three values obtained has a probability of 21% (see Tab. 6).
| energy cut ( MeV) | 125 | 200 | 300 |
|---|---|---|---|
| /dof; | 3.12/2;21% | ||
The present result (Eq. 8) can be compared with the KLOE result from the analysis of the year 2000 data sample KLOE Collaboration, A. Aloisio et al. (2002),
| (9) |
where in this case the systematic error includes the statistical error from all of the corrections: . The error on the former result was dominated by the systematic uncertainty on the ratio of tagging efficiencies (0.011). The present analysis makes use of various improvements to the evaluation of the tagging efficiencies with respect to the analysis scheme of LABEL:\cite[citep]{\@@bibref{AuthorsPhrase1Year}{missing}{\@@citephrase{,_}}{}}plb_rappo: a larger window in is required and a more complete parametrization of the biases induced by errors in the evaluation has been included. As a result, the absolute systematic error due to the tagging efficiencies has been reduced to 0.0014. The systematic uncertainty due to other sources have been reduced as well, from 0.0069 to 0.0048. Nevertheless, the most significant change in the analysis with respect to that described in LABEL:\cite[citep]{\@@bibref{AuthorsPhrase1Year}{missing}{\@@citephrase{,_}}{}}plb_rappo is the improved treatment of the tag bias. Therefore, when comparing the two results, the statistical errors and the systematic errors on the tagging efficiencies are treated as independent errors. With this assumption, the two results are compatible, with a probability of . The two measurements can therefore be averaged. Weighting each by its independent errors and calculating the average systematic error with the same weights gives:
| (10) |
In LABEL:\cite[citep]{\@@bibref{AuthorsPhrase1Year}{missing}{\@@citephrase{,_}}{}}plbpennew, this result is combined with the KLOE measurements of / to extract the dominant BR’s. To this end, we exploit unitarity: the sum of the BR’s for the and modes has been assumed to be equal to one, the remaining decays accounting for less than . The BR of the decay has been evaluated from the KLOE measurement of and lepton universality. All the results are summarized in the Appendix A. For the modes, we find:
|
|
(11) |
The KTeV collaboration, using their measurement of the ratio of BR’s for the , , together with the world average for , , quotes an expected value of KTeV Collaboration, T. Alexopoulos, et al. (2004a): . This is in good agreement with the present result, Eq. 10.
Acknowledgments
We thank the DAΦNE team for their efforts in maintaining low-background running conditions and their collaboration during all data taking. We want to thank our technical staff: G. F. Fortugno for his dedicated work to ensure efficient operations of the KLOE Computing Center; M. Anelli for his continuous support to the gas system and the safety of the detector; A. Balla, M. Gatta, G. Corradi, and G. Papalino for the maintenance of the electronics; M. Santoni, G. Paoluzzi, and R. Rosellini for general support to the detector; C. Piscitelli for his help during major maintenance periods. This work was supported in part by DOE grant DE-FG-02-97ER41027; by EURODAPHNE, contract FMRX-CT98-0169; by the German Federal Ministry of Education and Research (BMBF) contract 06-KA-957; by Graduiertenkolleg ‘H.E. Phys. and Part. Astrophys.’ of Deutsche Forschungsgemeinschaft, Contract No. GK 742; by INTAS, contracts 96-624, 99-37.
Appendix A Evaluation of BR’s
The main BR’s are evaluated from the measurements of and from the ratio of BR’s . The measured values are KLOE Collaboration, F. Ambrosino, et al. :
|
|
(12) |
The correlation between results for and is 13%. The only remaining mode with a BR large enough to measurably affect the constraint is ; the BR’s for all other channels sum up to . Assuming lepton universality,
| (13) |
where are mode-dependent long-distance radiative corrections and are decay phase-space integrals. Using from KTeV KTeV Collaboration, T. Alexopoulos, et al. (2004b) and from Ref. Andre, 2004, a value for is obtained: . The four main BR’s of the are evaluated from
| (14) |
where , , , . The result is:
|
|
(15) |
The correlation matrix is
| (16) |
References
- (1) KLOE Collaboration, F. Ambrosino, et al., hep-ex/0601026, accepted for publication by Phys. Lett. B.
- Cirigliano et al. (2000) V. Cirigliano, J. F. Donoghue, and E. Golowich, Eur. Phys. J. C18, 83 (2000).
- Cirigliano et al. (2004) V. Cirigliano, G. Ecker, H. Neufeld, and A. Pich, Eur. Phys. J. C33, 369 (2004).
- KLOE Collaboration, A. Aloisio et al. (2002) KLOE Collaboration, A. Aloisio et al., Phys. Lett. B538, 21 (2002).
- Groom et al. (2000) D. E. Groom et al. (Particle Data Group), Eur. Phys. J. C15, 1 (2000).
- S. Eidelman, et al., Particle Data Group (2004) S. Eidelman, et al., Particle Data Group, Phys. Lett. B592 (2004), and 2005 partial update for edition 2006, URL http://pdg.lbl.gov.
- Dunietz et al. (1987) I. Dunietz, J. Hauser, and J. Rosner, Phys. Rev. D35, 2166 (1987).
- Paver and Riazuddin (1990) N. Paver and Riazuddin, Phys. Lett. B246, 240 (1990).
- Close et al. (1993) F. E. Close, N. Isgur, and S. Kumano, Nucl. Phys. B389, 513 (1993).
- KLOE Collaboration, M. Adinolfi, et al. (2002a) KLOE Collaboration, M. Adinolfi, et al., Nucl. Instr. and Meth. A488, 51 (2002a).
- Navon et al. (1980) I. Navon et al., Phys. Rev. C22, 717 (1980).
- KLOE Collaboration, M. Adinolfi, et al. (2002b) KLOE Collaboration, M. Adinolfi, et al., Nucl. Instr. and Meth. A482, 363 (2002b).
- KLOE Collaboration, M. Adinolfi, et al. (2002c) KLOE Collaboration, M. Adinolfi, et al., Nucl. Instr. and Meth. A492, 134 (2002c).
- KLOE Collaboration, F. Ambrosino et al. (2004) KLOE Collaboration, F. Ambrosino et al., Nucl. Instr. and Meth. A534, 403 (2004).
- (15) C. Gatti, M. Palutan, and T. Spadaro, KLOE Note 209 (2006), unpublished, URL http://www.lnf.infn.it/kloe/pub/knote/kn209.ps.
- Gatti (2005) C. Gatti, Eur. Phys. J. C45, 417 (2005), and references therein.
- Ramberg et al. (1993) E. Ramberg et al., Phys. Rev. Lett. 70, 2525 (1993).
- KTeV Collaboration, T. Alexopoulos, et al. (2004a) KTeV Collaboration, T. Alexopoulos, et al., Phys. Rev. D70, 092006 (2004a).
- KTeV Collaboration, T. Alexopoulos, et al. (2004b) KTeV Collaboration, T. Alexopoulos, et al., Phys. Rev. D70, 092007 (2004b).
- Andre (2004) T. C. Andre (2004), hep-ph/0406006.