LAL 05-33
April 2005
W and Z Boson Production in Collisions from
Run II of the TeVatron Collider
Pierre Petroff
Laboratoire de l’Accélérateur Linéaire
IN2P3-CNRS et Université de Paris-Sud, Bât. 200 , BP 34, F-91898 Orsay
Abstract
Measurements of inclusive W and Z cross sections times leptonic branching ratios for collisions at =1.96 TeV are reported here on behalf of the CDF and DØ collaborations. The data correspond to an integrated luminosity up to 200 . The ratio of leptonic W and Z rates is measured and the leptonic branching fraction B() is extracted as well as an indirect value for the total width of the W and the CKM matrix element .
1 Introduction
Testing the Standard Model (SM) is one of the main goals of the Tevatron experiments. The large number of W and Z bosons allow not only to perform a robust test of the SM but can be extensively used in the calibration of the detectors energy scale. Moreover, confidence in the results allows us to use them as normalization for successive measurements like the top cross section in which systematics and theoretical uncertainties would cancel in the ratio of the cross sections.
On behalf of the CDF and DØ collaborations we report new results on the W and Z cross section measurement from Run II of the Tevatron at a center mass energy of = 1.96 TeV. Interesting new result reported here is measurement of the inclusive W and Z cross sections times the branching ratio in channel. The decay is a nice benchmark for all analyses including ’s like searches for Supersymmetry in models with high values of tan.
2 W and Z signatures
Due to a large QCD background, decay channels involving quarks are difficult to measure; therefore W and Z bosons are mainly identified through their leptonic decays. These decays are characterized by a high transverse energy lepton and large transverse missing energy for W, or by two high transverse energy leptons for Z.
Electrons are identified as an electromagnetic (EM) cluster using a simple cone algorithm. To reduce the background of jets faking electrons, electron candidates are required to have a large fraction of their energy deposited in the EM section of the calorimeter and pass energy isolation and shower shape requirements. The weak bosons backgrounds and the signal have been estimated using a Monte Carlo simulation. Electron candidates are classified as tight if a track is matched spatially to EM cluster and if the track transverse momentum is close to the transverse energy of the EM cluster. While DØ results are for electrons in the central calorimeter only () CDF gives results with electrons measured in the central and plug calorimeters (). Both CDF and DØ require at least one tight electron in the central calorimeter () for candidates.
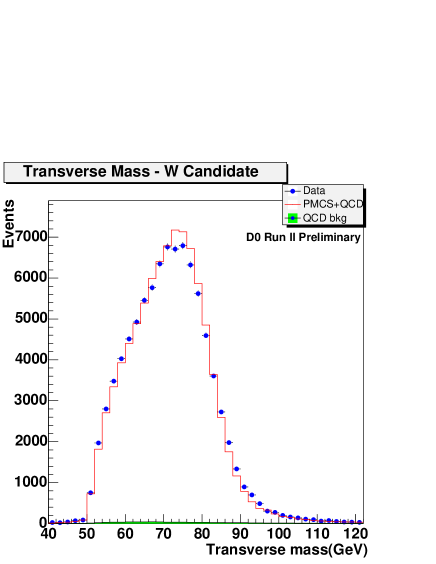
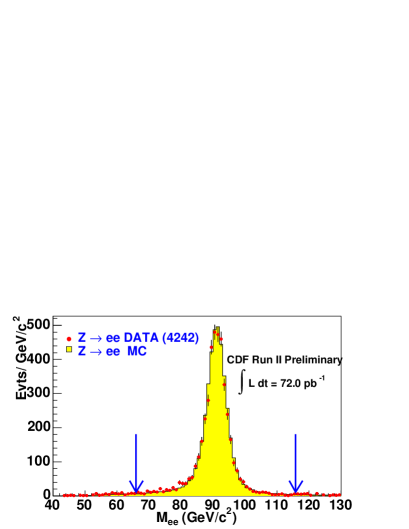
The W transverse mass distribution in the channel from DØ is shown in Fig. 1 and the mass distribution from CDF is shown in Fig. 2. These figures show that the simulation both of the background and the signal describes the data well.
Muons are identified by a track in the muon system matched to a track in the central tracking system. For CDF the measurement in the muon channel includes the muons reconstructed in the central muon extension sub-detector which extends the coverage from to For DØ the muon reconstruction is extended to the forward muon detector with a coverage up to .
Muons from the decay of heavy-flavor hadrons are significant background to vector bosons production. It can be reduced by requiring that the muon is isolated. The weak bosons backgrounds are estimated with Monte Carlo simulation. Cosmic rays muons contaminate the muon sample. Timing capabilities and distance of the muon track to the vertex are used to reduce this background to low level.
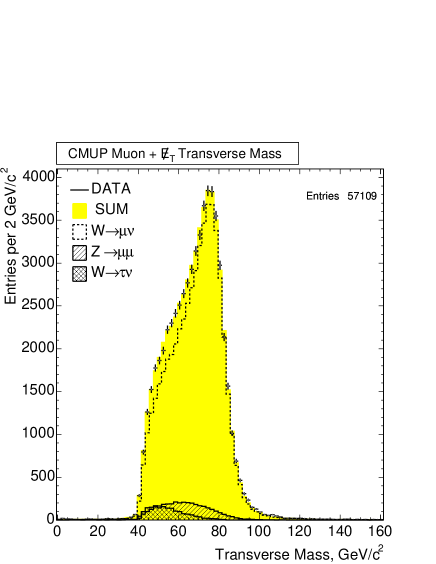
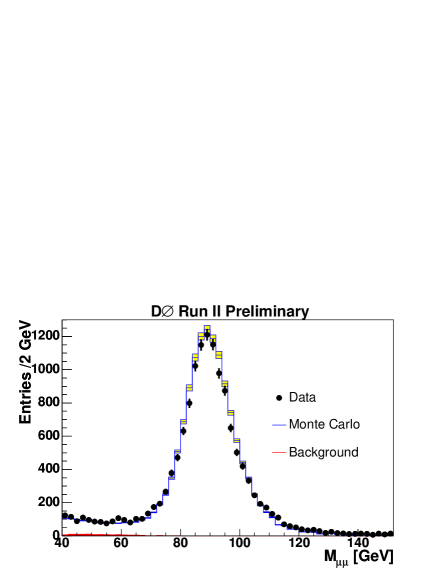
The transverse mass distribution in Fig. 3 for CDF and mass distribution for DØ in Fig. 4 show that backgrounds are low and the simulation is reproducing the data well.
| Channel | Yield | Bkg % | .Br | |
| 37584 | 4.4 | 72 | pb | |
| 31722 | 9.4 | 72 | pb | |
| 72 | pb | |||
| 57109 | 9.49 | 193.5 | pb | |
| 4242 | 1.5 | 72 | pb | |
| 1785 | 0.7 | 72 | pb | |
| 72 | pb | |||
| 3568 | 0.4 | 193.5 | pb | |
| 2345 | 26 | 72 | pb | |
| 50 | 26.5 | 72 | pb |
| Channel | Yield | Bkg % | .Br | |
| 116569 | 3.15 | 177.3 | pb | |
| 8305 | 11.8 | 17 | pb | |
| 4712 | 1.8 | 177.3 | pb | |
| 14352 | 1.4 | 147.7 | pb | |
| 1946 | 55 | 207 | pb |
The percentage of the total background for each experiment and each channel is reported in Table 1 for CDF and in Table 2 for DØ . In these tables the total number of events and the corresponding total integrated luminosity are quoted also.
The lepton reconstruction is challenging at hadron collider. CDF has performed a cross section measurement of the channel . One or three charged tracks with ’s are selected in a cone pointing toward a narrow calorimeter cluster. The combined mass of tracks and ’s should be less than 1.8 GeV/. The main background is coming from jets and weak bosons leptonic decays. The channel is studied by CDF in a mode with one decaying leptonically in an electron and the other decaying into hadrons. The candidates are reconstructed by matching narrow calorimeter clusters with tracks following the same method used in the analysis.
The number of events, the background and the integrated luminosity for the CDF analysis can be found in Table 1.
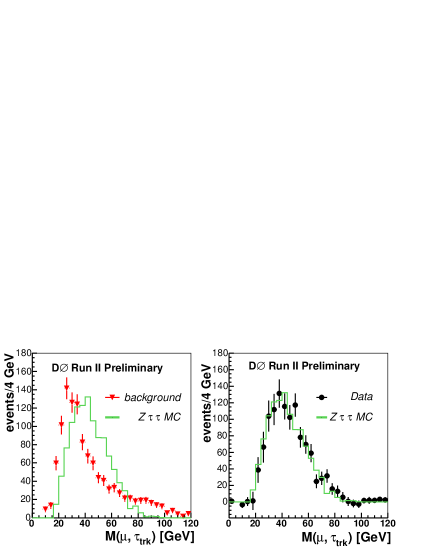
DØ has performed a measurement in the channel using a Neural Network techniques. A decays into and the other into hadrons+ or . The total background, the number of events and the integrated luminosity are given in Table 2. Fig. 5 shows the invariant mass distribution of the and the tracks both for background estimated from like sign (LS) sample and signal from opposite sign (OS) sample.
3 W and Z cross sections
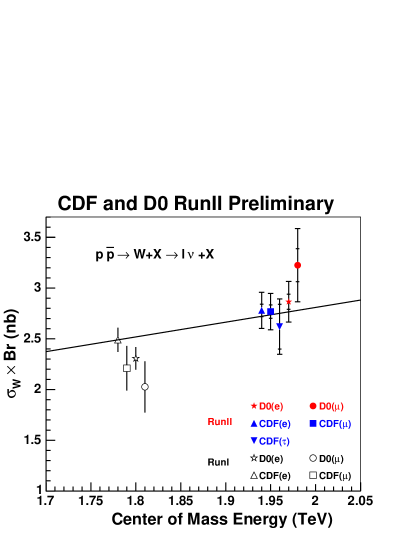
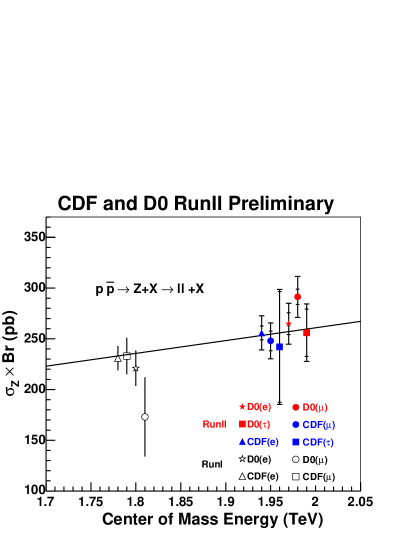
The cross section measurements are listed in Table 1 and Table 2 for CDF [1] and DØ respectively after subtraction of the virtual photon exchange in the channels. Combined cross section measurements for e and channels at = 72 are reported in Table 1 by CDF. Fig. 7 and Fig. 7 show a good agreement with NNLO theoretical calculation [2].
For systematic uncertainties the main contribution is coming from the luminosity measurement. The PDF uncertainties are and are estimated using the eigenvector basis sets for CTEQ6M [3]. The contribution from the lepton identification is . This error is expected to be reduced with more statistics in the future.
The largest uncertainty on the cross section measurements comes from the uncertainty on the luminosity measurements. This uncertainty cancels when determining the ratio of the W boson to Z boson production cross section.
CDF reports results on the ratio R of the leptonic W and Z cross sections for combined e and channels and for the channel only with a sensitivity of 72 and 193.5 respectively. R = for the combined channels and R = for the channel. DØ reports a measurement of R = in the e channel.
Using the measured value B()111B() = at LEP and a theoretical calculation of the ratio of production cross sections [4], CDF extracts the leptonic branching ratio B() = % for the combined channels and B() = % for the channel. From the theoretical value of the leptonic partial width, ()222 MeV [5], CDF extracts the total width of the W boson: MeV. This values is close to the SM value and the current world average value 333 Current world average = MeV and SM value = MeV. Finally as in the SM the total width depends on certain CKM matrix elements CDF determined the matrix element by fixing all other matrix elements at their world average values.
4 Conclusion and Prospects
W and Z production cross section values have been measured by CDF and DØ showing an agreement with SM predictions. The increase of the statistics and the combination of the results of the two experiments will allow in a near future to improve the accuracy of the test of the Standard Model. Finally the first results on the and cross sections demonstrate the feasibility of a new physics search with ’s at the Tevatron.
References
- [1] D. Acosta et al., (CDF Collab.) hep-ex/0406078 submitted to Phys. Rev. Lett.
- [2] P.J. Stutton, A.D. Martin, R.G. Roberts and W.J. Stirling, Phys.Rev. D45, 2349(1992); P.J.Rijken and W.L.van Neervan, Phys. Rev. D51, 44 (1995); R.Hamberg, W.L.van Neervan and W.B. Kilgore, Nucl. Phys. B359, 343 (1991); R.V.Harlander and W.B.Kilgore, Phys. Rev. Lett. 88 201801 (2002).
- [3] J. Pumplin et al JHEP 0207, 012 (2002).
- [4] Theoretical cross sections calculated on the basis of NLO calculations by A.D. Martin et al hep-ph/0308087, and on the basis of programs of W.L. van Neerven [2]
- [5] K. Hagiwara et al Phys. Rev. D66, 010001 (2002).