Bringing the SciBar Detector
to the Booster Neutrino Beam
A. A. Aguilar-Arevalo1, J. Alcaraz4, S. Andringa4, S. J. Brice2, B. C. Brown2, L. Bugel10, J. Catala6, A. Cervera6, J. M. Conrad1, E. Couce6, U. Dore11, X. Espinal4, D. A. Finley2, J. J. Gomez-Cadenas6, Y. Hayato5, K. Hiraide7, T. Ishii3, G. Jover4, T. Kobilarcik2, Y. Kurimoto7, Y. Kurosawa7, W. C. Louis8, P. F. Loverre11, L. Ludovici11, T. Lux4, J. Martin-Albo6, C. Mariani11, K. B. M. Mahn1, K. Matsuoka7, W. Metcalf9, J. Monroe1, T. Nakaya7, F. Nova4, P. Novella6, A. Y. Rodriguez4, F. Sanchez4, M. H. Shaevitz1, M. Sorel6, R. Stefanski2, M. Taguchi7, H. Tanaka7, A. Tornero6, R. Van de Water8, M. O. Wascko9, M. Wilking12, M. Yokoyama7, G. P. Zeller1, E. D. Zimmerman12
1Columbia University
2Fermi National Accelerator Laboratory
3High Energy Accelerator Research Organization (KEK)
4Institut de Fìsica d’Altes Energies (IFAE), Universitat Autònoma de Barcelona
5Institute for Cosmic Ray Research (ICRR)
6Instituto de Fìsica Corpuscular, Universidad de València
7Kyoto University
8Los Alamos National Laboratory
9Louisiana State University
10Stratton Mountain School
11Universita’ degli Studi di Roma ”La Sapienza” and Instituto Nazionale di Fisica Nucleare (INFN)
12University of Colorado, Boulder
Executive Summary
This document presents the physics case for bringing SciBar, the fully active, finely segmented tracking detector at KEK, to the FNAL Booster Neutrino Beam (BNB) line. This unique opportunity arose with the termination of K2K beam operations in 2005. At that time, the SciBar detector became available for use in other neutrino beam lines, including the BNB, which has been providing neutrinos to the MiniBooNE experiment since late 2002.
The physics that can be done with SciBar/BNB can be put into three categories, each involving several measurements. First are neutrino cross section measurements which are interesting in their own right, including analyses of multi-particle final states, with unprecedented statistics. Second are measurements of processes that represent the signal and primary background channels for the upcoming T2K experiment. Third are measurements which improve existing or planned MiniBooNE analyses and the understanding of the BNB, both in neutrino and antineutrino mode.
For each of these proposed measurements, the SciBar/BNB combination presents a unique opportunity or will significantly improve upon current or near-future experiments for several reasons. First, the fine granularity of SciBar allows detailed reconstruction of final states not possible with the MiniBooNE detector. Additionally, the BNB neutrino energy spectrum is a close match to the expected T2K energy spectrum in a region where cross sections are expected to vary dramatically with energy. As a result, the SciBar/BNB combination will provide cross-section measurements in an energy range complementary to MINERA and complete our knowledge of neutrino cross sections over the entire energy range of interest to the upcoming off-axis experiments.
SciBar and BNB have both been built and operated with great success. As a result, the cost of SciBar/BNB is far less than building a detector from scratch and both systems are well understood with existing detailed and calibrated Monte Carlo simulations. The performance expectations assumed in this document are therefore well-grounded in reality and carry little risk of not meeting expectations.
This document includes a site optimization study with trade-offs between the excavation costs associated with placing the detector at different angles from the axis of the BNB and the physics which can be performed with the neutrino flux expected at these locations. Table 1 provides a summary of the impact of placing SciBar at these locations on the proposed measurements. The overwhelming conclusion of this study is that an on-axis location presents the best physics case and offsets the additional costs due to excavation. The estimated cost of the detector enclosure at the desired on-axis location is $505K.
This proposal requests an extension of the BNB run through the end of FY2007, one year past its currently approved run, regardless of the outcome of the MiniBooNE appearance search. Our schedules show that SciBar would be operational in the BNB within 9 months of initiation of the project, allowing ample time to achieve our physics goals in FY2007. In this document, we assume a total data set of POT, with POT in neutrino mode and POT in antineutrino mode.
SciBooNE Collaboration
J. M. Conrad, K. B. M. Mahn, M. H. Shaevitz, G. P. Zeller
Columbia University, New York, NY
S. J. Brice, B. C. Brown, D. A. Finley, T. Kobilarcik, R. Stefanski
Fermi National Accelerator Laboratory, Batavia, IL
T. Ishii
High Energy Accelerator Research Organization (KEK), Tsukuba, Japan
J. Alcaraz, S. Andringa, X. Espinal, G. Jover, T. Lux, F. Nova, A. Y. Rodriguez, F. Sanchez
Institut de Fìsica d’Altes Energies (IFAE), Universitat Autònoma de Barcelona, Barcelona, Spain
Y. Hayato
Institute for Cosmic Ray Research (ICRR), Tokyo, Japan
J. Catala, A. Cervera, E. Couce, J. J. Gomez-Cadenas, J. Martin-Albo, P. Novella, M. Sorel, A. Tornero
Instituto de Fìsica Corpuscular, Universidad de València, Valencia, Spain
K. Hiraide, Y. Kurimoto, Y. Kurosawa, T. Nakaya∗, K. Matsuoka, M. Taguchi, H. Tanaka, M. Yokoyama
Kyoto University, Kyoto, Japan
W. C. Louis, R. Van de Water,
Los Alamos National Laboratory, Los Alamos, NM
W. Metcalf, M. O. Wascko∗
Louisiana State University, Baton Rouge, LA
L. Bugel
Stratton Mountain School, Stratton Mountain, VT
U. Dore, P. F. Loverre, L. Ludovici, C. Mariani,
Universita’ degli Studi di Roma ”La Sapienza” and Instituto Nazionale di Fisica Nucleare (INFN), Rome, Italy
M. Wilking, E. D. Zimmerman
University of Colorado, Boulder, CO
∗Co-spokespersons
| Location A (on-axis) | Location B | Location C | Location D | Location H | Mini-BooNE alone | K2K, MINOS, MINERA | |||
| Distance from MB target | 100m | 100m | 100m | 100m | 250m | 541m | — | ||
| Height above beam center | 0cm | 300cm | 500cm | 700cm | 300cm | 0cm | — | ||
| Total flux (10-10cm-2POT-1) | 350 | 250 | 180 | 140 | 40 | 5 | 160 (K2K) | ||
| Peak energy (GeV) | 0.6 | 0.45 | 0.35 | 0.25 | 0.6 | 0.6 | 1.2,3,7,12 | ||
| Enclosure cost | $505k | $431k | $292k | $219k | $431k | — | — | ||
| Leverage MB | WS BG spectrum | :1.51020 POT | |||||||
| Disappearance | :0.51020 POT | ||||||||
| Disappearance | :1.51020 POT | ||||||||
| Intrinsic | :0.51020 POT | ||||||||
| Help T2K | CC systematics | :0.51020 POT | |||||||
| NC systematics | :0.51020 POT | ||||||||
| anti- Measurements | :1.51020 POT | ? | |||||||
| SciBar Physics | Exclusive anti- -p | :1.51020 POT | ? | ||||||
| NC Energy Dependence | :0.51020 POT | ||||||||
| :0.51020 POT :1.51020 POT | |||||||||
Chapter 1 Introduction
The American Physical Society’s Divisions of Nuclear Physics and Particles and Fields, together with the Divisions of Astrophysics and the Physics of Beams, have recently conducted a “Study on the Physics of Neutrinos”. The resulting APS report [1] stated:
We recommend, as a high priority, a comprehensive U.S. program to complete our understanding of neutrino mixing, to determine the character of the neutrino mass spectrum, and to search for CP violation among neutrinos.
This document presents the physics case for installing the SciBar detector of the K2K experiment in the BNB at Fermilab. K2K beam operations were terminated in 2005. SciBar then became available for use in other neutrino beam lines, including BNB, which has been providing neutrinos to the MiniBooNE detector since late 2002.
The physics that can be accomplished with this configuration directly addresses the high priority recommendation of the APS study, and, more specifically, addresses two special points also mentioned in the report:
Support for decisive resolution of the high-m2 puzzle. This issue is currently addressed by a single experiment now running in a neutrino beam at Fermilab. Ultimately, a decisive resolution of the puzzle may require additional studies with beams of antineutrinos.
and
The precise determination of neutrino cross sections is an essential ingredient in the interpretation of neutrino experiments and is, in addition, capable of revealing exotic and unexpected phenomena.
The marriage of SciBar and the BNB presents a low risk opportunity for a broad physics reach. Both are already built and have been operated very successfully. This means that:
-
1.
the cost of bringing SciBar to Fermilab is far smaller than building a new detector from scratch,
-
2.
both systems are very well understood with detailed and calibrated Monte Carlo simulations—the predictions of performance in this document have already been demonstrated with real operation.
The remainder of this introduction provides the information necessary to follow the physics case outlined in the later chapters. The BNB is described in Section 1.1 and the SciBar detector in Section 1.2. The specific locations where the SciBar detector might be placed in the BNB are discussed in Section 1.3, and the expected event rates at each location are detailed in Section 1.4. The introduction ends with a discussion of time constraints in Section 1.6.
Three distinct types of measurements become possible with SciBar in the BNB. First, there are ways that SciBar can leverage the existing investment in the MiniBooNE detector. Chapter 4 describes the ways in which SciBar can improve measurements using MiniBooNE tank data. Next, Chapter 3 describes the reasons why the K2K collaboration would like to place SciBar in the BNB, and describes how a number of cross section measurements can be made that are vital to T2K reaching their desired oscillation sensitivity. The last class of measurements, in Chapter 2, cover physics topics that can be addressed by SciBar/BNB alone.
For each SciBar measurement, this document states:
-
1.
why the measurement is interesting,
-
2.
the expected statistics for the measurement, and whether the beamline needs to be in neutrino or antineutrino mode,
-
3.
why the measurement cannot be done at all or as well by any other past, present, or near future experiment, and
-
4.
how the different potential detector locations for SciBar in the Booster Neutrino Beam affect the measurement.
Table 1 provides a handy summary of the potential for success of each of the proposed measurements at each of the detector locations considered. The document concludes with discussion of schedule and costs in Chapter 5.
1.1 Booster Neutrino Beam Description
To create the BNB, 8 GeV protons are extracted from the Booster and steered to strike a 71 cm long, 1 cm diameter beryllium target. This target sits at the upstream end of a magnetic focusing horn that is pulsed with 170 kA to focus the mesons produced by the proton-Be interactions. Following the horn is a 50 m long decay pipe that gives the pions a chance to decay and produce neutrinos, before the mesons encounter an absorber and then dirt which serve to remove all but the neutrinos from the beam.
The protons from the Booster arrive in batches of 84 bunches, each of which is 4 ns wide with 19 ns peak-to-peak separation, giving a length of 1.6 s to the whole batch. The batches are extracted at a maximum rate of 5 Hz, a limit set by the horn, and each contains protons. This timing structure is carried through to the neutrino beam, and provides a tight constraint on cosmic backgrounds.
In its current mode of operation, the horn focuses and defocuses thus producing a beam. By reversing the polarity of the horn current, are focused and a predominantly beam is created. In addition there is an absorber that can be lowered into the beam at 25 m. Though currently not in use, the absorber would alter the beam spectrum and composition in ways that may prove useful for background checks or to reduce the effects of beam parallax on a nearby detector.
The pion and kaon production cross sections from p-Be interactions are the most important input to the BNB neutrino flux prediction, and the most uncertain. These cross sections are being measured very precisely by the HARP experiment at CERN [3]. The collaboration has released its first result, a precise measurement of the production cross section of pions in proton-aluminum interactions at 12.9 GeV/c, which is the K2K neutrino beam energy and target material [4]. The beryllium analysis is expected to be released within the next few months, and HARP anticipates uncertainties of 5% on the pion production cross sections, for both and . This will allow a very precise prediction of the neutrino and antineutrino fluxes in the BNB by the time SciBooNE proposes to start its data run.
1.1.1 Expectations for Proton Delivery
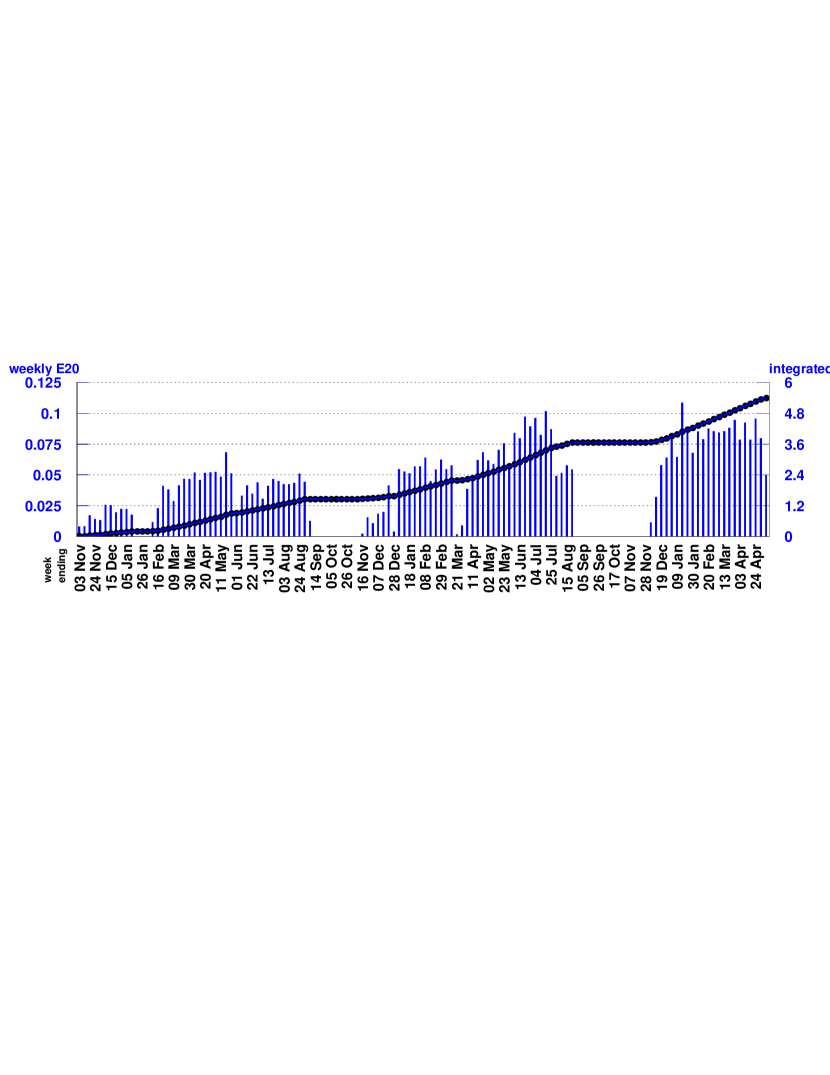
The Booster Neutrino Beam saw first protons on target (POT) in September of 2002 and Fig. 1.1 records the weekly and cumulative proton delivery since then.
At present, the NuMI beam has started running and the Booster Neutrino Beam has been receiving significantly fewer protons. The letter from the Fermilab Director to MiniBooNE entitled “Prospects for the Booster Neutrino Beam,” and dated August 6, 2004 states:
Collaborations proposing experiments to run in the Booster neutrino beam in FY2006 and beyond should plan their physics program on the basis of POT per year. Proponents may want to discuss what additional physics could be done with somewhat more protons, but they should understand that is beyond our present expectations for the beam.
In this document, we make the assumption that POT will be delivered to the BNB in one year. This assumption is consistent with the Lab’s current “proton plan [5].” Additionally, the improvements in proton delivery made since the Director’s letter and indicated in the latter portions of Fig. 1.1 justify this optimistic assumption. Because MiniBooNE is currently approved to run only through the end of FY2006, this proposal is a request for an extension of the BNB run through the end of FY2007, regardless of the result of the MiniBooNE oscillation search in neutrino mode.
Operating the BNB for one year in the NuMI era requires running the Booster accelerator 2 Hz more than it would run without the BNB [6]. This cost increase has been estimated to be approximately $40 per hour [6]. Additionally, the 8 GeV line costs $11 per hour to run [7]. Assuming a BNB run of 2.01020POT, this indicates a BNB run of 2.2107s, which amounts to an approximate incremental cost increase of $315,000. Additionally, this added running has the potential to increase the failure rates of components in the Linac and Booster. This impact has been studied and is expected to be minimal [6].
MiniBooNE will likely switch the polarity of the horn and begin accumulating statistics in antineutrino mode before the end of 2005, continuing until the next accelerator shutdown. However, the decision of how to run the BNB in 2006 hinges on whether or not MiniBooNE sees a appearance oscillation signal; the MiniBooNE collaboration has recently stated that this result will not be out before the end of 2005. If MiniBooNE sees a signal then the case for installing SciBar in the beam becomes very strong as it will provide a powerful check on the spectrum and will reduce the uncertainty on the intrinsic background by measuring it at a near location (see Chapter 4 for details). If MiniBooNE does not see a oscillation signal then the beamline will most likely switch to antineutrino mode in FY2006. The physics justification for this switch is laid out in [2]. This document focuses on the case where MiniBooNE does not see a appearance signal and the ensuing data are taken primarily in antineutrino mode. In this scenario, we assume that in one year POT will be delivered in neutrino mode and POT in antineutrino mode.
1.2 SciBar Detector Description
1.2.1 The K2K SciBar Detector
SciBar [9] is a fully active, finely segmented tracking detector consisting of plastic scintillator bars. It was constructed in summer 2003 as a new near detector for K2K, and operated until late 2004. The cost of SciBar was approximately $2M, not including contingencies or labor.
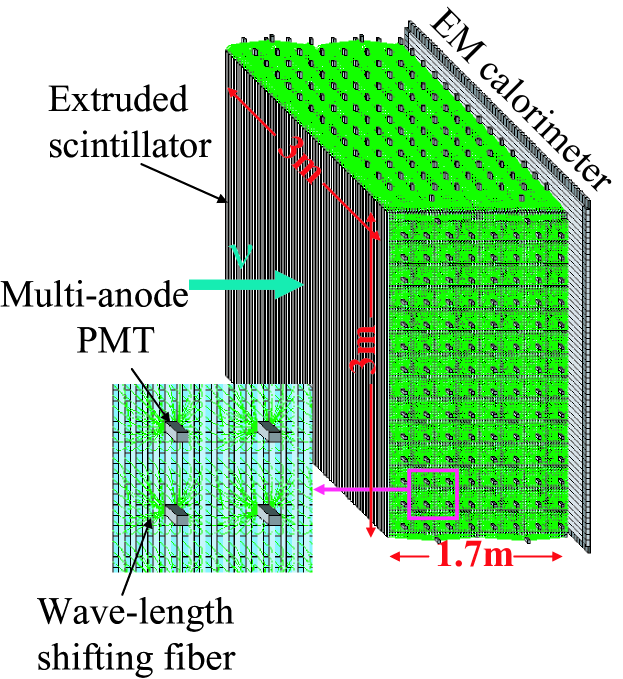
Figure 1.2 shows a schematic view of SciBar. The tracker consists of 14,848 extruded scintillator strips, each cm. The scintillators are arranged vertically and horizontally to construct a m3 volume with a total mass of 15 tons, and a fiducial mass of 9.38 tons. Each strip is read out by a wavelength-shifting (WLS) fiber attached to a 64-channel multi-anode PMT (MA-PMT). Charge and timing information from each MA-PMT is recorded by custom electronics [10]. The specification of each component of SciBar is summarized in Table 1.1.
| Structure | Dimensions | 3 m (horizontal), 3 m (vertical), 1.7m (thickness) |
| Weight | 15 tons | |
| Number of strips | 14,848 | |
| Number of PMTs | 224 | |
| Scintillator | Material | Polystyrene with PPO(1%) and POPOP(0.03%) |
| Size | 2.5 1.3 300 cm2 | |
| Coating | 0.25 mm (TiO2) | |
| Emission wavelength | 420 nm (peak) | |
| Fiber | Type | Kuraray Y11(200)MS |
| Diameter | 1.5 mm | |
| Refractive index | 1.59 (outer)/ 1.50 (middle)/ 1.42 (inner) | |
| Absorption wavelength | 430 nm (peak) | |
| Emission wavelength | 476 nm (peak) | |
| Attenuation length | 350 cm | |
| PMT | Model | Hamamatsu H8804 |
| Cathode material | Bialkali | |
| Anode | ( mm2/pixel) | |
| Quantum efficiency | 12% for 500 nm photons | |
| Typical gain | at V | |
| Response linearity | 200 PE at gain of | |
| Cross talk | 4% (adjacent pixel) | |
| DAQ | VA/TA ASIC | IDEAS VA32HDR11 and TA32CG |
| Shaping time | 1.2 sec (VA), 80 ns (TA) | |
| Noise | 0.3 PE | |
| Response linearity | 5% at 300 PE | |
| TDC resolution | 0.78 ns | |
| TDC full range | 50 sec |
An electromagnetic calorimeter (EC) is installed downstream of SciBar. The purpose of the EC is to measure the contamination in the beam and the yield from neutrino interactions, particularly for high momentum s whose decay photons are boosted forward. The EC consists of 32 (vertical) and 30 (horizontal) modules of the so-called “spaghetti calorimeter” from the CHORUS experiment [11]. Each module is made of 1 mm diameter scintillating fibers embedded in the grooves of 1.9 mm thick lead foils. The dimensions of each module are cm3. The light from each module is read out by two 1 ” PMTs on both sides. The EC has a thickness of 11 along the beam direction, giving it a very high efficiency. The energy resolution of the EC is .
A muon range detector (MRD) [12] is located downstream of the EC. The MRD at KEK consists of 12 layers of iron plates sandwiched between vertical and horizontal drift-tube layers. The cross sectional size of a layer is approximately 7.6 m 7.6 m. The four upstream iron plates are 10 cm thick and the eight downstream are 20 cm thick. The total iron thickness of 2.0 m covers up to 2.8 GeV muons.
Not including the MRD, the actual size of the SciBar detector’s experimental area at K2K is approximately 5.5 m wide and 2 m along the beam direction; SciBar, the EC, and two electronics racks were installed in that space.
1.2.2 Detector Performance
| Particle type | Efficiency |
|---|---|
| 98.9% | |
| 98.1% | |
| p | 97.7% |
| e± | 94.5% |
The SciBar detector was operated at K2K from October 2003 to November 2004, for an accumulated data set of 0.211020 POT. During that period, the number of dead channels was monitored and only six dead channels were identified out of 14,336 channels. Operationally, SciBar performed very well, requiring only two detector accesses over the duration of its neutrino beam run.
Light yield in SciBar was measured using cosmic ray data. The average light yield is 18 photoelectrons (PE) for a 1.0 cm muon track at 40 cm from the PMT along the fiber. The light yield is sufficient for track finding and particle identification. The stability of the light yield is also checked using cosmic ray data. With PMT gain corrections, the light yield was found to be stable at the 0.7% level.

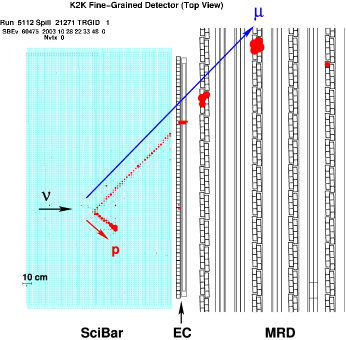
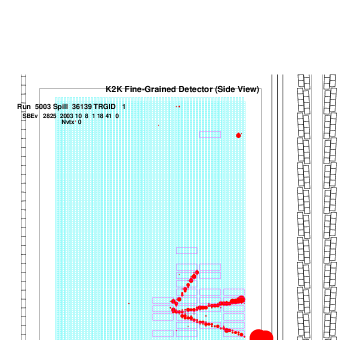
Figure 1.3 shows two event displays of actual charged-current candidate events in SciBar. The first event shown is a CC QE candidate, with two clear tracks, and the second event shown is a CC1 candidate with three clear tracks. We can clearly distinguish the muon/pion tracks from the proton tracks by their energy depositions.
Particle tracks are found in SciBar using the powerful cellular automaton track pattern recognition algorithm [13]. The minimum track length required to reconstruct a track is approximately 10 cm, which corresponds to 4-8 hits, depending on the angle of the track with respect to the detector axes. At 2.2 MeV deposited per cm for a minimum ionizing particle, that corresponds roughly to a minimum kinetic energy of 20-25 MeV for a particle to be detected. The track finding efficiency of a muon generated in a charged-current neutrino interaction in SciBar is approximately 94%, estimated using data. Track finding efficiencies for various particles found using the SciBar Monte Carlo are shown in Figure 1.2.
Figure 1.4 shows the distributions of muon momentum () and angle with respect to the beam (), with the requirement that a track created in SciBar match a track (or hits) found in the MRD. The data and MC agree well except for the forward ( degrees) region, which may point to new physics, rather than a detector deficiency [14]. The energy resolution and angular resolution of the muons are 0.08 GeV and 1.6 degrees, respectively. The muon energy resolution is dominated by the MRD resolution. More detailed detector performance can be found elsewhere [15].
1.2.3 Modifications to Detector Configuration
The detector configuration will be modified slightly for SciBooNE. The detector complex will consist, as before, of three detectors: SciBar, the EC and the MRD. All SciBar components and most EC components will be brought from KEK to Fermilab, and their configuration will not change. In order to save costs, the MRD will be assembled from detector components salvaged from past FNAL experiments [16], rather than be shipped from Japan.
We have studied the effects of the changes in the MRD size and acceptance on the physics potential of SciBooNE. We have found that the size of the available iron plates, 3.5 m 4 m and plate thicknesses of 2.5 and 5 cm, does not significantly degrade the sensitivity of the experiment. We will use plastic scintillators for the active detector elements instead of drift tubes. Since 60 cm of iron is sufficient to stop muons with kinetic energy of 1 GeV/c, we will use only 12 planes of iron, each with thickness 5 cm. Monte Carlo studies indicate that this smaller MRD size reduces the efficiency for SciBar-MRD track matching by only 10-20%, depending on the interaction type.
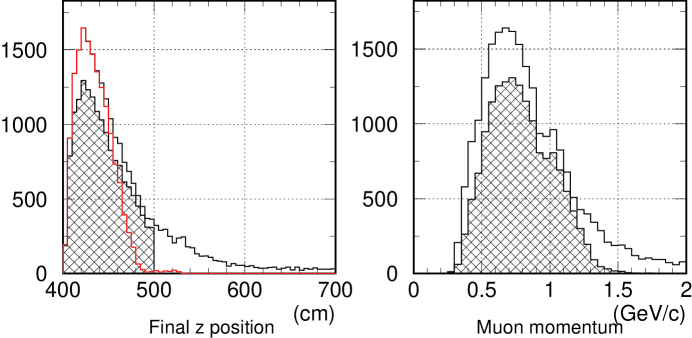
Figure 1.5 shows the effect of the smaller MRD size on the muon acceptance. The figure compares the muon stopping position along the beam direction of the K2K sized MRD (7.6 m7.6 m) and the SciBooNE sized MRD (3.5 m4 m), as well as the momentum distribution of stopping muons. It can be seen that the new sized MRD is sufficient to stop all muons with momentum below 1 GeV/c.
1.3 Discussion of Specific Locations
In pursuing this project, we have explored potential detector sites both on and off the beam axis. In this section, we explore the variations in flux and spectrum with detector location, with the goal of selecting the detector location which best maximizes the physics output. We do this by comparing predicted event rates at the various locations, based on current neutrino interaction cross sections and the known efficiencies of the SciBar detector, and estimating the measurements within reach based on those predicted event rates and spectra.
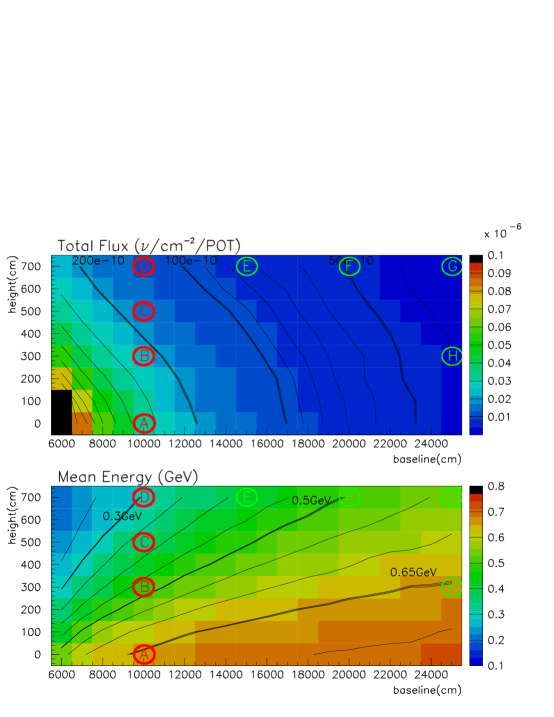
We begin with a general discussion of the Booster neutrino flux. Figure 1.6 shows the expected total flux and mean energy of all neutrino species as a function of distance from the target in the beam direction () and the vertical direction (). In the figure, the horizontal axis represents the distance from the neutrino target in the beam direction (), measured in cm, and the vertical axis represents the vertical () distance from the beam axis measured in cm.
From Fig. 1.6(top), we see that there are contours of constant flux, roughly ellipsoidal in shape with the major axis aligned with the beam direction, emanating from the neutrino target. As an example, the flux line at z=125 m, y=0 m indicates that we expect 20010/cm2/POT at that location. Following this flux line, we see that this same total flux is expected at many more locations, for example at z=100 m, y=4 m and z=75 m, y=7 m.
Following the contour lines of constant flux allows one to optimize the detector with regard to total neutrino flux. Alternatively, one can optimize with regard to the energy spectrum. Fig. 1.6(bottom) shows contours of constant mean energy, for neutrinos less than 2 GeV111For this plot, the calculation of the neutrino mean energy was found using only neutrinos below 2 GeV, to remove the effect of the high energy tails.; these contour lines appear to radiate from the neutrino target position. Following the previous example which examined a line of constant flux, we now follow a line of constant mean energy. Noting that at z=100 m, y=0 m the mean neutrino energy is 0.65 GeV, we follow the 0.65 GeV line and find that at z=250m, y=3m we expect the same mean energy.
In this discussion, we consider eight different detector locations: four locations at z=100 m, ranging vertically from 0 m (on-axis) to 7 m (on the surface), and four on the surface, ranging from 100 m to 250 m from the proton target. We also consider one location at z=250 m, y=3 m. As discussed in Section 1.4, several locations were eliminated immediately because they would produce extremely poor statistics.
Not surprisingly, we find that the on-axis location at a distance of 100 m from the neutrino target is the best choice, providing the largest possible physics reach.
Discussion of On-Axis Spectrum
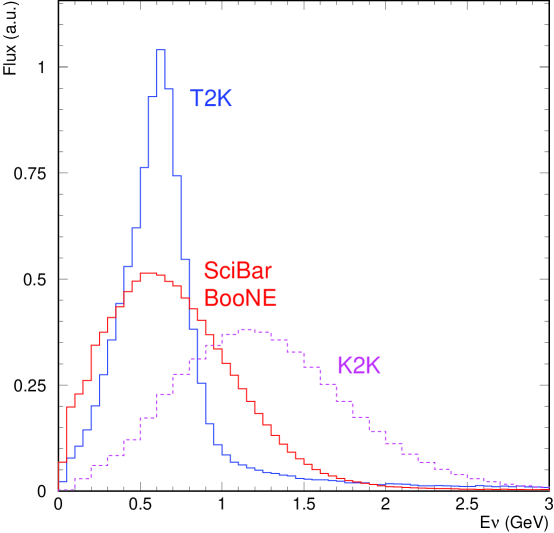
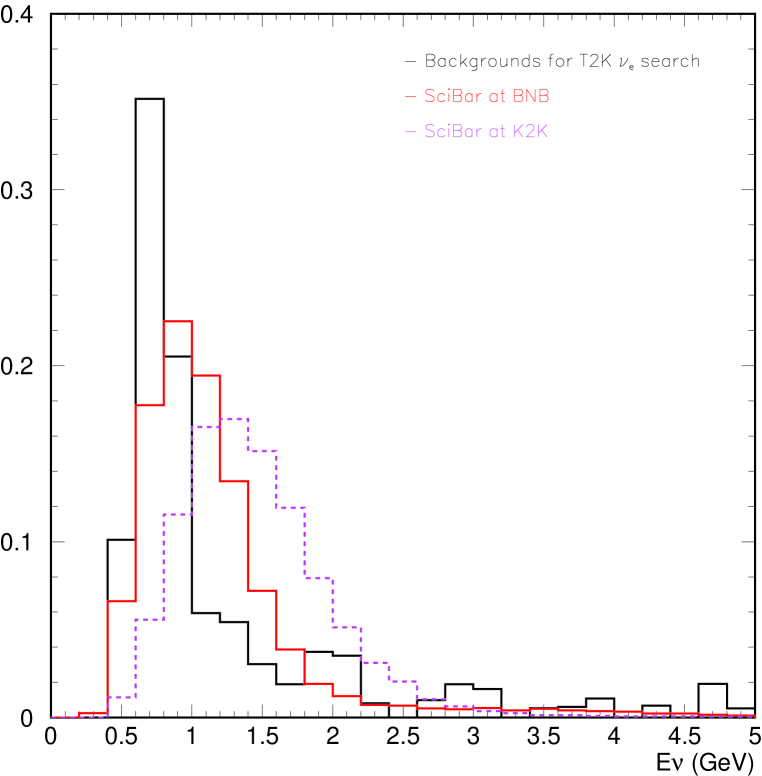
Figure 1.7 shows a comparison of the flux spectra for K2K, T2K and this on-axis location. This figure indicates why the BNB is of direct interest to T2K: the energy peaks of the two fluxes coincide and the entire range of the T2K energy flux is encompassed within the flux peak of the BNB. Thus, cross section measurements made at FNAL will have direct relevance to neutrino events at T2K. Note also that the high energy tail of the T2K flux extends much farther than the high energy tail of the BNB flux; this high energy tail increases the uncertainty on cross section measurements by increasing the number of misidentified inelastic events.
Discussion of Spectra at Off-axis Locations
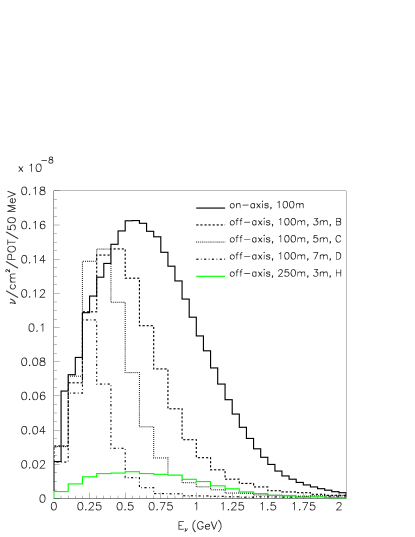
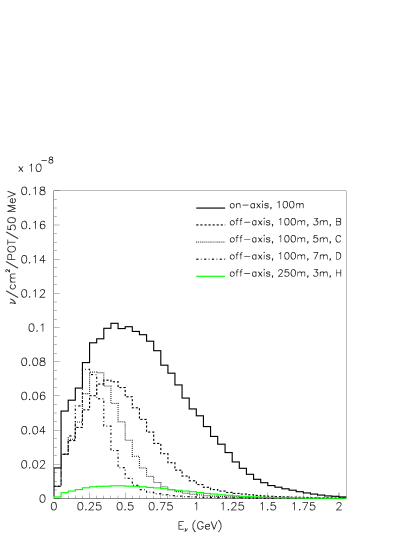
Figure 1.8(left) reveals in detail the effects of going off-axis in the vertical direction. The figure demonstrates that at increasingly off-axis positions, the peak of the neutrino flux moves to lower energy, and the overall flux decreases. This behavior was first seen in the discussion of Figure 1.6. The off-axis behavior of the flux expected for antineutrino running mode is shown in Figure 1.8(right), and is seen to exhibit the same behavior.
We have also considered several locations on the surface, at increasing distance from the proton target. These locations provide different off-axis angles, but roughly equal costs because they all involve the same excavation needs. We have also selected a location, at z=250 m, y=3 m, which gives a very similar energy spectrum to the on-axis location at z=100 m. However, all of these locations yield event rates that are too low to make interesting measurements on the time scales of this project.
1.4 Expected Event Rates
Expected event rates in the SciBar detector for a variety of Booster beamline locations were estimated using the NEUT Monte Carlo simulation which has been demonstrated to perform well in modeling SciBar data taken at K2K [17]. This section presents the number of events anticipated for various neutrino reactions and detector sites assuming a 9.38 ton fiducial target and a total of POT ( POT in neutrino mode, and in antineutrino mode).
| Reaction | # events |
|---|---|
| CC QE | 31,720 |
| CC resonant 1 | 14,108 |
| NC elastic | 13,751 |
| CC multi- | 5,279 |
| NC resonant | 3,723 |
| CC resonant 1 | 3,106 |
| NC resonant | 2,372 |
| NC multi- | 1,723 |
| CC coherent | 1,432 |
| NC coherent | 746 |
| total | 77,960 |
| Reaction | # events (RS) | # events (WS) |
|---|---|---|
| CC QE | 18,623 | 7,884 |
| NC elastic | 7,563 | 3,516 |
| CC resonant 1 | 4,494 | 0 |
| CC resonant 1 | 0 | 4,481 |
| CC coherent | 2,150 | 0 |
| CC coherent | 0 | 377 |
| NC resonant | 2,150 | 1,115 |
| CC multi- | 1,635 | 2,760 |
| NC resonant | 1,227 | 735 |
| CC resonant 1 | 1,127 | 960 |
| NC coherent | 1,109 | 207 |
| NC multi- | 710 | 891 |
| total | 40,685 | 22,925 |
| on-axis | B | C | D | E | F | G | H | |
| z=100m | z=100m | z=100m | z=100m | z=150m | z=200m | z=250m | z=250m | |
| d=0m | d=3m | d=5m | d=7m | d=7m | d=7m | d=7m | d=3m | |
| 0.92 | 0.76 | 0.64 | 0.60 | 0.60 | 0.61 | 0.61 | 0.94 | |
| 78,397 | 37,230 | 19,357 | 6,001 | 3,791 | 2,807 | 2,200 | 8,112 | |
| 1,138 | 636 | 467 | 176 | 113 | 88 | 67 | 109 | |
| 669 | 415 | 268 | 128 | 68 | 46 | 39 | 61 | |
| CC | 55,983 | 26,244 | 13,530 | 4,103 | 2,588 | 1,932 | 1,513 | 5,807 |
| MRD | 18,500 | 7,000 | 2,970 | 850 | 520 | 390 | 310 | 1,970 |
1.4.1 On-Axis
The largest number of events are expected for the on-axis detector location at 100m. Tables 1.3 and 1.4 present these anticipated rates for on-axis running in both neutrino and antineutrino configurations. Because wrong-sign backgrounds are non-negligible in antineutrino running, the neutrino rates in this mode are explicitly provided (Table 1.4). As can be seen from both tables, the most copious interactions in the Booster beamline are CC QE. A total of interactions are expected in the full on-axis neutrino exposure ( POT) and a total of for on-axis antineutrino running ( POT).
1.4.2 Off-Axis
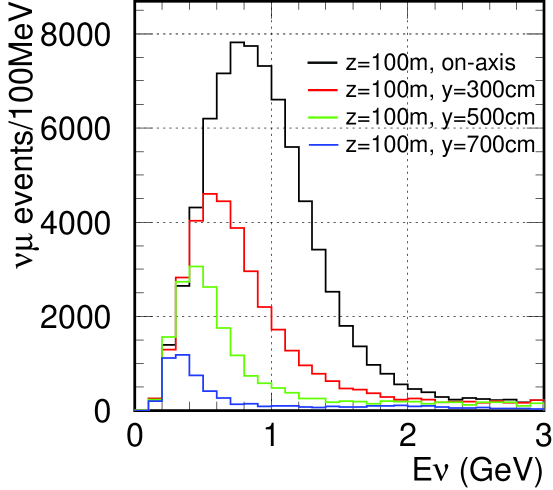
Table 1.5 shows the number of neutrino events expected for the variety of off-axis SciBar detector locations that were considered (Figure 1.6). The expected energy distributions of events at these sites are shown in Figure 1.9. In general, the collected event samples decrease and the energy spectra become softer as one moves off-axis. The event rate decreases by a factor two in moving 3m vertically from the beam axis at z=100m (site B), and is down by a factor at the surface (site D).
1.5 Non-Neutrino Backgrounds
We anticipate background activity in the detector caused by sources other than neutrino interactions in the fiducial volume. They fall into two broad categories: beam related and beam unrelated backgrounds, described below.
Beam Related Backgrounds
| 60 m | 90 m | |||
|---|---|---|---|---|
| beam-on | beam off | beam-on | beam-off | |
| # spills | 25,589 | 10,072 | 33,441 | 10,233 |
| singles (1) | 16 | 0 | 14 | 0 |
| singles (2) | 37 | 0 | 20 | 1 |
| coincidences | 5 | 0 | 4 | 0 |
The two most significant beam related backgrounds are dirt neutrinos and neutron skyshine. Dirt neutrinos interact in the earth around the detector hall, sending energetic particles into the detector, and skyshine is the flux of neutrons from the decay pipe or beam dump that are initially projected into the air but are scattered back toward the ground and interact in the detector. Experience with MiniBooNE indicates that dirt neutrinos form a negligible background for charged current events. The expected effect on neutral current analyses is also small due primarily to the lack of a high energy tail in the BNB flux.
Neutron Skyshine
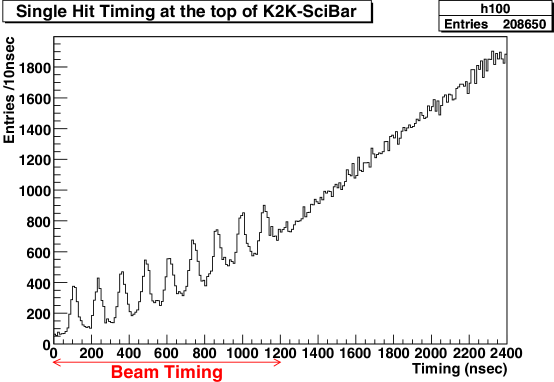
Neutron skyshine has been observed around particle accelerators for many years, particularly in relation to spurious signals seen in neutrino detectors [24, 25]. Recent analysis of the K2K SciBar data revealed a skyshine signature, which is illustrated in Figure1.10. To understand if this background would be seen in the BNB, we performed a simple beam related background test in July, 2005.
| BNB 60 m | BNB 90 m | BNB 100 m | SciBar | ground level | |
| (extrapolated [24]) | at KEK | at KEK | |||
| POT/spill | 4.0-4.51020 | 5.01020 | |||
| single hits | 4815 | 269 | 2110 | 2.3 | 18.0 |
| coincidence | 8.03.6 | 4.92.5 | 4.22.9 | N/A | N/A |
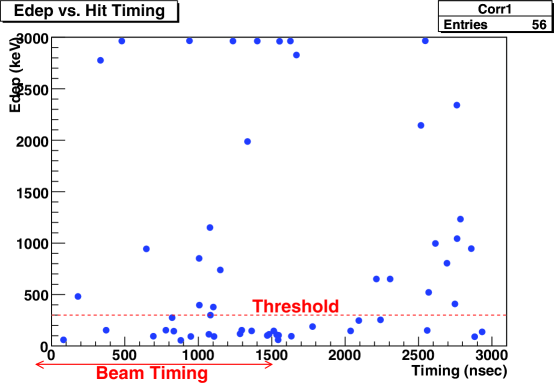
The test was performed by collecting hits above 300 keV from two plastic scintillator paddles placed on the ground at distances 60 m and 90 m from the neutrino target. The threshold was set around 300 keV because this is the energy deposit required to create a signal in a SciBar scintillator bar. Figure 1.11 show the distribution of energy deposited versus time relative to the start of the beam window for one of the scintillator paddles at 90 m during the beam-on run. Beam-on and beam-off data were collected over the course of two days, with the results summarized in Table 1.6. There is a clear excess of hits with the beam on as compared to off. Scaling the observed rates from the masses of the two scintillators up to the 15 ton mass of SciBar indicates that the skyshine rates (events/ton/beam spill) in the BNB are comparable to the ground level skyshine neutron rates seen above the SciBar near detector hall at KEK, as seen in Table 1.7. This indicates that additional shielding will not be necessary.
Beam Unrelated Backgrounds
Cosmic rays are the main beam unrelated backgrounds. The cosmic ray rate can be cut down quite effectively with beam timing cuts, due to the very low duty factor of the BNB. Approximately 0.2% of beam neutrino events will be contaminated by a cosmic muon, but these characteristic events can be vetoed easily. However, the 1 kHz rate of cosmic muons is actually useful, since it serves as a calibration data sample for strip efficiency and track reconstruction studies.
The average rate of cosmic ray neutrons above 50 MeV during periods of normal solar activity at sea level and geomagnetic latitude is approximately sec-1cm-2, and the momentum spectrum of cosmic ray-induced neutrons falls very steeply with energy [26, 27]. We therefore expect a cosmic neutron rate of 2 Hz in SciBar, for neutrons above 100 MeV. These will be a background for neutral current analyses. These events will be very hard to veto, since the neutrons sneak in unseen before interacting with protons and masquerade as neutral current neutrino events. Therefore, we assume we will not veto any of these events. The accidental coincidence rate should be . Thus, we expect to see 100-200 of these background events, depending on Booster performance, which is consistent with previous predictions of cosmic neutron rates at similar latitudes [28]. Moreover, these cosmic background rates can be measured exactly with beam-off data.
1.6 External Time Constraints
There is a time constraint that affects when SciBar can operate in the BNB: the SciBar detector will be needed back in Japan for insertion into the T2K beamline sometime in 2008 or 2009. While this deadline is uncertain, it does set the upper limit on the duration of a possible SciBar run in the BNB.
In the following three sections describing the physics that could be done by SciBar/BNB it is assumed that the detector would be exposed to 21020 POT in one year of running. The current schedule presented in Chapter 5 assumes that SciBar will be installed and begin commissioning in the fall of 2006.
Chapter 2 SciBar Physics
The fine segmentation of the SciBar detector enables low energy cross section measurements that can not be performed elsewhere. Three such opportunities are described here. Two of these would be the first measurements with antineutrinos, the third would be a first in neutrinos as well. All require the multi-track reconstruction capabilities of SciBar.
We focus on these three measurements because the relevant analysis techniques already exist or are in development at SciBar. However, tables 1.3 and 1.4 show that a number of other cross sections are accessible at SciBar on the BNB with statistics competitive or superior to previous or current measurements in this energy range.
2.1 Exclusive -p Antineutrino Measurements
Both K2K and MiniBooNE will provide direct measurements of the
inclusive neutrino NC cross section at low energy. K2K has
already published an measurement of the NC 1/total CC
ratio in their 1 kton water Cherenkov detector [22].
MiniBooNE is expected to have results soon from their neutrino mode
running. However, what is lacking in Cherenkov-ring based detection is
the ability to identify the final state nucleons in the event (most,
if not all, of the nucleons are below Cherenkov threshold). Because of
this, such detectors cannot provide separate measurements of the
contributing resonant cross sections, and hence, cannot separate
() versus
() reactions.
K2K, with their currently collected near detector data, will make
a separate measurement of the
cross section in SciBar at their mean beam energy. This result will be further
discussed in the next section. In contrast, MiniBooNE cannot measure
such an exclusive final state, but has plans to measure the inclusive
cross section in an antineutrino exposure [2].
This leaves the exclusive
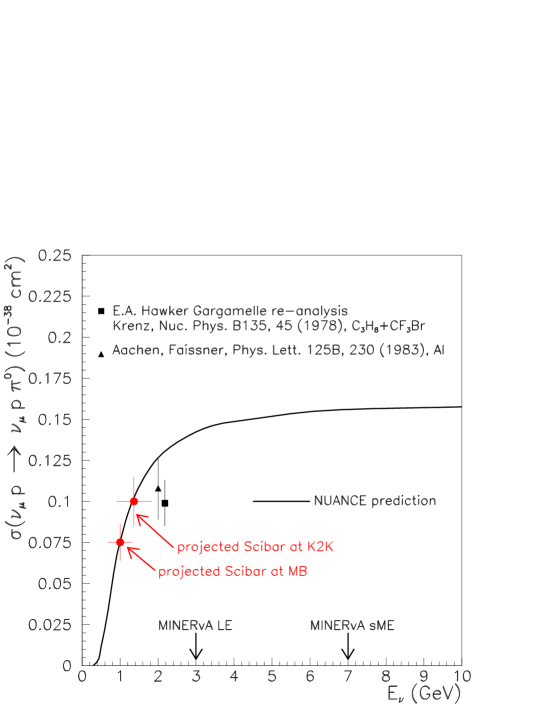
cross section unmeasured. Figure 2.1 shows
the current available data on this particular reaction, a single measurement
on aluminum at GeV appearing as a footnote [23].
SciBar/BNB expects interactions in antineutrino mode running for an on-axis detector location (Table 1.4). Using this sample, the experiment can make a measurement of this exclusive channel. Such a measurement would be the first of its kind in the 1 GeV energy range (Figure 2.1). The statistics in the other locations would be prohibitively small.

2.2 Energy Dependence of NC Cross Section
Because of the uncollected energy carried away by the final state neutrino
in NC interactions, experiments are forced to report flux-averaged NC
cross sections at a single energy point.
Figure 2.2 shows two such published measurements
that were both made near 2 GeV.
Given that future appearance experiments rely on precise
knowledge of their NC backgrounds at low energy, and given
the sharp turn-on of this cross section in this energy region, one
would like to have solid experimental confirmation of the energy
dependence of the NC cross section. SciBar can uniquely
provide such a measure in combining a NC cross section
measurement made in situ in the higher energy KEK beam with a
measurement made with the same detector in the Booster neutrino
beamline at Fermilab. With the 850 events already collected with the SciBar detector at K2K, we
estimate that a cross section measurement can be made at
the higher energy point. With the expected sample of such
interactions for the on-axis SciBar location at MiniBooNE (assuming
POT), a cross section measurement can be
obtained at the lower energy point
(Figure 2.2).
The dual measurements at 1.3 GeV and 800 MeV would provide the first mapping of this cross section in the region where it is varying most rapidly. Moreover, performing these measurements in the same detector, with the same reconstruction, systematics, and model assumptions, will provide an unprecedentedly powerful constraint. Additionally, such information could be combined with NC cross section measurements made at higher energy using the LE (3 GeV), sME (7 GeV), and sHE (12 GeV) beam configurations at MINERA [33] to completely map out the NC cross section across the entire energy range.
It may be possible to further bin the SciBar NC cross section measurements in energy by fully reconstructing the final state proton and in the event. As an example, such a binned NC measurement has been reported in the past for the channel by a previous bubble chamber experiment at Argonne [34]. So while it may be possible to map out the energy dependence more finely than as presented in Figure 2.2, this requires further detailed study.
2.3 Radiative Delta Decay
The resonance, which is produced in both CC and NC channels, can decay radiatively () with a branching fraction of 0.56%. Misidentification of neutral current radiative decay events are an important background for any appearance search. Distinguishing these events from interactions requires precise tracking, which is unavailable in large Cherenkov detectors. This radiative decay branching fraction has a 7% uncertainty [35], which seriously exacerbates the effects on appearance oscillation analyses. Also, radiative decay modes have only been observed via photo-production in the past, so a direct observation of this decay mode would be the first observation of such in a neutrino-induced (or antineutrino-induced) interaction.
With the tracking capabilities of SciBar, we can search for both a proton and a detached photon vertex consistent with the mass. We expect 60 radiative decays (NC+CC) in the 9.38 ton fiducial volume of SciBar during the 0.51020 POT neutrino mode run, and 30 radiative decays (NC+CC, and ) in the 1.51020 POT antineutrino mode run. In the best possible case, MiniBooNE hopes to constrain production using the CC1 data sample to 20%, but cannot constrain the radiative decay branching ratio. This results in a 25% systematic error on misidentified radiative decays. With the conservative assumption of 50% detection efficiency, we expect 45 such events in SciBar in one year, which allows a determination of the radiative decay branching fraction with an uncertainty of 15%. As mentioned above, this would be the first observation of these events in neutrino-induced interactions. Improvements in the efficiency of detecting this decay mode could produce a result competitive with the photoproduction BR measurement uncertainty.
Again, the statistics in the off-axis locations would be prohibitively small, leaving the on-axis location as the only viable choice for this analysis.
Chapter 3 Measurements that Help T2K
T2K [19] is a next-generation long baseline neutrino oscillation experiment at the J-PARC facility [20] in Tokai, Japan. T2K is an approved and funded experiment, currently under construction and aiming to begin beam commissioning in 2009. T2K uses Super-Kamiokande [21] as a far detector with a neutrino flight distance of 295 km to detect an intense neutrino beam with a peak energy of 750 MeV; this gives sensitivity to the neutrino oscillation maximum for . The two main physics goals of T2K are (1) a precise measurement of neutrino oscillation parameters in disappearance: and , and (2) a sensitive search for the unmeasured mixing angle in appearance: at the 90% C.L., depending on the values of the other oscillation parameters.
Given the good match between the MiniBooNE neutrino spectrum and that expected by T2K as shown in Figure 1.7, there are a variety of cross-section measurements that can be made by SciBar/BNB that would improve T2K. We consider three such measurements. The neutrino energies at K2K, MINOS, and MINERA are higher and these experiments have limited statistics in the range useful to T2K. We note the cases in which the SciBar measurements are superior to those made using MiniBooNE tank data alone.
The T2K collaboration is interested in having these measurements made with SciBooNE for several reasons. One reason is that they hope to use the T2K near detectors to constrain their neutrino flux, which requires accurate cross section measurements independent of their data. Such measurements do not currently exist and no other experiment besides SciBooNE is capable of making them to the required precision. The HARP pion production cross section measurements will give unprecedented precision to the neutrino flux prediction in the BNB, which will allow more accurate neutrino-nucleus cross section measurements below 1 GeV than has ever been possible before. The accuracy of the SciBooNE cross section measurements will allow T2K to use their near detector event rate measurements to extract the neutrino flux in the JPARC beam soon after it becomes operational.
Furthermore, understanding the effects of the nuclear environment on the neutrino interaction cross section is crucial to the success of T2K. Although T2K will primarily need to understand the cross sections on oxygen, an understanding of neutrino-carbon interaction will illuminate some of the nuclear effects. Also, the simple fact that the K2K collaboration is offering a $2M detector for use at FNAL is ample evidence of their enthusiasm for these measurements and commitment to getting them done.
3.1 CC
In T2K, the near maximal value of will cause a large distortion in the spectrum that will be measured with CC QE interactions. T2K will use this to measure accurately. The background to this channel (referred to generically as non-QE events) is dominated by single pion charged current events (CC), coming from either a resonance or by coherent production from the entire nucleus, in which the pion is not observed so that the final state looks like a CC QE interaction. To estimate the effect of this background, one needs only to understand the CC non-QE/CC QE ratio as a function of energy. Figure 3.1 shows the effect on the oscillation parameter measurements of making a 20% mistake or a 5% mistake in predicting this background. This figure makes it clear that the CC cross-section at these energies needs to be known to 5% to keep any resulting error on the oscillation parameters within statistical uncertainties.
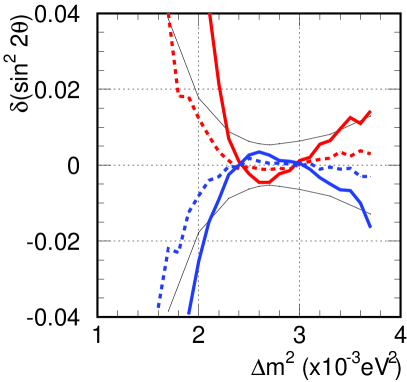
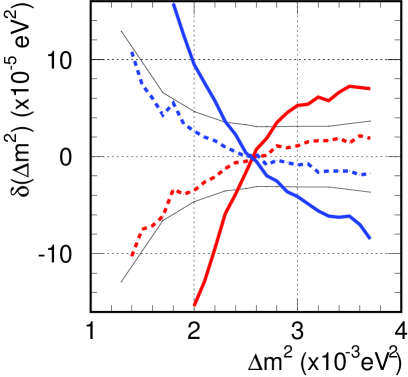
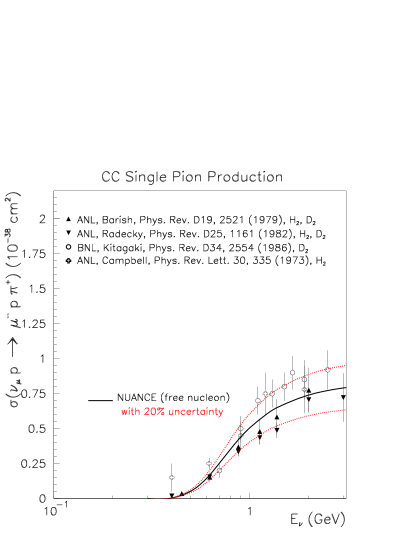
Fig. 3.2 shows the current state of knowledge of the CC1 interaction cross section in the 1 GeV range. This plot shows that the current uncertainty on the CC1 cross-section on bare protons (deuterium is almost bare) is 20%. For carbon and oxygen targets there are no data below 4.7 GeV; hence, the uncertainty increases to 25-30%, as nuclear model uncertainties become important.
Clearly, additional measurements are needed to get the uncertainty on the CC1 cross-section down to the desired 5% level. As shown in Table 1.3 the expected number of CC1 interactions in SciBar is over 14,000 assuming POT. With cut efficiencies, we still expect 5% statistical uncertainty per energy bin. SciBar’s superior final state resolution allows a more accurate reconstruction of the neutrino energy and momentum transferred than is possible with large Cherenkov calorimeter detectors. SciBar’s ability to separate the final state pion and muon from the protons that may be emitted means that, for a subset of the events, it can actually reconstruct the invariant mass of the resonant state. This is allows a direct constraint on Delta resonance production in carbon, which is a concern as the radiative decay channel provides a non-negligible background to appearance searches(see Section 2.3).
Since the neutrino energy can be reconstructed for CC1 interactions, K2K, MINOS, and MINERA could, in principle, measure the cross-section despite having higher energy neutrino spectra. That being said, at these low energies these experiments will suffer from larger feed down from inelastic backgrounds. Some details on how well K2K might be able to do can be found in [14]. For MINERA, 1 GeV is about as low as the measurement could go. MiniBooNE will make such a measurement, but it does not have SciBar’s ability to cleanly resolve final states. Currently MiniBooNE anticipates being able to make a 10% measurement of the CC1 cross-section as a function of neutrino energy, where the limit comes from the systematic errors associated with the complexity of the final state.
A more precise CC1 cross section measurement can be made with a SciBar/BNB on-axis location. The off-axis location B would be acceptable as it maintains some of the flux in the energy region of the T2K beam, but the statistics drop significantly as the threshold for the process is approached. By the time locations C and D are reached, the flux is too far from the T2K spectrum to provide useful measurements. At the off-axis location H, that maintains the same mean energy as location A, the rate has dropped by an order of magnitude. The statistics will still allow for a 5% measurement of the integrated CC1 rate at that position, but any binned measurements will suffer statistically.
3.2 NC
The primary purpose of T2K will be the search for to transitions, and a measurement of the unknown mixing angle . This measurement will have significant background contributions coming from intrinsic , and events misidentified as interactions.
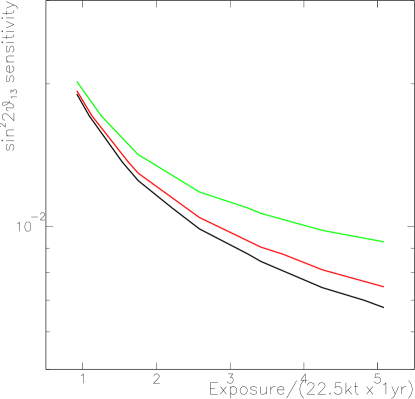
As a function of exposure time, Fig. 3.3 shows the effect on T2K’s sensitivity to , assuming three different levels of uncertainty in the subtraction of the misidentified and intrinsic backgrounds. For these exposures the difference between 10% and 0% uncertainty is minor, but between 10% and 20% there is a noticeable change. For this reason a 10% uncertainty on the NC cross section is desired.
Currently, the cross-section for NC production is poorly known, with uncertainties well in excess of 10% and with only one or two measurements at energies in the few GeV range. Because this is a neutral current process it is not possible to measure the incoming neutrino energy on an event by event basis, since the outgoing neutrino energy is unknown. This means that the higher energy neutrino beams of K2K, MINOS, and MINERA do not allow these experiments to place useful constraints on the NC rate that might be expected in T2K. That these experiments measure the NC rate at higher energies is very interesting, however, as this allows the cross-section as a function energy to be mapped, as described in Sec. 2.2.
Since the neutrino spectrum in the BNB is so well matched to that of T2K a measurement of the NC production rate here is much more directly applicable to T2K. The difference between these two beams in the high energy tail does mean, however, that the NC production rate in the BNB will not be exactly the same as that in the T2K beam.
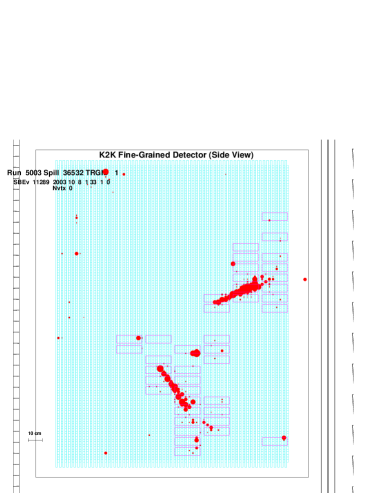
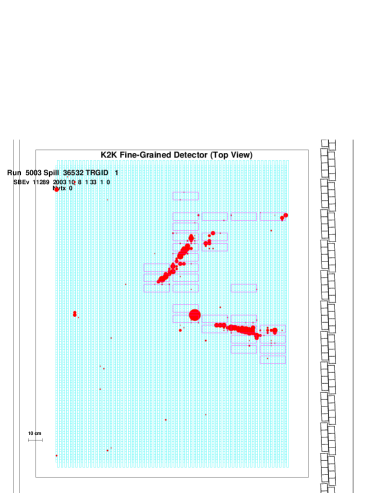
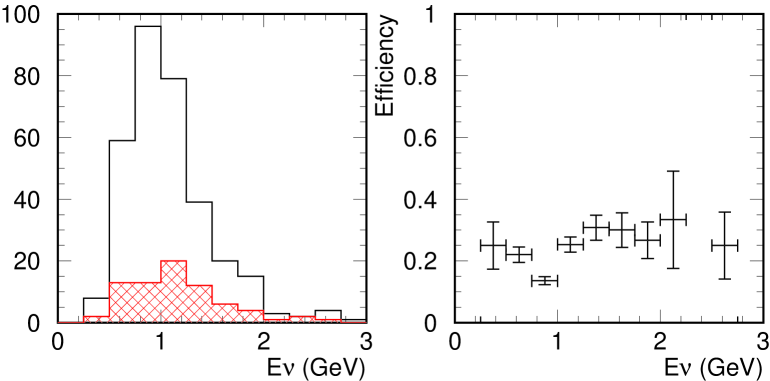
Table 1.3 shows that 3700 NC events would be expected from POT with SciBar on-axis in the BNB and 100 m from the target. We expect a 10% uncertainty on the total rate. The same holds true for MiniBooNE, which has already about ten times the statistics than expected at SciBar/BNB. However, SciBar has one key advantage: it tends to be the high momentum s that are most easily confused with electrons, but it is hard to identify a sample of these in a Cherenkov detector as it becomes harder to tell the two rings from one another (the same reason they are misidentified as electrons). SciBar has superior final state separation capabilities, and an electromagnetic calorimeter in the forward direction, and hence can distinguish the two EM showers from the decay for higher momenta. Thus, SciBar will be able to make a better measurement of the NC production rate at the critical highest momentum than is achievable at MiniBooNE.
Figure 3.4 shows two views of a SciBar event display of a NC candidate event from the neutrino data run at K2K. In the display, two clear photon tracks point back to a common origin, which is the neutrino interaction vertex. It is possible to distinguish electron from photon tracks by measuring the average energy deposited along the track; photon induced tracks will have twice the deposited energy per track length because they contain two charged particles, from the photon’s pair conversion. Note that Figure 3.4 is a display of a real data event. Figure 3.4 also shows the expected NC energy distribution for all interactions and identified events as well as the NC1 efficiency as a function of neutrino energy for SciBooNE. The plots shown in figure 3.4 show Monte Carlo events and not data efficiencies, because the NC analysis of K2K SciBar neutrino data is ongoing, and there are not yet public plots available.
Figure 3.5 demonstrates the utility of the SciBooNE NC1 measurement in understanding the NC1 misidentification background for the T2K appearance search. The plot shows the neutrino energy distribution for NC1 events that are misidentified as events, with the neutrino energy distributions for events identified as NC1 interactions in SciBar at BNB and K2K. The figure shows that the SciBooNE measurement will span the peak of the T2K misidentification events, where the bulk of the background appears, but the K2K measurement does not. In other words, the existing K2K NC1 measurement is insufficient for understanding T2K’s NC1 background.
The on-axis location A is the best position for SciBar to measure NC production as this location maximizes the rate. The off axis location B is intriguing, however, as its flux has a better match to the high energy tail of the T2K flux than the on-axis location A. Many NC events come from this tail and so, even though the mean energy is wrong at location B, it may prove to be a better location for inferring a T2K NC production rate from SciBar/BNB. The hit in statistics from the farther off-axis locations C and D render them unusable for this measurement, the same holds true for location H.
3.3 Antineutrino Measurements
T2K is expected to run in neutrino mode for its first five years of operation. If there are indications of a finite , T2K will likely be upgraded, increasing to a 4 MW proton source and a much larger water Cherenkov detector (Hyper-K). With these upgrades the experiment would search for CP violation in the neutrino sector, requiring oscillation measurements of both neutrinos and antineutrino beams. It will therefore be critical to have good knowledge of antineutrino cross-sections at this stage.
The state of antineutrino cross-section knowledge in the 1 GeV energy range is very poor with only a handful of low statistics measurements [2]. If MiniBooNE runs in antineutrino mode in FY06, its primary goal will be to vastly improve this cross-section knowledge. There are a few ways in which SciBar can further improve these MiniBooNE measurements. The two channels of the previous two sections (CC1 and NC) will be important backgrounds to the disappearance and appearance channels in antineutrino mode and the advantages of a SciBar measurement described in the previous two sections for neutrino mode will hold for antineutrino mode as well.
In addition, as was pointed out in Sec 4.1, SciBar can measure the spectrum of contaminant neutrinos in antineutrino mode in the BNB and thus improve an antineutrino CC QE cross-section made with MiniBooNE tank data. SciBar can also use its antineutrino CC QE events to measure this cross section. The statistics will be lower than the data from the MiniBooNE tank (assuming they have the same beam exposure), but this will be a systematics limited measurement and SciBar can benefit from some cancellation of systematics by virtue of the fact that it measures both the antineutrino CC QE events and the neutrino CC QE contamination in the same detector.
The proposed SciBar/BNB antineutrino run of POT will provide healthy numbers for an antineutrino CC QE measurement and sufficient numbers for the CC1 and NC measurements. This will also ensure that the separation of neutrino CC QE from antineutrino CC QE in antineutrino mode will be robust. In any of the other locations there will probably be insufficient statistics to make SciBar measurements superior to the ones that will be done using MiniBooNE neutrino mode tank data.
K2K never ran in antineutrino mode and, since the experiment has been terminated, will not in future. The NuMI beamline is capable of switching to antineutrino mode and so MINERA and MINOS will probably make antineutrino measurements at some point in the future, but NuMI is a shared beamline and the needs of the oscillation measurements will likely come first. It is therefore unlikely that these experiments would be able to operate in antineutrino mode for several years. When they do they will be at higher energy which will provide an attractive complement to the lower energy SciBar and MiniBooNE measurements.
Chapter 4 Leveraging MiniBooNE
MiniBooNE is a neutrino oscillation experiment at Fermilab, whose primary physics goal is the confirmation or refutation of the LSND oscillation signal [18]. A description of MiniBooNE’s detector and analysis methods can be found elsewhere [8].
We describe three measurements that SciBar can make that will improve current or planned MiniBooNE measurements. Only one of these measurements, disappearance, is aided by concurrent MiniBooNE/SciBar running. The results of the other two SciBar measurements could be applied to MiniBooNE analyses after the fact, although concurrent running is preferred to ensure that the neutrino beam conditions are identical.
4.1 Wrong-Sign Backgrounds
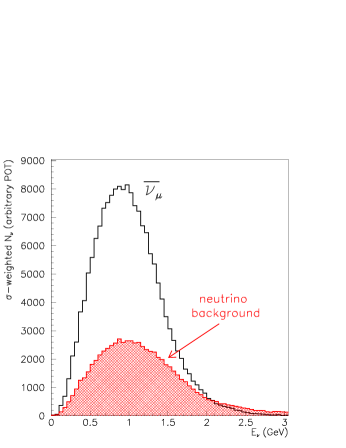
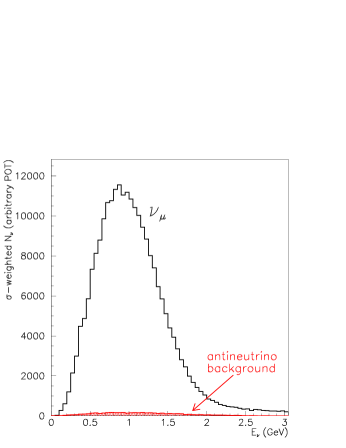
Having precise knowledge of neutrino (“wrong-sign”) backgrounds in data collected in antineutrino mode running is important for any antineutrino cross section measurements, including those being planned with phase II running at MiniBooNE [2]. At MiniBooNE, these wrong-sign backgrounds comprise of the anticipated antineutrino mode CC QE event rate (36% of the total rate are WS events, Figure 4.1), and contribute a direct source of error on any potential antineutrino cross section measurements. Using a combination of several novel techniques for directly measuring the wrong-sign rates in the MiniBooNE detector [2], MiniBooNE has reduced this background contribution to a few- uncertainty on their projected antineutrino cross sections measurements.
SciBar is uniquely suited to provide an additional measurement of the wrong-sign contamination in the antineutrino Booster beam by exploiting the fact that, unlike MiniBooNE, the fine-grained detector can differentiate between final states with protons versus neutrons, and hence can distinguish neutrino versus antineutrino QE interactions on an event-by-event basis:
| (4.1) | |||
| (4.2) |
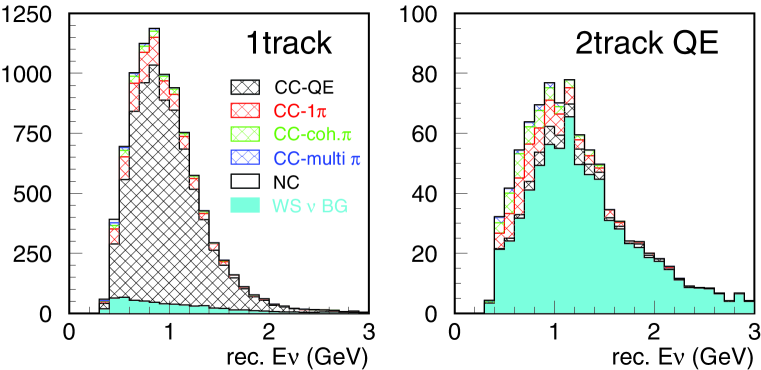
Based on their differing final state composition, QE neutrino interactions are expected to have two tracks (one each from the muon and proton) while antineutrino interactions are expected to have only one track (from the muon). Figure 4.2 shows the reconstructed energy distributions for QE events passing one and two track selection in the SciBar detector. These plots were made with the full analysis cuts developed for the SciBar CC QE analysis using K2K neutrino beam data. Assuming a POT antineutrino run on-axis, the one track requirement yields a sample of events, of which are QE interactions, are CC backgrounds, and are QE wrong-sign backgrounds. Further requiring less than 10 MeV deposited in the vertex strips reduces the sample to 10,000 events, but with only 7% WS background events total. This sample provides a direct measurement of the antineutrino spectrum that is impossible with MiniBooNE tank data alone.
On the other hand, requiring two tracks in the event isolates a sample of events that is pure QE wrong-sign backgrounds. Applying the converse vertex activity cut yields a sample of 900 events that are 80% pure WS. This yields a direct measurement of the energy spectrum of the neutrino background (Figure 4.2 right panel) superior to that achievable with MiniBooNE alone. Using the angular distributions of the outgoing muons from CC QE events, MiniBooNE expects to constrain the WS background to 7% uncertainty for their full 2006 data run [2], with no information about energy dependence. By splitting the event sample into energy bins, the energy dependence of the WS contamination can be extracted as a function of energy. Using four energy bins between 0 and 1.5 GeV, MiniBooNE can extract the WS content with 15% uncertainty in each energy bin. Using the two track sample, SciBar can extract the WS content with 15% statistical uncertainty in 100 MeV bins up to 1.5 GeV, a marked improvement over the MiniBooNE-only constraint.
In this way, SciBar can provide a superior constraint on the energy spectrum of wrong-sign background events in antineutrino running at MiniBooNE. Combining this spectral constraint with measurements of the overall wrong-sign rate obtained in the MiniBooNE detector will lend further confidence and precision to MiniBooNE antineutrino cross section measurements, especially those that are binned in energy.
This wrong-sign event contamination actually increases as the SciBar detector is moved off-axis because one loses the focusing benefits of the horn (the wrong-sign fraction increases from on-axis to by the time one reaches the surface at z=100m). Despite this, off-axis measurements of the neutrino energy spectrum in the antineutrino beam are not easily transportable as constraints on the on-axis MiniBooNE beam. This is largely due to the fact that the spectrum shifts toward lower energies as one moves off-axis (Figure 4.3). In addition, for a detector location at z=100, the 300cm off-axis wrong-sign event samples are down by a factor of two, and are decreased by a factor of four at the surface. This combination of sampling a different wrong-sign energy distribution than the on-axis MiniBooNE location and the degradation in the event sample make it less clear how useful off-axis running is toward constraining neutrino backgrounds in antineutrino running at MiniBooNE. To gain full benefit, one really needs to be on-axis to provide a useful spectral measurement.

4.2 Disappearance
In models with sterile neutrino flavors, the rate of or disappearance can be significantly greater than or appearance. Thus, such searches provide information on additional mixing parameters beyond confirmation of the LSND signal.
The availability of a near detector significantly extends MiniBooNE’s disappearance reach by offering a measured constraint on the un-oscillated flux normalization and energy spectrum of the BNB. This benefit is only realized if SciBar is placed in the on-axis location.
In the following section, we present two disappearance studies using the MiniBooNE CC QE selection cuts for both and modes [8], [32]. We do not present detailed near/far event spectrum ratio studies; rather, we show only how changes in the systematic errors affect the oscillation sensitivities. More quantitative studies are ongoing. We note that the event rates in SciBar and MiniBooNE are dominated by neutrino interactions on carbon, so the plastic scintillator (CH) of SciBar is quite comparable to the mineral oil of MiniBooNE (CH2).
Running
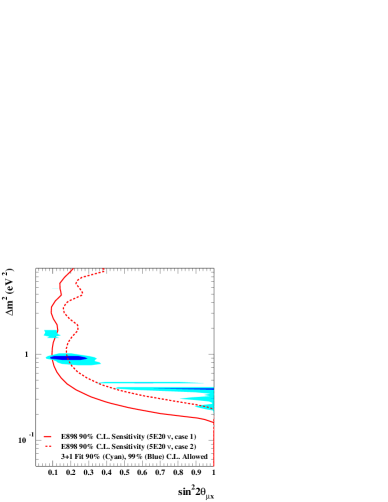
For neutrino running, the use of a near detector will not improve the sensitivity to disappearance with only 0.51020 POT [31]. It is crucial to use concurrent data for such analyses, and the short neutrino run will not provide sufficient statistics to perform a joint disappearance search with SciBar and MiniBooNE data that will approach the expected sensitivity of the MiniBooNE neutrino run up to that time. It will, however, independently measure the un-oscillated flux, and thus provide an external constraint on the flux normalization and spectrum. We show the expected 90% confidence level sensitivity curves under two different systematic error assumptions in Figure 4.4(left). The figure demonstrates the effects of increased normalization and shape systematics, and thus indicates the utility of an external measurement of the neutrino flux.
Running
A disappearance search in antineutrino mode, when compared with a disappearance search in neutrino mode, provides a powerful test of CPT invariance. While CP violation can only be observed in an appearance experiment — by observing an asymmetry between the appearance rates in neutrinos and antineutrinos — the appearance mode is unable to distinguish if the asymmetry is the result of CP or CPT violation. As a result, one needs to additionally search for an asymmetry in a disappearance experiment. Moreover, the potential for a larger disappearance rate means that a disappearance asymmetry may be observable even if an appearance asymmetry is not.
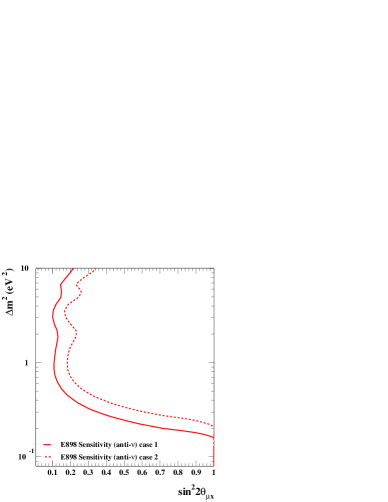
As described in Section 4.1, the SciBar detector would allow us to extract the energy spectrum of the wrong-sign backgrounds in running. Exploiting this reduces the systematic error on the shape of the flux for disappearance analyses. In Figure 4.4(right), we show the expected sensitivity to oscillations for two cases of systematic errors. The sensitivity region is noticeably curtailed for the case of poorer systematic errors.
4.3 Intrinsic Contamination
The precision of MiniBooNE’s appearance measurement is limited by knowledge of the flux of intrinsic s from decays of K+, K, and in the 50 m beam decay pipe. MiniBooNE has a variety constraints on these different components, and has reported a goal of uncertainty on the intrinsic background, 5% on from decay, 5% on K+ decay and 6% on K decay [8]. Even with this level of systematic uncertainty, it will be important to have a cross check on the backgrounds, especially if MiniBooNE sees a signal.
For POT, there should be 490 charged current interactions in SciBar. Based on detailed Monte Carlo simulations, SciBar is expected to have a cut efficiency of 21% and a purity of 88% for electrons above 0.5 GeV (performance numbers for lower energy electrons are not available at this time, because the analysis is still in progress). Additionally, only a subset of the passing through SciBar will also pass through the MiniBooNE tank. Considering these uncertainties, we expect to make a 10-20% measurement of the intrinsic component of the beam.
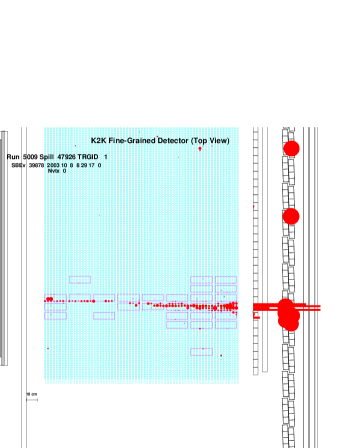
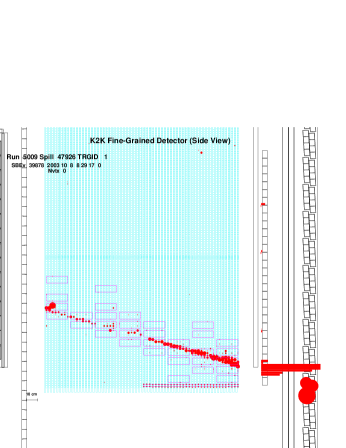
Figure 4.5 shows two views of an event display of a CC QE candidate event in SciBar. The electron’s track, which starts with low energy deposition but grows broader as it starts to shower and culminates in a huge energy deposit in the EC and the first layer of the MRD, is quite distinct from the muon track seen in Figure 1.3.
Although a 10-20% measurement of the intrinsic flux does not compete with MiniBooNE’s reported goal of , it has one very important feature: it is a direct measurement of the s in the same beam that goes through the MiniBooNE tank. All the other ways in which MiniBooNE can determine the flux are indirect. The SciBar measurement is only valuable to MiniBooNE if the detector is on-axis. At the off-axis locations, the event rates drop rapidly; more importantly, the flux through SciBar would no longer be the same flux that passes through the MiniBooNE tank.
Chapter 5 Cost and Schedule
There is a window of opportunity to bring SciBar to Fermilab, but this window will only remain open as long as the BNB continues to operate. Fermilab’s current schedule closes the BNB by the end of 2006. A study carried out by Fermilab and KEK indicates that an operating SciBar could occupy the beam within nine months of approval.
We therefore request approval before the end of the CY2005, to allow funding grants for participation in SciBar at BNB to be submitted with a positive statement of approval at FNAL. This, combined with our 9 month schedule, means that we would expect to be taking cosmic ray data with SciBar in the on-axis detector enclosure by 1 October, 2006.
There are three sub-detectors in SciBar, described in Section 1.2. SciBar and the EC will be shipped from KEK, whereas the MRD can be easily assembled at Fermilab using materials from retired fixed-target experiments. The installation of an enclosure in the BNB, shipping and assembly of detectors at Fermilab, and construction and assembly of the MRD will take about nine months.
The schedule depends on successfully decoupling the larger tasks, so that they can proceed in parallel. Reconstruction of SciBar and the EC will take place in the NuMI surface hall (MI-65). They will each be mounted on a platform, so that at completion they will be lifted onto a flatbed truck, and taken, fully constructed, to the detector enclosure for installation. Each subdetector will be mounted on a platform so that it can be brought by truck to the detector enclosure. The MRD will be built in two modules to assure that we keep the weight of each module below 15 tons. Placing the sub-detectors on the floor of the detector enclosure will require rental of a 100 Ton mobile crane for about one week.
The materials needed for the MRD have already been identified, and their assembly could be done before the arrival of the detector from KEK, so that technician and physicist time would be free for the assembly of SciBar and the EC.
Once the decision to proceed is made, SciBar could arrive at Fermilab within four months of the decision. This allows four months for assembly of SciBar and the EC at Fermilab. In month 1, KEK will prepare to disassemble the detector, making all of the arrangements to commit students and technicians to work on the project. In month 2, KEK will disassemble cables, front-end electronics, PMTs and fibers. In month 3, the scintillator in SciBar and the EC will be disassembled. Shipping should take approximately one month. Installation at Fermilab will include about two weeks to install the scintillator into the frame to reconstruct the SciBar detector. Then a month will be needed to connect the fibers, PMTs, and front-end electronics. At this point the detector can be tested with cosmic rays. After the detector is installed in the beam, about two weeks will be needed to connect cables, back-end electronics, and the DAQ system. These time estimates are based on experience from installation at K2K.
The critical path for occupancy in the beam will be the construction of the detector enclosure. A design study was carried out by FESS and PPD engineers to derive a cost estimate and schedule for the detector enclosure. These are given in Appendix A. The detector enclosure will be a vertical shaft, twenty feet deep. The shaft will be capped with a shed made of light materials and with a removable roof. Installation of the detectors will be done by a mobile crane—the detectors lowered through the roof onto the floor of the shaft. After the detectors are installed, a mezzanine will be placed a few feet above to provide room for electronics racks. Cables from the detector will run directly into the bottom of the relay-racks. One relay-rack will be required on the enclosure floor next to the SciBar detector. The Data Acquisition System will come from Japan; on-site data storage and analysis will be done with Fermilab’s Enstore system and local computing.
Two vertical ladders will provide access to the detector enclosure. The top ladder starts at grade and terminates at the mezzanine. The lower ladder leads from the mezzanine to the enclosure floor. The shaft will have minimal need for lighting and environmental controls, since most of the work associated with assembly of the detectors will be done in the NuMI surface hall (MI-60). In one year and four months of running at KEK, access to the detector was required only twice. Dehumidification will be needed only to keep the enclosure air below the dew-point. A gas fire protection system will be used to avoid any need to bring ICW water to the building. This is currently under review. Power will be brought in from the nearby MI12 service building as a 480 V service, using a small step-down transformer at the enclosure to convert to 120 V house power. A communication line will also be run between MI12 and the SciBar enclosure for telephone and Ethernet connections. A new, full three dimensional model for the detector enclosure is being developed and will be done before December, along with an updated cost estimate and a review of the detector environmental conditioning requirements and safety considerations. These updates will be available before the December PAC meeting.
The construction schedule of the detector enclosure requires about nine months between approval and beneficial occupancy; the design process takes about two months; two months are also required for the procurement process: placing an ad for an RFP, evaluating and selecting a bid, etc. The period of construction is about 4.5 months. See Appendix A for more details.
FESS has prepared a cost estimate for civil construction, which is given in Appendix A. The anticipated cost for the civil contract is about $290,000. Engineering costs at (21% of contract price) would be about $60,000. Contingency and overhead at nearly 50% add approximately $160,000 to the total project cost.
The assembly of the detectors onto platforms, and installation into the detector enclosure will add $5,000 each for the four sub-detectors. Crane rental for a week is $5,000. A rigging crew may be needed for about one week. This adds up to $30,000 in Laboratory M&S.
KEK will be responsible for the cost to disassemble, package and ship the detector to Fermilab, and to return it to Japan.
Chapter 6 Conclusions
The marriage of K2K’s fine-grained SciBar detector and the Booster Neutrino Beamline presents a unique, low risk, and low cost opportunity for low energy neutrino and antineutrino measurements that are useful to the neutrino community at large.
The present knowledge of neutrino cross sections in the few GeV region is not commensurate with the physics goals of future oscillation experiments [36]. Based on recent experience, low energy neutrino cross sections may still have some surprises in store. For example, MiniBooNE realized an important new class of background events for experiments that seek to identify ’s, from radiative decay, that had been previously overlooked. Further, both MiniBooNE and K2K observe a deficit of events in data with respect to Monte Carlo at GeV2, which is attributed to a lack of theoretical understanding of the nuclear environment [32, 14]. As we consider the future, with plans for precision oscillation measurements, we must ask ourselves what new surprises await. The cross section measurements proposed here will help to lay the foundation needed for the future off axis programs, and ensure that any new surprises will be found soon enough to determine strategies to handle them.
This effort complements the existing and future neutrino programs at Fermilab, providing important input to MiniBooNE as well as crucial cross section measurements for off-axis neutrino experiments, most especially T2K. This project utilizes a pre-existing detector and an operating beamline which are both well understood and have both demonstrated high quality performance. Additionally, this modest investment will complement the lab’s existing neutrino program by providing a significant and high quality data set that will be useful for training students. It will also draw to Fermilab a significant number of neutrino physicists who would otherwise concentrate their efforts in Europe or Japan in 2007.
The window of opportunity to bring SciBar to Fermilab will only remain open as long as the BNB continues to operate. We therefore request an extension of the data run of the BNB through the end of FY2007, regardless of the result of the MiniBooNE appearance search. Furthermore, we request approval before the end of calendar year 2005, to allow our collaborators to request funding to work on SciBar at BNB. Prompt approval combined with our 9 month schedule means that we would expect to be taking cosmic ray data with SciBar in the on-axis detector enclosure by 1 September, 2006, and neutrino beam data as soon as the summer accelerator shutdown is over.
Appendix A Off-Axis NuMI Locations
Positioning the SciBar detector in the NuMI beamline was also considered as a possibility. We have studied neutrino fluxes in the NuMI surface hall, as well as several locations in the existing NuMI off-axis tunnel. Table A.1 shows the locations and off-axis angles of four of the specific locations considered. For sufficiently small angles, one can calculate the expected flux and energy for the two-body decay of a single of energy ,
| (A.1) | |||
| (A.2) |
for a detector of cross sectional area , at a distance from the decay point of the pion and angle with respect to the pion’s momentum. Note that , and that the formulas can also be used to calculate the flux and energies for neutrinos from two-body decays of , with the appropriate substitutions. Table A.1 also gives the expected peak energy from decay for each of the locations considered.
| Location | x(m) | y(m) | z(m) | (mrad) | peak E (GeV) |
|---|---|---|---|---|---|
| Near 2a | 14 | 0 | 740 | 16 | 1.8 |
| Near 3a | 14 | -6 | 940 | 19 | 1.6 |
| NuMI surface building | 0 | 71 | 940 | 76 | 0.4 |
| MiniBooNE | 26 | 78 | 745 | 111 | 0.25 |
Figure A.1 shows the flux and energy curves as functions of parent pion energy, given by equations A.1 and A.2, for the four locations in Table A.1. The peak neutrino energies for sites 2a and 3a are at 1.8 GeV and 1.6 GeV from pions of energy 7 GeV and 9 GeV, respectively. However, the neutrino flux for site 2a (16 mrad) falls relatively slowly as a function of pion energy, so that the expected neutrino flux from pion decays in flight for the low energy (LE) NuMI configuration at Site 2a peaks around 1.3 GeV, as shown in Figure A.2. This neutrino flux was calculated using the full gnumi beam Monte Carlo used by the NuMI collaboration, with the beam configured in LE mode. The neutrino flux for site 3a (19 mrad) is not quite as flat as a function of pion energy, so the integrated neutrino flux is expected to peak closer to the peak pion energy than for site 2a. Flux studies for site 3a using gnumi are ongoing.
Unfortunately, there are several drawbacks to these locations. Most obviously, one loses the direct physics benefits to MiniBooNE with a NuMI site (Chapter 4). Additionally, the numbers in Table A.1 indicate that the available locations (see Table A.1) do not offer a energy distribution that is suitably close to the expected T2K flux to make the cross section measurements needed for T2K (Chapter 3). Sites 2a and 3a are too high in energy and the NuMI surface hall is too low in energy.
Figure A.3 compares the predicted energy distributions for CC events at the NuMI surface and Booster on-axis SciBar locations. This figure also shows the high energy neutrino peak from kaon decays. The NuMI surface hall event rate peaks below and above the T2K energy peak (cf. Figure 1.7), although this figure does not include the effect of detector acceptance, which would largely cut out the high energy (kaon) peak. Studies of cross-section weighted event rates for site 2a and 3a are ongoing.
While we do have several ongoing studies, all of which will be completed by December, it seems unlikely that the NuMI off-axis locations offer a neutrino flux suitable for the physics goals we have set out to accomplish.
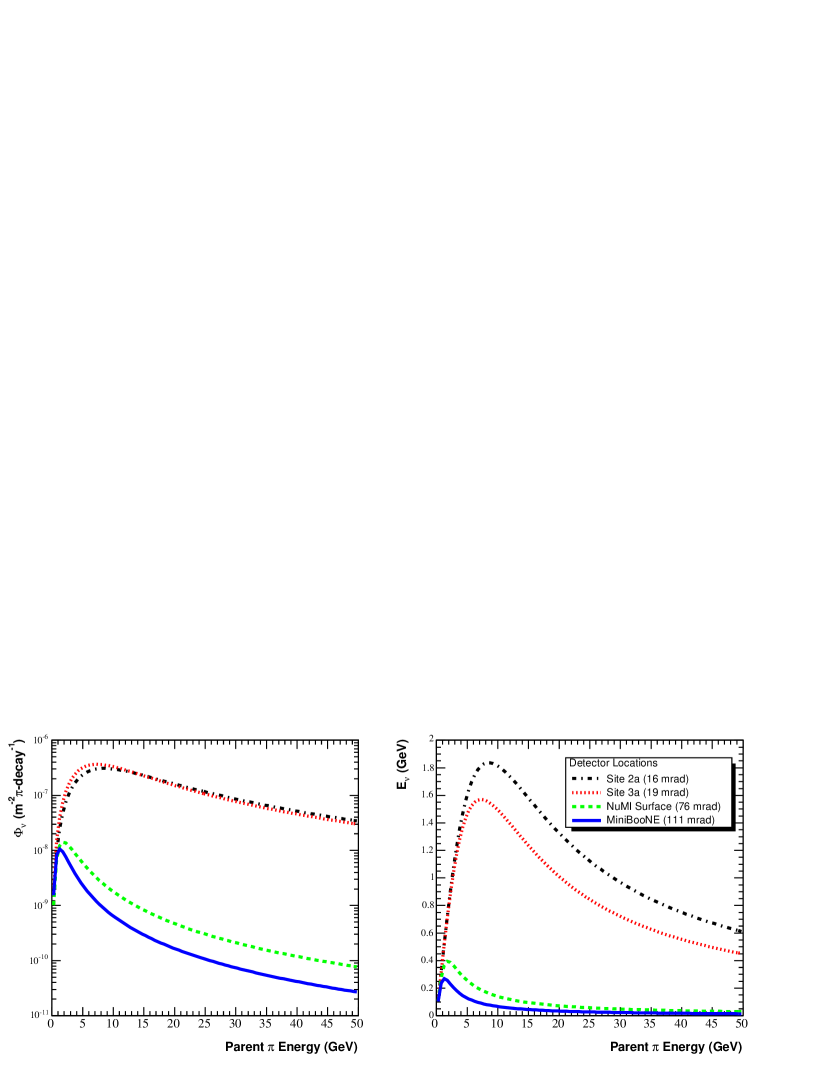


Appendix B Civil Construction Documents
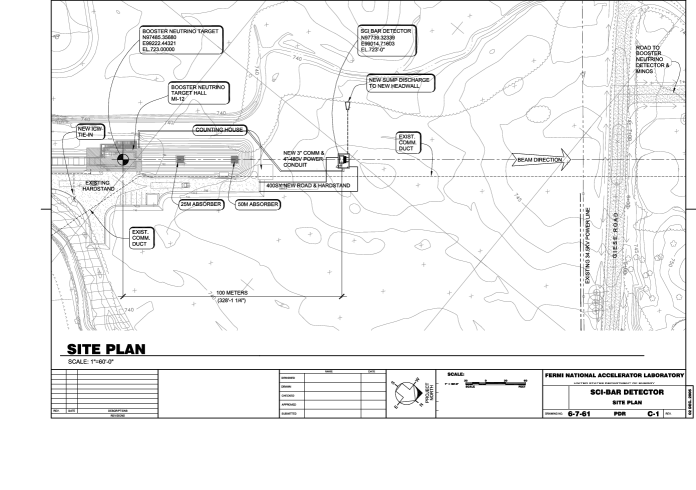
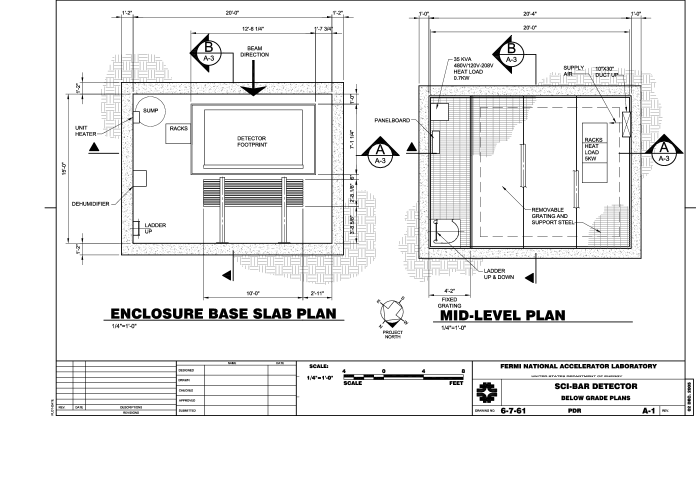
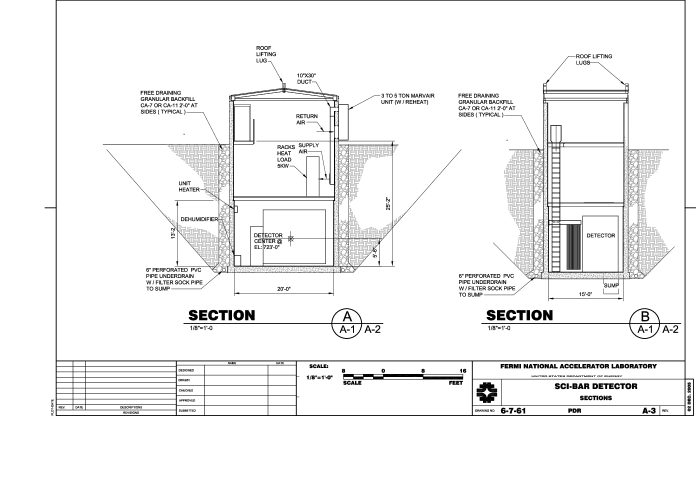
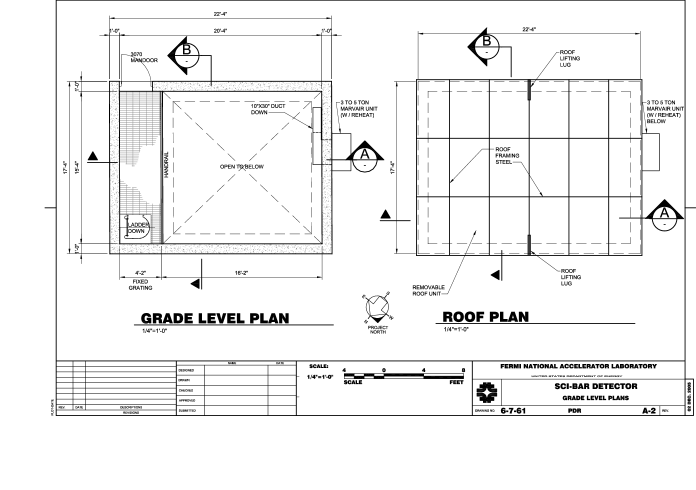
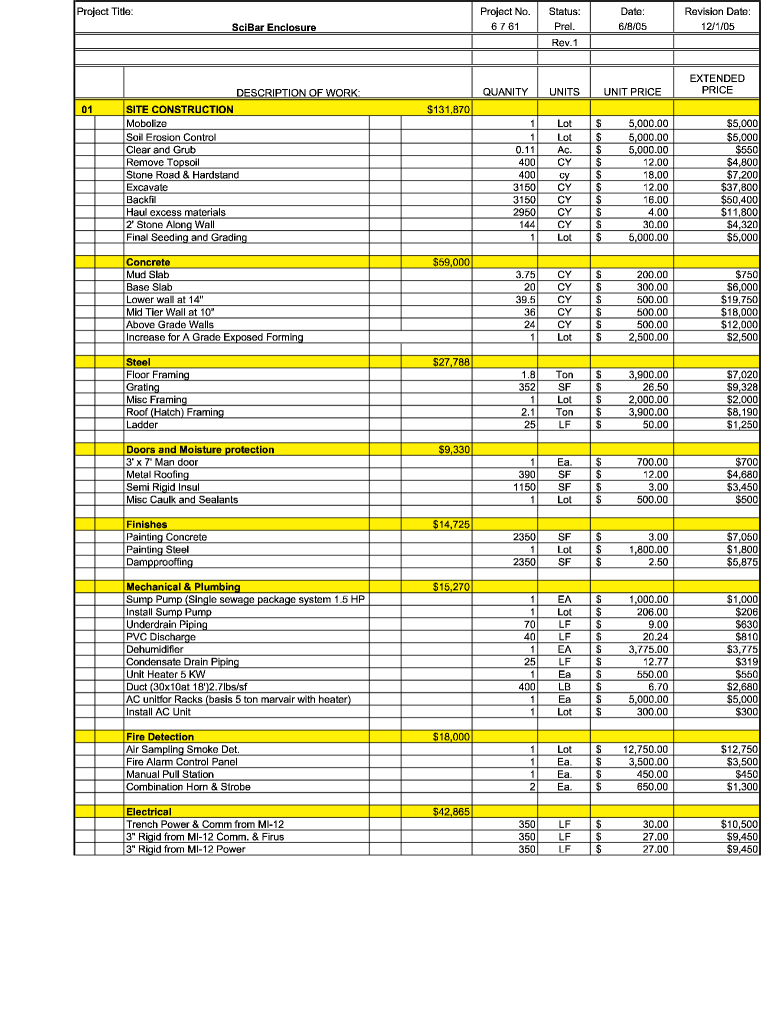
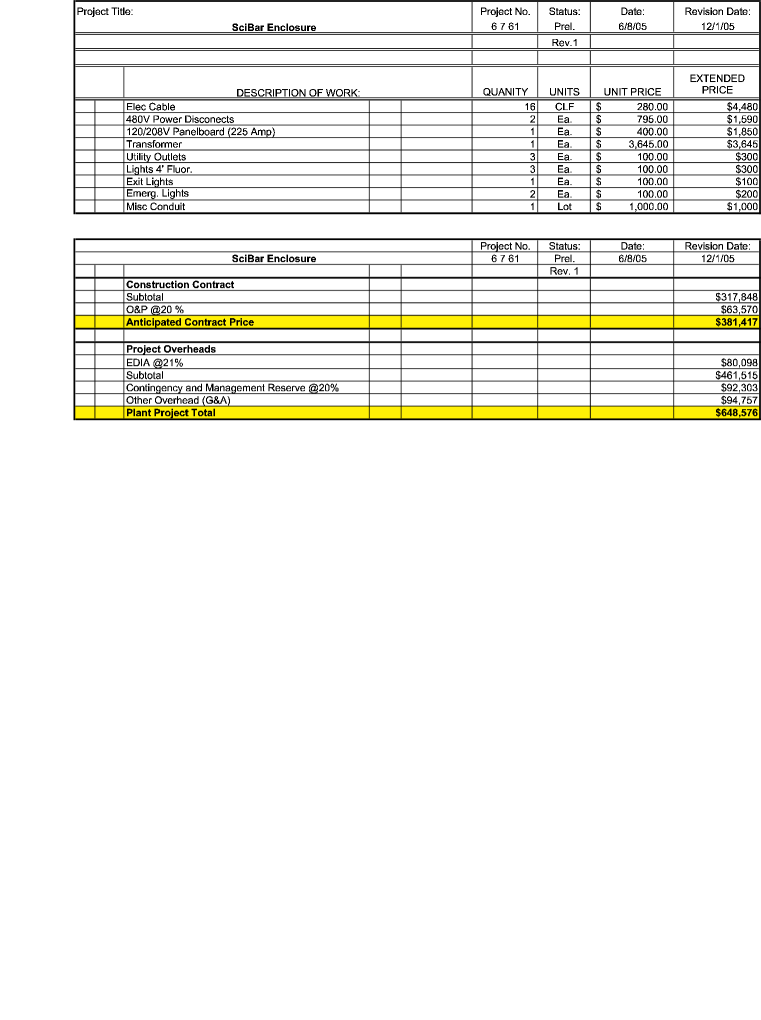
![[Uncaptioned image]](/html/hep-ex/0601022/assets/x41.png)
Bibliography
- [1] “The Neutrino Matrix,” Report from the APS DNP/DPF/DPB Joint Study on the Future of Neutrino Physics, available from http://www.aps.org/neutrino.
- [2] MiniBooNE Collaboration, “Addendum to the MiniBooNE Run Plan: MiniBooNE Physics in 2006,” available from http://www-boone.fnal.gov/publicpages/loi.ps.gz.
- [3] http://harp.web.cern.ch/harp/
- [4] HARP Collaboration, ”Measurement of the production cross-section of positive pions in p-Al collisions at 12.9 GeV/c”, hep-ex/0510039
- [5] http://www-accel-proj.fnal.gov/Proton_Plan/index.html
- [6] Eric Prebys, private communication
- [7] Craig Moore, private communication
- [8] MiniBooNE Collaboration, “The MiniBooNE Run Plan” available from http://www-boone.fnal.gov/publicpages/runplan.ps.gz
- [9] K. Nitta et al., Nucl. Instrum. Meth. A 535, 147 (2004).
- [10] M. Yoshida et al., IEEE Trans. Nucl. Sci. 51, 3043 (2004).
- [11] S. Buontempo et al., Nucl. Phys. Proc. Suppl. 54B, 198 (1997).
- [12] T. Ishii et al., Nucl. Instrum. Meth. A 482, 244 (2002).
- [13] A. Glaszov, et al., NIM A329, 262 (1993)
- [14] M. Hasegawa et al., “Search for Coherent Charged Pion Production in Neutrino-Carbon Interactions”, hep-ex/0506008.
- [15] H. Maesaka, Ph. D. thesis, Kyoto University (2005).
- [16] Y. Sakai, Ph.D. Thesis, Kyoto University (1984); J. A. Crittenden et al., Phys. Rev. D 34, 2584 (1986); J. A. Crittenden et al., IEEE Trans. Nucl. Sci. 28, 528 (1981).
- [17] Y. Hayato, Nucl. Phys. Proc. Suppl. 112, 171 (2002).
- [18] A. Aguilar et al., Phys. Rev. D 64, 112007 (2001).
- [19] K. Nishikawa et al. (T2K Collaboration), “Letter of Intent for a Neutrino Oscillation Experiment at JHF”, KEK Report (2003), http://neutrino.kek.jp/jhfnu.
- [20] http://jkj.tokai.jaeri.go.jp.
- [21] Y. Fukuda et al. (Super-Kamiokande Collaboration), Nucl. Instrum. Meth. A501, 418 (2003).
- [22] S. Nakayama et al., hep-ex/0408134, submitted to Phys. Lett. B.
- [23] H. Faissner et al., Phys. Lett. 125B, 230 (1983).
- [24] B. Mukherjee et al., Cyclotrons and Their Applications 2001, Sixteenth International Conference, ed. F. Marti, p.108 (2001)
- [25] see, for example, W. Lee et al., Phys. Rev. Lett. 37, 186 (1976).
- [26] Bartol neutron monitor data, http://neutronm.bartol.udel.edu/. Neutron monitors of the Bartol Research Institute are supported by NSF grant ATM-0000315.
- [27] F. Ashton, “Cosmic Rays at Ground Level,” ed. A. Wolfendale (1974)
- [28] NOA proposal,hep-ex/0503053
- [29] D. Casper, Nucl. Phys. Proc. Suppl. 112, 161 (2002).
- [30] E. A. Hawker, NuInt02 proceedings, to be published in Nucl. Phys. Proc. Suppl.
- [31] L. Bugel et al., FINeSSE proposal, hep-ex/0402007.
- [32] J. Monroe, Proceedings of the 39th Recontres du Moriond on Electroweak Interactions and Unified Theories, hep-ex/0406048.
- [33] D. Drakoulakos et al., MINERvA proposal, hep-ex/0405002.
- [34] M. Derrick et al., Phys. Lett. B92, 363 (1980).
- [35] Particle Data Group, Phys. Lett. B592, 7 (2004)
- [36] T. Itow, Nucl.Phys.Proc.Suppl.112:3-8, 2002