FERMILAB-PUB-05-525
Now at ]Dept. of Physics, National Tech. Univ. of Athens, GR-15780 Athens, Greece.
Now at ]GE Healthcare, Florence SC 29501.
Now at ]Div. of High Energy Physics, U.S. Dept. of Energy, Germantown, MD 20874.
Now at ]APC – Collège de France, 11 Place Marcelin Berthelot, F-75231 Paris Cedex 05, France.
Now at ]Math, Science and Technology Dept., Univ. of Minnesota – Crookston, Crookston, MN 56716.
Now at ]Physics Dept., Royal Holloway, Univ. of London, Egham, Surrey, TW20 0EX, UK.
Now at ]Holy Cross College, Notre Dame, IN 46556.
Now at ]Dept. of Rad. Oncology, Beth Israel Med. Center, New York, NY 10003.
Now at ]Fermi National Accelerator Laboratory, Batavia, IL 60510.
Now at ]Lincoln Laboratory, Massachusetts Institute of Technology, Lexington, MA 02420.
Now at ]Physics Div., Lawrence Berkeley National Laboratory, Berkeley, CA 94720.
Now at ]Dept. of Physics, Pennsylvania State Univ., University Park, PA 16802.
Now at ]Nucl. Nonprolif. Div., Threat Reduc. Dir., Los Alamos National Laboratory, Los Alamos, NM 87545.
Now at ]Stanford Linear Accelerator Center, Stanford, CA 94309.
Now at ]Fermi National Accelerator Laboratory, Batavia, IL 60510.
The MINOS Collaboration
First Observations of Separated Atmospheric and
Events in the MINOS Detector
Abstract
The complete 5.4 kton MINOS far detector has been taking data since the beginning of August 2003 at a depth of 2070 meters water-equivalent in the Soudan mine, Minnesota. This paper presents the first MINOS observations of and charged-current atmospheric neutrino interactions based on an exposure of . The ratio of upward to downward-going events in the data is compared to the Monte Carlo expectation in the absence of neutrino oscillations giving:
An extended maximum likelihood analysis of the observed distributions excludes the null hypothesis of no neutrino oscillations at the confidence level. Using the curvature of the observed muons in the 1.3 T MINOS magnetic field and interactions are separated. The ratio of to events in the data is compared to the Monte Carlo expectation assuming neutrinos and anti-neutrinos oscillate in same manner giving:
where the errors are the statistical and systematic uncertainties. Although the statistics are limited, this is the first direct observation of atmospheric neutrino interactions separately for and .
pacs:
I Introduction
Over the course of the past ten years the deficit of muon neutrinos from cosmic-ray showers in the atmosphere has been firmly established by the Super-Kamiokande experimentFukuda et al. (1998a); Fukuda et al. (1998b, c, 1999a, 1999b); Ashie et al. (2005) and confirmed by the MACROAmbrosio et al. (2003) and Soudan 2Sanchez et al. (2003) experiments. The favoured interpretation of the data is neutrino oscillations. Recent results from the Super-Kamiokande experimentAshie et al. (2004) provide direct evidence for atmospheric neutrino oscillations and yield best fit oscillation parameters of , where . Results from the K2K experimentAliu et al. (2005) provide further confirmation of the oscillation hypothesis.
The 5.4 kiloton (kt) mass of the recently constructed MINOS (Main Injector Neutrino Oscillation Search) far detectorAdamson et al. (1998) is much less than the kt fiducial mass of the Super-Kamiokande detector. However, it does possess one unique advantage, namely it is the first large deep underground detector to have a magnetic field. This allows studies of neutrino flavour oscillations for neutrinos and anti-neutrinos separately. A separate measurement of and oscillations could provide constraints on CPT violating modelsMurayama and Yanagida (2001); Barenboim et al. (2002) which have been invoked to accommodate simultaneously the solar, atmospheric and LSNDAguilar et al. (2001) neutrino oscillation data. It should be noted that a number of recent studies have indicated difficulties with the CPT violating models (see for example Gonzalez-Garcia et al. (2003)). Nevertheless, a direct measurement of and oscillations is of interest. In addition, MINOS is unique in its ability to provide an accurate measurement of the neutrino energy and direction for all contained-vertex charged-current (CC) interactions.
This paper presents first results on atmospheric neutrinos from the MINOS experiment. Here, only results from / CC events with neutrino interaction vertices contained inside the detector volume are considered; results from events where the neutrino interacts in the surrounding rock will be the subject of a separate publication. The data used were recorded between August 2003 and February 2005 and correspond to a livetime of giving an exposure of 6.18 kiloton-years (4.54 kiloton-years fiducial). The data are compared to the expectation in the absence of neutrino oscillations and the favoured hypothesis of oscillations with eV2 and . The first direct results showing charge separated and atmospheric neutrino interactions are presented.
II The MINOS Detector
The MINOS far detector is located at a depth of meters-water-equivalent (mwe) in the Soudan mine, Northern Minnesota. The far detector is a steel-scintillator sampling calorimeter consisting of two super-modules (SM) separated by a gap of 1.1 m. The detector consists of octagonal planes of 2.54 cm thick steel followed by planes of 1 cm thick extruded polystyrene scintillator and a 2 cm wide air gap. The first and second SMs are comprised of 248 and 236 scintillator planes respectively. Each SM is magnetized to an average value of 1.3 T by a 15 kA current loop which runs through the coil hole along the detector central axis and returns below the detector. Each scintillator plane is made up of 192 strips of width 4.1 cm and of length between m depending on position in the plane. The strips in alternating planes are oriented at to the vertical thereby providing two orthogonal coordinates111 The MINOS right-handed coordinate system has the -axis defined along the detector axis pointing away from Fermilab and the -axis vertical. The alternating scintillator planes provide measurements of the and coordinates which are related to and by and .. The scintillation light is collected using wavelength shifting (WLS) fibers embedded within the scintillator strips. The WLS fibers are coupled to clear optical fibers at both ends of a strip and are read out using 16-pixel multi-anode photomultiplier tubes (PMTs). The signals from eight strips, separated by approximately 1 m within the same plane, are optically summed (multiplexed) and read out by a single PMT pixel. The multiplexing pattern is different for the two sides of the detector, which, for a single hit, enables the resulting eightfold ambiguity to be resolved. For all types of event, the ambiguities are efficiently resolved in software using additional information from timing and event topology.
The detector is optimized for detecting beam neutrinos coming from the direction of Fermilab. For the study of atmospheric neutrinos the planar structure presents a particular problem: cosmic-ray muons traveling almost parallel to the scintillator planes can penetrate deep into the detector by traveling in the steel or air between the planes. To reject this source of background a scintillator veto shield surrounds the upper part of the main detector. The veto shield is constructed from the same scintillator modules as used in the main detector but with the orientation of strips aligned along the z-axis. The veto shield comprises a “ceiling” section above the detector, consisting of two scintillator layers, and “wall” sections along each of the two sides of the detector formed from a single scintillator layer.
II.1 Data Acquisition and Trigger
The output signals from each PMT pixel are digitized and time-stamped (with a 1.5625 ns precision) by the VME-based front-end electronics. The signals from the pixels are digitized by 14-bit analogue-to-digital converters (ADC) when the dynode signal from the PMT exceeds a programmable threshold, corresponding to approximately one third of a photo-electron. To reduce the data flow, the pedestal corrected signals are only written to the DAQ output buffers if two out of thirty-six channels on the same readout board are above threshold. These thirty-six channels correspond to the readout on one side of the detector from a contiguous group of either 20 or 24 planes. The raw data rate is approximately 8 MB s-1. The raw data are transferred to a PC based trigger farm where the data are divided into blocks bounded by regions of 100 clock ticks (156 ns) or more where no detector activity has been recorded. The primary trigger algorithm, applied to these blocks of data, requires there to be activity in at least planes out of any contiguous group of planes. The veto shield is read out in the same manner as the main detector except that the two out of thirty-six requirement is not applied and the dynode threshold is set to a level corresponding to approximately one and a half photo-electrons.
II.2 Detector Calibration
A minimum ionizing particle crossing at normal incidence to a plane gives a combined signal of approximately photo-electrons (PEs) registered by the PMTs at the two ends of the strip. The detector is calibrated using both a dedicated LED systemAdamson et al. (2004) and cosmic-ray muons. The ADC to PE calibration is performed using the LED system and the cosmic-ray muon sample is then used to give a uniform response across the detector. From studies of cosmic-ray muons in the MINOS detectorHartnell (2005), the current uncertainty in the PE calibration is 5 %. Cosmic-ray muons are also used to calibrate the recorded times. After calibration, a single hit timing resolution of approximately 2.3 ns is achieved. The timing calibration tracks all hardware changes.
III Data and Monte Carlo
The data described in this paper were recorded in the 18 month period from August 2003 to February 2005. Only data taken when the MINOS far detector, including the veto shield, was fully operational are used. The final data sample corresponds to a livetime of giving an exposure of 6.18 kiloton-years (4.54 kiloton-years fiducial).
The selection of contained-vertex neutrino interactions was optimized using a GEANT 3Giani et al. simulation of the MINOS detector. For the simulation of atmospheric neutrino events the 3D flux calculation of Barr et al.Barr et al. (2004) was used (Bartol 3D). The NEUGEN3 programGallagher (2002) was used to simulate the neutrino interactions (cross sections and hadronic final states). The earlier 1D flux calculation from the Bartol groupAgrawal et al. (1996) (Bartol 1D) and the 3D calculation of Battistoni et al.Battistoni et al. (2003) were used to assign systematic uncertainties. The response of the MINOS detector to electrons, muons and hadrons has been studied in a test beam at the CERN PS using the 12.5 ton MINOS calibration detectorAdamson et al. . The test beam detector was constructed and read out in the same manner as the MINOS far detector. The interactions of hadronic particles are modeled with the GCALOR packagebib , which is found to give a reasonable description of low energy hadronic interactions in the MINOS calibration detectorKordosky (2004), rather than the default version of GHEISHA (see Giani et al. and references therein). The “SLAC version”Bower and Cassell of GHEISHA, which also provides a reasonable description of the test beam data, is used as an alternative model for hadronic interactions. A Monte Carlo (MC) sample of atmospheric neutrino interactions corresponding to over 1000 live-years was generated and used to optimize both the reconstruction algorithms and the event selection criteria. Two large cosmic-ray muon background samples were generated: a sample of 19 million events full spectrum (corresponding to approximately 280 days livetime) and a further 2 million events with (corresponding to a livetime of 4.1 years) as lower energy events are an important component of the cosmic-ray muon background to the contained-vertex atmospheric neutrino selection. A 10 % uncertainty on the normalisation of the cosmic-ray background is assigned. The error reflects the different normalisation obtained when normalising to the entire cosmic-ray sample or normalising to just those cosmic-ray muons which stop in the detector (these form the main background to the event selection described below). It should be noted that for the results presented in this paper the cosmic-ray background in the selected event sample is estimated from data. The 10 % uncertainty in the cosmic-ray normalisation is only used when comparing data and Monte Carlo at various stages in the event selection.
III.1 Flux Normalization and Systematic Uncertainties
The theoretical prediction for the atmospheric neutrino event rate has large uncertainties from the primary cosmic-ray flux, hadron production models and neutrino interaction cross sections. The analysis of the Soudan 2 dataSanchez et al. (2003) indicates that the combined prediction of the Bartol 3D modelBarr et al. (2004) and the NEUGEN3Gallagher (2002) neutrino cross section model should be scaled by Allison et al. (2005), where the error is statistical and it is implicitly assumed that atmospheric electron neutrinos are not oscillating. This normalization result is compatible with the results from a fit to the Soudan 2 data including oscillations. The MINOS and Soudan 2 detectors are located in the same mine (i.e. at the same geomagnetic latitude) and both are constructed from steel. Consequently, for the analysis presented here the Soudan 2 scale factor is used to correct the combined event rate predictions from the Bartol 3D flux model and the NEUGEN3 neutrino interaction model. An additional 5 % uncertainty is added in quadrature to that estimated by the Soudan 2 collaboration to account for differences arising from the different energy thresholds ( MeV in the case of Soudan 2 compared to MeV for MINOS). Finally an additional 2.5 % uncertainty is assigned to account for the different phases in the solar cycle for the Soudan 2 and MINOS data setsBarr ; because of the relatively high neutrino energy threshold the selected atmospheric neutrino rate in MINOS depends only weakly on the phase in the solar cycle. The resulting total systematic uncertainty on the expected event rate is estimated to be 10 %.
IV Event Reconstruction
The MINOS detector is optimized for beam neutrinos originating from Fermilab. Due to the curvature of the Earth, beam neutrinos enter the detector from below the horizontal at an angle of with respect to the -axis. The standard MINOS reconstruction software has been developed for these events. The analysis presented here uses reconstruction software optimized for atmospheric neutrinosBlake (2005).
The first stage of the event reconstruction removes the eightfold ambiguity in the association of raw hits to strips. This is performed utilizing information from both strip ends. For cosmic-ray muons, an average of of the recorded pulse height is associated with the correct strip. At this stage the data are in the form of two 2D event views and . An example event display of a cosmic-ray muon is shown in Figure 1. Tracks and showers are reconstructed independently in each view; the two views are then matched to obtain a three-dimensional event. For cosmic-ray events that leave hits in both the veto shield and main MINOS far detector, the root-mean-square (rms) difference in times recorded in veto shield and the detector is ns, allowing association of veto shield hits (indicated in Figure 1) to activity in the main detector.

A charged-current muon neutrino event is in general reconstructed as a muon track and a hadronic shower. A typical 1 GeV muon will traverse approximately 25 planes at normal incidence. Reconstructed tracks are required to consist of at least 8 planes (corresponding to a minimum energy of 0.4 GeV). For muons which start and stop within the detector volume the muon momentum is determined from range with a resolution of approximately for muons traveling at normal incidence to the detector planes (where is measured in GeV). The first term is dominated by fluctuations in energy loss and the second is dominated by sampling. For events where the muon exits the detector, the muon momentum is obtained from the curvature of the track in the magnetic field. For the selected CC atmospheric / interactions, where the momentum is determined from curvature, the average momentum resolution is approximately (where is measured in GeV). However, the resolution obtained from individual events depends strongly on how much of the trajectory of the muon is observed before it exits the detector and on the orientation of the trajectory relative to the local magnetic field. The hadronic energy is obtained by summing the pulse height in a shower which is spatially associated with the start of the track. The energy scale is obtained from Monte Carlo using the GCALORbib model of hadronic showers, which from the test beam results is found to provide a good description of the detector response to single and protonsKordosky (2004). The hadronic energy resolution is approximately , where is measured in GeV.
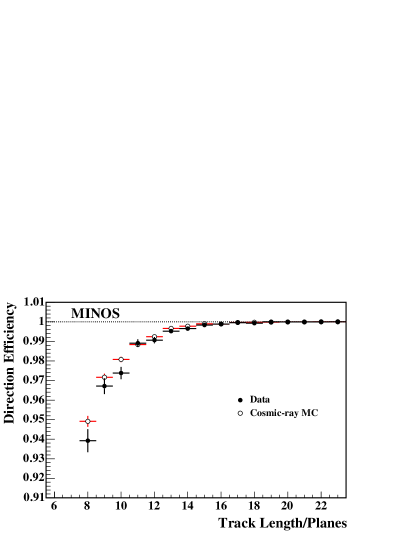
For the study of atmospheric neutrinos it is necessary to determine whether the reconstructed track is upward or downward going. A relativistic normal incidence particle traverses ten planes in approximately 2 ns which, when compared to the single hit resolution of 2.3 ns, is sufficient to identify the direction of most selected events with little ambiguity. The sense of the direction of muon tracks is determined by comparing the hit times along the reconstructed track with the hypotheses that it is either upward or downward going (assuming that the particle is traveling at the speed of light). The rms deviations of hit times about each of the two hypotheses are calculated, and . The hypothesis with the smallest rms is chosen. In addition, the magnitude of provides a measure of the quality of the direction determination. To test the performance of the algorithm a sample of stopping cosmic-ray muons is used (all of which are traveling downward). Figure 2 shows a comparison of the data and Monte Carlo efficiencies for correctly identifying a stopping muon as downward-going as a function of the number of planes the track crosses. The average efficiency is above 94 % for even the shortest tracks and rapidly increases to better than 99 % for events with hits in 12 planes. The efficiency in data agrees with that from Monte Carlo to better than 1 %.
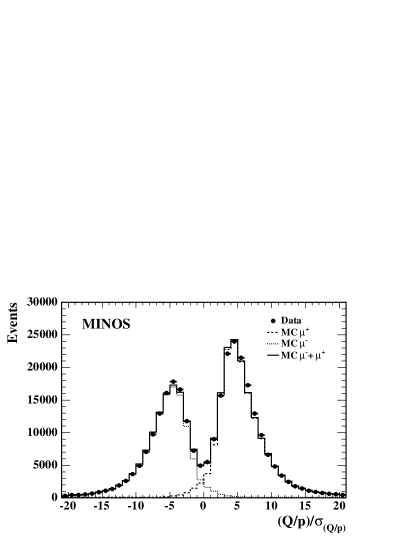
The curvature of / tracks in the magnetic field allows the charge sign to be determined. Figure 3 shows the distribution of the reconstructed charge divided by momentum, , divided by its error, for cosmic-ray muons that stop in the detector. Two peaks, corresponding to and events, are clearly seen. The widths of the two peaks in data and MC agree to better than 2.5 %. For the event samples considered here, the / charge is cleanly identified over the approximate momentum range . The efficiency decreases for low momentum tracks due to the limited number of planes crossed. For high momentum tracks, which typically leave the detector, the charge identification efficiency decreases as only the limited curvature at the start of the track is measured.
V Event Selection
At a depth of mwe the cosmic-ray muon rate is approximately 50000 events per day in the MINOS detector. This rate should be compared to the expected signal rate of atmospheric CC interactions per day222The signal rate of (no oscillations) corresponds to CC interactions where the muon deposits energy in at least eight planes (before fiducial cuts)., where the uncertainty is from the uncertainty in the expected event rate (discussed in Section III.1). In order to achieve a signal-to-background ratio of ten-to-one it is necessary to identify the signal events efficiently whilst reducing the background by a factor of . The event selection is designed to identify both fully-contained (FC) and partially-contained (PC) events. In FC events the entire event is contained within the fiducial volume. In PC events the neutrino vertex is within the fiducial volume but the produced muon exits the detector.
V.1 Preselection
Candidate CC neutrino interactions are required to have a reconstructed track passing some basic quality requirements. The majority of the background is rejected by event containment requirements which are applied at both the hit and reconstructed track level. The sense of the track direction (up/down) is determined from timing as described previously. The start of the track, which is considered to be the neutrino interaction vertex, is required to lie within the detector fiducial volume. The fiducial volume is defined as the octagonal region which is at least 50 cm from the detector edges in the plane and at least 5 planes from the start and end of either SM. In addition, the region within 40 cm of the axis of the coil hole, which has a diameter of 25 cm, is excluded from the fiducial volume. This cut is enlarged to 1 m in the first and last 10 planes of the detector. The event sample is sub-divided into FC and PC events depending on whether the end of the track also lies within the fiducial region.
Event containment cuts are also made at the hit level to reduce the sensitivity to possible reconstruction errors where not all hits are correctly associated to the reconstructed track. For this purpose, the fiducial volume requirement of 50 cm from the detector edges is relaxed to 30 cm. In order to apply the containment cuts at the hit level it is necessary to convert the two-dimensional coordinates of a single hit into a point in space. This conversion is achieved by using the mean value of the orthogonal (U/V) coordinate in the surrounding two planes. Hits outside the fiducial volume are then assigned to the nearest octagonal edge/SM end. Edges/ends with summed pulse height equivalent to more than six PEs outside the fiducial region are tagged as being uncontained. Candidate FC (PC) events are required to have no (one) such region. The containment cuts reject approximately 99.9 % of the cosmic-ray background whilst retaining 77 % of CC interactions in the detector volume. The inefficiency for signal events is primarily a fiducial effect; the containment cuts retain 99 % of CC interactions in the fiducial region which produce a muon which spans at least six planes.
Candidate FC events are required to have a reconstructed track consisting of hits in at least eight planes. The PC event selection criteria are optimized separately for upward and downward-going events as the backgrounds for the two categories are very different. To ensure the track direction is well determined, candidate PC events are required to have a track of at least 1 m in length and which consists of hits in at least ten planes.
V.2 Fully Contained and Downward Partially Contained Event Selection
The dominant backgrounds in the FC and downward PC samples arise from steep cosmic-ray muons which enter the detector at small angles to the detector planes. By traveling in the steel or air between the scintillator planes, such events can penetrate a significant distance into the fiducial volume before leaving a detectable signal. The selection of FC and downward-traveling PC CC / interactions aims to greatly reduce this background and proceeds in four stages:
-
i)
Cosmic-Ray Rejection (Trace cut): The reconstructed track is extrapolated back to the outside of the detector and the distance traversed in the direction perpendicular to the detector planes is calculated, . Events with small values of correspond to steep tracks which when extrapolated to the detector edge traverse only a few scintillator planes. Figure 4 shows the distribution for MC cosmic-ray muons and CC interactions. Events are rejected if m. Figure 4 also shows the distribution for data which is in reasonable agreement with the MC expectation.
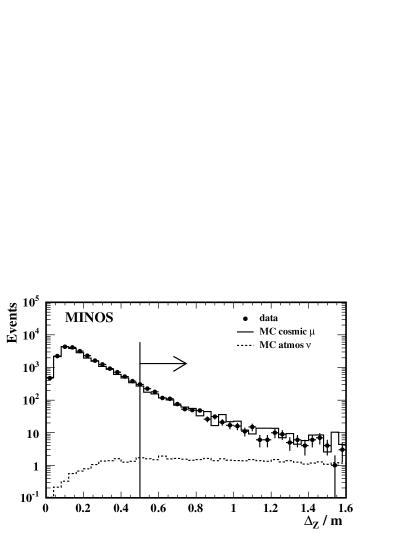
Figure 4: The reconstructed distribution for events passing the containment cuts. The solid histogram indicates the MC expectation for cosmic-ray background. The points with error bars show the observed data. The dashed histogram indicates the expected distribution for atmospheric neutrino events (without oscillations). -
ii)
Event Topology: About half of the remaining background consists of cosmic-ray muon tracks that bend in the magnetic field and turn over in the direction. Such events will leave hits in two separate positions in a particular plane. In addition, these events typically have large pulse height in the plane where the muon turns around in . This category of background event is rejected using the pulse-height weighted deviations of the hits in the and views from the fitted track. The pulse-height weighted mean, , and the pulse-height weighted rms deviation of hits from the track, , are calculated. Events are rejected if there is large scatter about the track, m, or if the pulse-height weighted mean deviation from the track lies significantly above the reconstructed track, m. These empirically determined cuts are applied separately to the hits in both the and views. In addition, the event vertex is defined as the first hit on the track taking the highest end (largest ) as the start of the track. The maximum displacement from the event vertex of the hit strips which lie within planes of the event vertex is found, . Events are rejected if m.
-
iii)
Vertex Pulse Height/Direction: After the topology cut, the signal-to-background ratio is approximately 1:5. The remaining background consists of steep cosmic-ray muons which travel nearly parallel to the scintillator planes and therefore tend to give a large pulse height signal in a single plane near the beginning of the track. These events are often poorly reconstructed due to the difficulties of reconstructing tracks for events at small angles to the detector planes. Figure 5 shows, for signal and background, the total pulse height in the event vertex region, , plotted against the cosine of reconstructed zenith angle at the highest end of the track333The zenith angle, , is defined as minus the angle between the reconstructed track direction and the local vertical (the -axis). Negative values of the cosine of the zenith angle correspond to tracks which are reconstructed as upward-going. and the modulus of reconstructed track direction cosine with respect to the axis, . The vertex pulse height is defined as the maximum number of PEs observed in a single plane within planes of the event vertex (defined above). The background is characterized by being steep and having large . Events are rejected if they have PEs. Steep events, defined as having and , are required to satisfy PEs. The above event charge/direction cuts are not applied to events with track lengths of greater than 20 detector planes, as the steep background events tend to cross relatively few planes.
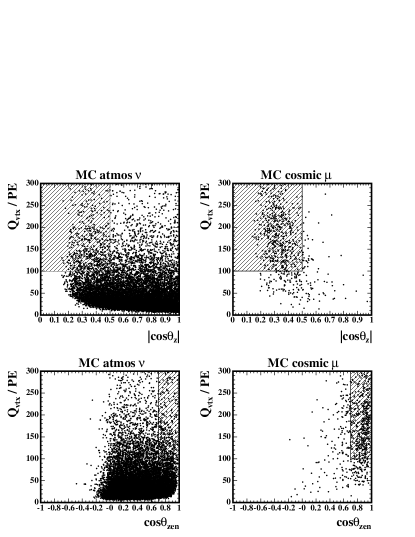
Figure 5: The MC distributions of the vertex pulse height, , plotted against the modulus of the cosine of the angle with respect to the detector z-axis, and the cosine of the reconstructed zenith angle, . Plots are shown for both the cosmic-ray muon background and for the atmospheric neutrino signal for all events passing the containment cuts. The hatched areas represent the regions rejected by the “Vertex Pulse Height/Direction” cuts. -
iv)
Veto Shield: The cuts listed above result in a signal-to-background ratio of approximately . Additional background is removed by rejecting events with activity in the veto shield within a ns window around the event time, resulting in a signal-to-background ratio of approximately .
V.3 Upward Partially Contained Events
The background to the upward-going PC event selection is dominated by cosmic-ray muons which stop in the detector and are reconstructed as upward rather than downward-going. The cuts to remove this source of background are based on timing information and identify events which are unambiguously upward-going. The event selection cuts fall into two categories:
-
i)
Event Topology: For the upward PC selection, the relatively small number of badly reconstructed events passing the preselection are removed using a subset of the topology cuts employed in the FC/downward PC analysis. Events are rejected if PEs or m.
-
ii)
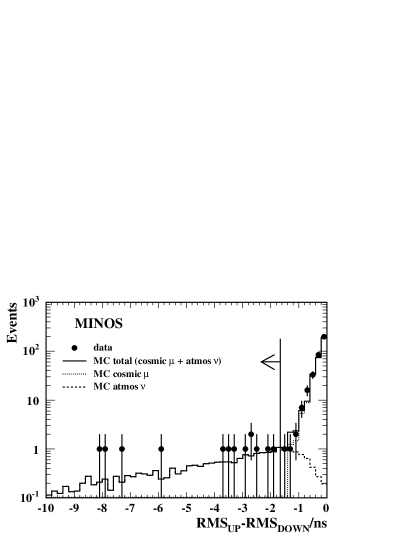
Track timing rms: The expected times of hits on the track are calculated for the hypotheses of an upward-going and a downward-going track. The rms scatter of the difference between observed and expected hit times for these two hypotheses is used to identify upward-going events. The event is required to be consistent with the upward hypothesis and significantly more compatible with the upward hypothesis than the downward hypothesis: ns and ns (these numbers should be compared to the single hit timing resolution of 2.3 ns). Figure 6 shows the effect of the main timing cut, namely , for data compared to the Monte Carlo expectation.
V.4 Performance
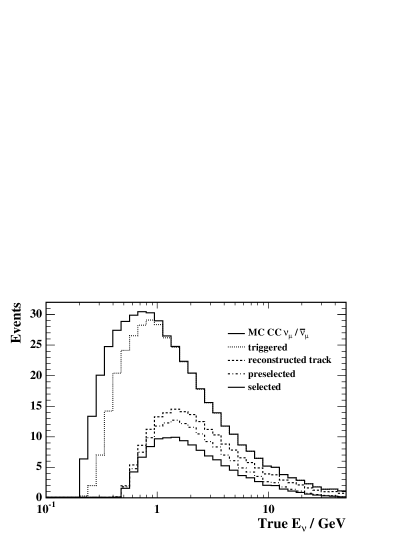
The event selection reduces the background from cosmic-ray muons by a factor of . In Monte Carlo the efficiency for CC / neutrino interactions where the interaction occurs within the fiducial region and the muon traverses eight or more scintillator planes is 70 %. Figure 7 shows the expected energy distribution for CC / for the various stages in the event selection. The effective lower limit on the neutrino energy of the selected events is approximately 0.5 . For low energy CC neutrino interactions the efficiency is low because tracks are only reconstructed if they span at least eight detector planes.
The numbers of events surviving at different stages in event selections are listed in Table 1. Reasonable agreement between data and Monte Carlo is seen at each stage. The final veto shield requirement rejects 149 events in data, consistent within one standard deviation with the MC expectation of , where the uncertainty is from normalization and MC statistics. For the results in this paper, the cosmic-ray muon background in the combined FC and downward PC event sample is estimated from data rather than relying on MC. From the 149 events rejected by the veto shield cuts the remaining background is estimated to be events using the veto shield efficiency of (described below) and taking account of the expected number of neutrino events rejected by the veto shield requirements.
| Cuts | Data | Monte Carlo Expectation | ||
|---|---|---|---|---|
| total | cosmic muon | CC | ||
| Fully Contained and Downwards Partially Contained | ||||
| Preselection | ||||
| Trace | ||||
| Topology | ||||
| Vertex/Direction | ||||
| Veto Shield | ||||
| Upward Partially Contained | ||||
| Preselection | ||||
| Topology | ||||
| Timing | (68% C.L.) | |||
V.5 Event Selection Systematic Uncertainties
The systematic uncertainties on the event selection efficiency and cosmic-ray muon background have been studied in detail. In each case the impact of the systematic effect on the MC expectation for the number of selected events is estimated. In addition, because the selection is not up-down symmetric, systematic uncertainties are calculated for the MC expectation for the ratio of upward-going to downward-going events. The total uncertainty on the selection efficiency for atmospheric neutrino events is estimated to be 3.3 %. The contribution to the systematic uncertainty on the up-down ratio from experimental effects is estimated to be 3.1 %. The contributions to these systematic errors are discussed in detail below.
Veto Shield: The efficiency of the veto shield cut is determined directly from data in two independent ways. Firstly, a sample of cosmic-ray muons that stop in the detector and have is selected. These events occupy a similar region of phase space to the background. The veto shield cut rejects % of this sample. A second estimate of the veto shield efficiency is obtained by relaxing the event selection cuts until the sample is dominated by background (i.e. an expected signal fraction of less than 2 %). The veto shield cut rejects % of this sample which, when the expected signal (assuming ) is taken into account, leads to an estimated veto shield efficiency of %. From these two tests the veto shield efficiency is estimated to be %, where the central value is taken from the high statistics stopping muon sample and a systematic error of % is added reflecting the difference between the two methods.
The fraction of signal events rejected due to accidental coincidences with hits in the veto shield is estimated by overlaying veto shield hits obtained from special minimum bias data taking runs onto Monte Carlo atmospheric neutrino events. The estimated fraction of signal events rejected due to spurious veto shield hits is , where the error represents systematic time dependent variations. In addition, from Monte Carlo studies it is estimated that % of the selected signal downward-going events will be rejected due to hits in the veto shield associated with the neutrino interaction.
Hadronic Response: The event selection efficiency depends on the detector response to hadrons and consequently the hadronic interaction model used. Comparisons of GCALOR and GHEISHA show no evidence for any significant difference in overall selection efficiency or reconstructed up-down ratio. The GCALOR model is found to provide a good description of the response of the detector to single hadrons. Systematic errors of 2.5 % on the selection efficiency and 3.0 % on the up-down ratio are assigned; in both cases the estimates reflect the Monte Carlo statistical precision of the comparison.
Scintillator Light Calibration: The overall calibration of the MINOS far detector is currently known to 5 %. The MC response is tuned to agree with cosmic-ray muon data and has a corresponding 5 % uncertainty. Because the selection cuts use pulse height information, this leads to systematic errors of 0.6 % on the selection efficiency and 0.3 % on the up-down ratio.
Timing Calibration/Resolution: The timing calibration for each scintillator strip is determined from data in a manner that tracks hardware changes. The uncertainty on the timing calibration for the individual strips is ns, i.e. significantly less than the single hit resolution of 2.3 ns. The effect on the selection is negligible. A more significant effect is that the single hit resolution in MC is better than that in the data, 2.2 ns compared to 2.3 ns. This is due to an incomplete simulation of the electronics readout. For this reason the times of the Monte Carlo hits are smeared by a Gaussian of width 0.7 ns. The difference between the the selection efficiencies before and after this smearing are compared. The overall selection efficiency for the smeared MC is reduced by 1.0 %. The effect on the up-down ratio is small (0.1 %). These differences are used as estimates of the systematic uncertainties.
Muon d/d: One of the main cuts in the event selection is the requirement that tracks leave hits in at least 8 scintillator planes. Consequently, the event selection efficiency is sensitive to the Monte Carlo simulation of muon energy loss. The simulation of muon energy loss depends on the underlying simulation of the physics processes and the knowledge of the chemical composition of the MINOS detector. An uncertainty of 3 % in the muon range is assumed. These uncertainties result in systematic uncertainties of 1.7 % on the selection efficiency and 0.3 % on the up-down ratio.
Neutron Background: The background from cosmic-ray induced neutrons has been studied using a GEANT 4 simulationAgostinelli et al. (2003) of muon nuclear interactions in the rock and is found to be negligible. In a Monte Carlo sample corresponding to four times the data exposure no neutron event passed even the early stages of the event selection.
VI Results
From the exposure considered in this paper, candidate contained events are selected. The selected events are consistent with both the expectation of events assuming no neutrino oscillations, and with the expectation of events assuming eV2 and . The background contribution from cosmic-ray muons, , is obtained from data as described above. In addition, there is an expected background of from the combination of neutral current interactions and CC interactions. The error in the MC expectation is dominated by the uncertainty on the neutrino flux interaction cross section which is estimated to be . Table 2 gives a breakdown of the various contributions to the expected event rates.
| Selection | Data | Expectation (no oscillations) | |||||
|---|---|---|---|---|---|---|---|
| cosmic | CC | CC | NC | Rock | CC | ||
| FC | |||||||
| PC Down | |||||||
| PC Up | |||||||
| Total | |||||||
| Expectation () | |||||||
| FC | |||||||
| PC Down | |||||||
| PC Up | |||||||
| Total | |||||||
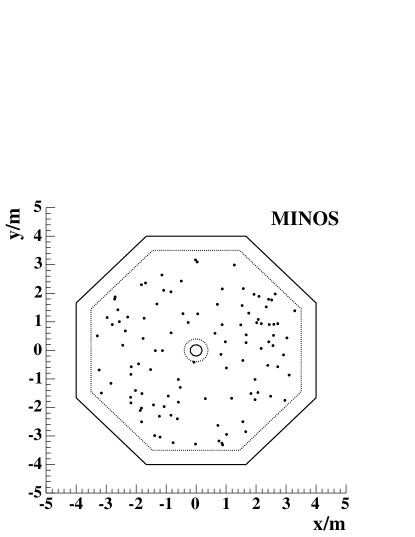
The positions of the reconstructed neutrino interaction vertices is shown in Figure 8. There is no evidence for a non-statistical accumulation of events in a particular region.
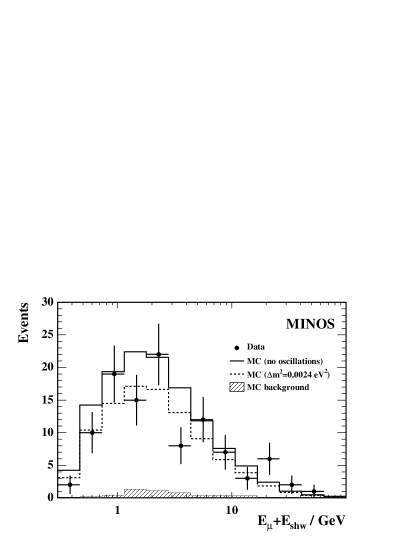
The reconstructed neutrino energy distribution of the candidate events is shown in Figure 9. The neutrino energy is calculated by summing the reconstructed muon energy and the hadronic energy of any reconstructed shower associated with the start of the muon track. For FC events, the muon energy is determined from the track range. For PC events the less precise momentum from curvature is used.
The neutrino energy spectrum is sharply peaked towards lower energies and the selected event sample is expected to have mean neutrino energy of 3.5 GeV (2.0 GeV for FC events and 7.0 GeV for the PC events) and mean muon energy of . For low energy events the ability to determine the sense of the muon track (up/down) is degraded. In MC, 96 % of the selected events have the correct direction reconstruction. The remaining 4 % of events not only have the wrong reconstructed sense, but as a consequence, are also assigned the incorrect charge. By requiring that ns (see Section IV) and that the track traverses at least ten planes the fraction of mis-reconstructed events is reduced to 0.1 %. For the results that follow, the event sample is divided into two: a ‘Low Resolution’ sample with ns and events with ‘Good Timing’ for which ns. The numbers of events in each category are listed in Table 3. The events classified as low resolution are mainly short events and according to MC have a mean neutrino energy of 1.0 . For 85 % of the low resolution events, the muon is reconstructed with the correct sense (up/down). However, in the oscillation analysis that follows, the direction information from the low resolution sample is not used, due to the significant fraction of events reconstructed with the wrong direction sense and the fact that for this predominantly low energy sample, the mean angle between the incident neutrino and final state muon is large.
| Selection | Data | Expected | Expected |
|---|---|---|---|
| no oscillations | |||
| Good Timing | |||
| Low Res. | |||
| All Events |
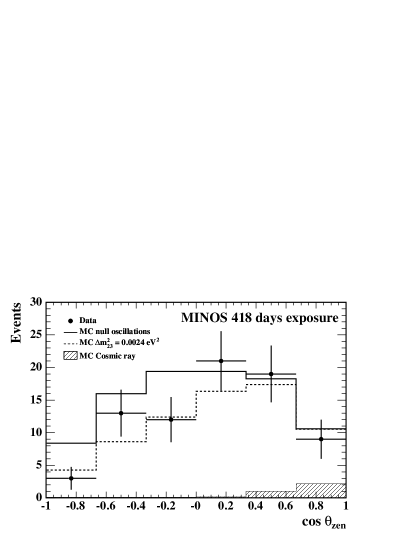
Figure 10 shows the reconstructed zenith angle distribution of the candidate events with good timing. Of these events, are downward-going and are upward-going , giving a measured up-down ratio of . The statistical errors correspond to the 68 % confidence interval calulated using Poisson statisticsGehrels (1986). The expected value from Monte Carlo in the absence of neutrino oscillations is . The expected value is lower than one because of the different selection efficiencies for upward- and downward-going events and the presence of background. The upward-going/downward-going double ratio is:
This is approximately two standard deviations from unity, which is the expectation in the absence of neutrino oscillations. The systematic error is dominated by the experimental uncertainties; the estimated systematic uncertainty on the predicted up/down neutrino flux ratio is less than 1 %Barr due to the relatively high energy of the selected neutrino events.
VI.1 Oscillation Analysis
In the two-flavour approximation, which is adequate for the level of statistical precision considered here, the survival probability, is given by
where is the distance traveled by the neutrino and is the neutrino energy. The neutrino path length, , is calculated from the reconstructed zenith angle assuming the neutrinos are produced at a height of km in the Earth’s atmosphere. Figure 11 shows the reconstructed distribution for the candidate events with good timing.
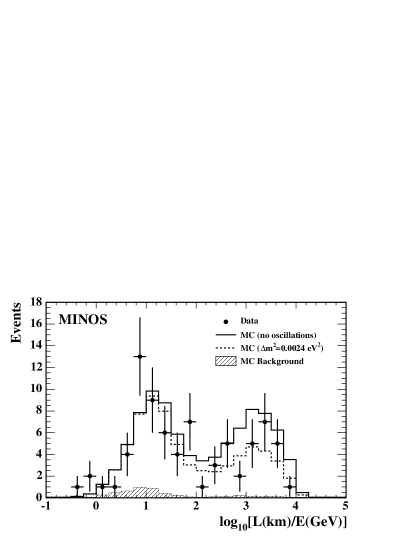
The reconstructed distribution is used as the basis for a fit to the hypothesis of oscillations. The resolution on differs greatly event-to-event for three main reasons: for PC events the muon momentum from curvature may be poorly determined; for low energy and/or high events the opening angle between the observed muon and the true neutrino direction is large; and in the case where the muon direction is close to the plane defined by the horizon, relatively small changes in angle produce large changes in . To address the first issue, PC events with little observable curvature, , are not used in the fit to the distribution. To account for the different resolutions, in the oscillation fit the data are binned according to resolution. To estimate the event resolution a Bayesian approach has been adopted which allows the event-by-event probability density function (pdf) to be determinedThomson . The rms of the pdf, , gives a measure of the resolution of the event. For example, Figure 12 shows the data binned in four regions of . For MC, the sensitivity of the distribution to neutrino oscillations increases with decreasing .

VI.1.1 Oscillation Analysis: Fit Procedure
The selected events are divided into 10 equal sized bins of the estimated uncertainty in reconstructed ratio, , ranging from . Events with are included in the lowest resolution sample and events with are included in the highest resolution. A simultaneous fit is performed to the overall normalization (using all selected events), the up-down ratio for events with good timing, and separately the shapes of the upward and downward distributions for events with good timing and . In this way, each event is used only when the physical observable being fitted is well-measured. A maximum likelihood fit to the data is performed using the negative log-likelihood function:
where is the total number of observed events and is the total Monte Carlo expectation. The first two terms represent the Poisson probability of observing events given the expectation of . The normalization systematics uncertainties are included as nuisance parameters (see below). In the remaining terms, the superscript refers to the bin in . The sum
is the “up-down” likelihood. Here and are the observed numbers of upward and downward-going events with good timing in bin of resolution; and are the Monte Carlo probabilities that an event in resolution bin is upward or downward going (). The terms
are the likelihood functions for the observed distributions of upward- and downward-going events respectively. Here the summations are over the reconstructed upward and downward events respectively; is the normalized Monte Carlo pdf for the reconstructed distribution in the bin of resolution (that of the event), evaluated at the measured value of of the event. The MC expectations for , , , and include contributions from both neutrino interactions and cosmic-ray background and depend on (, ) and the nuisance parameters representing the systematic uncertainties. In calculating the expectations as a function of oscillation parameters, the oscillation probabilities are averaged over the distribution of neutrino production heights obtained from the Bartol 3D model. In the fit, systematic effects are included using the nuisance parameters, , which represent the deviation of a particular parameter from its nominal value. The nuisance parameters contribute to the likelihood function through the terms
where is the estimated systematic uncertainty. The following systematic effects are included: i) the uncertainty on the expected neutrino event rate is taken to be ; ii) a 3 % uncertainty on the muon momentum and a 5 % uncertainty on the hadronic energy scale; iii) a 3 % uncertainty on the relative efficiency for selecting upward- versus downward-going events; iv) to accommodate the uncertainty in the shape of the neutrino energy spectrum, the spectrum is allowed to scale according to for GeV and for GeV, where is normal distributed (these variations cover the differences in the neutrino energy spectra obtained from different flux modelsBarr et al. (2004); Battistoni et al. (2003); Agrawal et al. (1996)); and v) to allow for uncertainties in the modelling of neutrino cross sections, the relative cross section for quasi-elastic interactions is assumed to have a 20 % uncertainty. Since the neutrino flux times cross section is normalized to Soudan 2 data, in the fit the systematic error associated with the QE fraction only affects the shapes of the reconstructed distributions.
With the exception of normalization, the systematic uncertainties have little impact on the resulting confidence regions. The above form of the likelihood function is chosen to simplify the inclusion of systematic errors in the fit: as normalization and up-down ratio are treated independently of shape.
VI.1.2 Oscillation Analysis: Results
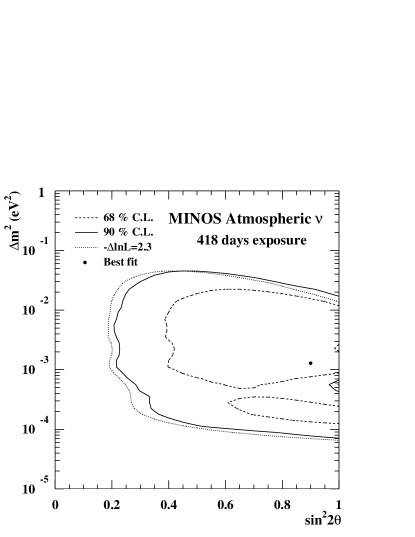
For each hypothesized value of (,) the negative log-likelihood function described above is minimized with respect to the nuisance parameters. For the data, the minimum likelihood occurs at . The 90 % confidence limits are obtained from the difference in the log-likelihood function . Here is the value of the negative log-likelihood function for the best fit to the data. In the limit of Gaussian errors, the 90 % confidence level allowed regions of parameter space are defined by . The frequentist approach of Feldman and CousinsFeldman and Cousins (1998) is used to determine the value of which corresponds to a particular confidence level. For each point in parameter space, (,), 1000 Monte Carlo experiments are generated. In each experiment a value for each systematic bias is drawn from a Gaussian distribution with standard deviation equal to the estimated systematic uncertainty. The generated data sample is fitted in the same manner as the data and the value of is determined. The generated point is included in the 90 % confidence region if less than 90 % of the experiments yield a smaller value than obtained in the data. For the MINOS data the 68 % and 90 % confidence limits obtained using the Feldman and Cousins approach are shown in Figure 13. The 90 % C.L. contour is close to that obtained using . With the current statistics, the MINOS atmospheric neutrino data are consistent with a wide range of oscillation parameters including the most recent results from Super-KamiokandeAshie et al. (2004) and K2KAliu et al. (2005). The data disfavor the null oscillation hypothesis at the confidence level.
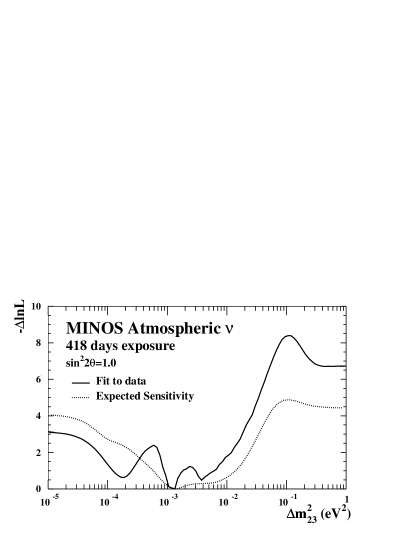
For completeness, Figure 14 shows the likelihood as a function of for . The rises at large and small values of are mainly due to the normalization and up-down ratio. The structure within this broad minimum arises from the fit to the shape of the distribution. The quality of the fit is good. As a measure of the fit quality, 10000 simulated experiments were generated with and the minimum value of determined; in 84 % of these experiments the minimum value of exceeded that obtained from the fit to the data. Figure 14 also shows the expected sensitivity.
VI.2 Charge Ratio
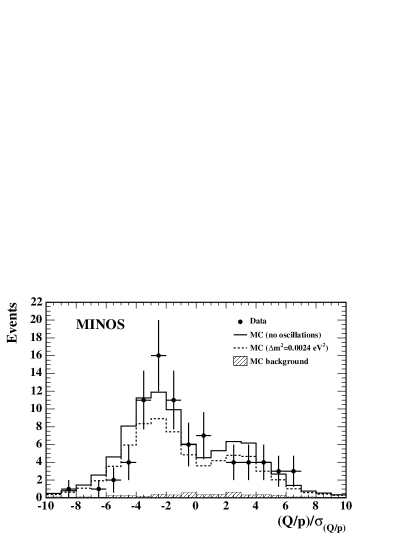
The selected contained events with unambiguous timing information are divided into neutrino and anti-neutrino interactions on the basis of the reconstructed muon charge obtained from the curvature of the reconstructed muon track. Only events with unambiguous direction from timing are considered; events with an incorrect direction will be reconstructed with the wrong zenith angle and will have their charge inverted. Figure 15 shows the distribution of for the events with well determined direction from timing compared to the MC expectation. Events are classified as: for ; for ; or events which are ambiguous, . The selected numbers of events in each charge category are compared to the MC expectations in Table 4.
| Selection | Data | Expected | Expected |
|---|---|---|---|
| no oscillations | |||
| Low Res. | |||
| Ambig. / | |||
Of the events where it is possible to cleanly tag the charge of the muon, 18 are identified as candidates and 34 as candidates, yielding a to ratio of:
The systematic uncertainty is the experimental uncertainty associated with charge identification. The uncertainty was estimated by shifting and smearing the Monte Carlo reconstructed values of whilst maintaining reasonable agreement between data and Monte Carlo for the stopping muon data shown in Figure 3. For the purposes of studying possible biases in the charge reconstruction, 37 % of the data were recorded with the coil current reversed. Consistent values for the / ratio are found in the normal and reversed current data samples; 22(12) events are identified as and 12(6) are identified as in the normal(reversed) field data samples. From Monte Carlo, the expected ratio of identified to events is , where it is assumed that both neutrinos and anti-neutrinos oscillate with the same parameters. This expected ratio is almost independent of the values of the oscillation parameters provided they are the same for neutrinos and anti-neutrinos. The ratio of to events in the data compared to the Monte Carlo expectation (Bartol 3D and NEUGEN3) assuming the same oscillation parameters for neutrinos and anti-neutrinos is:
The statistical errors correspond to the 68 % confidence interval calulated using Poisson statisticsGehrels (1986). The systematic error includes the experimental uncertainty associated with the muon charge identification (), the uncertainty in the relative to flux () and the relative uncertainty in the to cross section (). The systematic errors on the relative to fluxes and cross sections were estimated taking into account the energy spectra of the charge-tagged neutrino and anti-neutrino events. From Monte Carlo, the sample of events where the charge of muon is cleanly identified has a mean neutrino energy of 3.7 GeV, with 95 % of the expected events having neutrino energies between 1 GeV and 10 GeV. In Monte Carlo, 40 % of these events arise from quasi-elastic interactions, 30 % arise from resonance production, and 30 % from deep inelastic scattering. In this energy range the uncertainty on the ratio of atmospheric to flux was estimated to be 8 %Gaisser and Stanev (2003) for the Bartol 1D model. Recent studies based on the Bartol 3D model give an estimated uncertainty of 4 %Barr . Since there is limited data on anti-neutrino cross sections in the energy range Erriquez et al. (1979); Fanourakis et al. (1980); Anikeev et al. (1996), the variation in the predicted / event rate was studied through conservative changes to the neutrino cross section model. The variations considered include parameters affecting the free nucleon cross sections such as axial vector masses, choice of PDF set, and model for the resonance region. Similarly the effect of changes to the nuclear physics model which affect the rate via Pauli blocking of quasi-elastic and nuclear shadowing of DIS events was studied. The quadrature sum of these changes is 13.5 %. The largest contribution to this uncertainty comes from the treatment of resonance production and the resonance/DIS transition region. A 12 % difference is found in comparing a model which explicitly includes resonance production Gallagher (2002); Rein and Sehgal (1981) versus one which uses a QCD-based approach Bodek and Yang (2004). The size of this difference ultimately reflects the uncertainty in the experimental data to which these models are tuned.
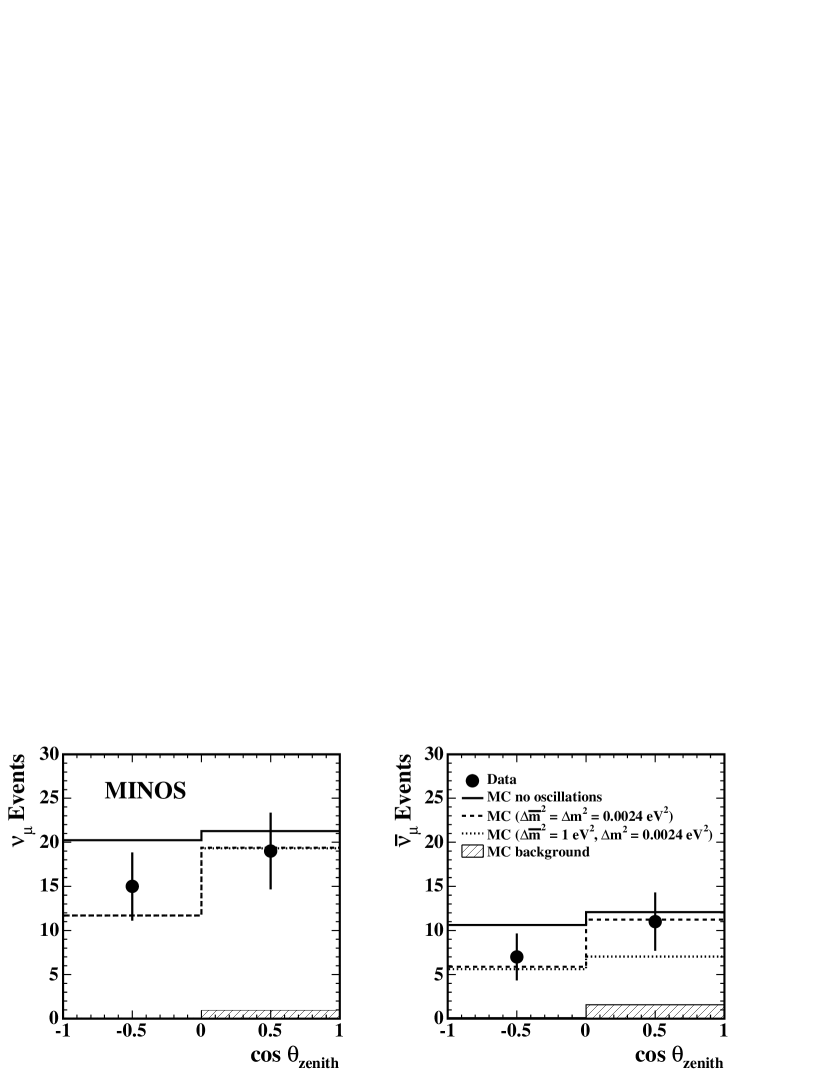
CPT violating models which attempt to explain the LSND data suggest a large value of for anti-neutrinosMurayama and Yanagida (2001); Barenboim et al. (2002). In principle, the MINOS data will be able to address this possibility by measuring the oscillation parameters for the selected anti-neutrino sample. Figure 16 shows up/down distribution of the 18 and 34 events compared to the expectation for: i) no oscillations; ii) the case where both and oscillate with (maximal mixing) and; iii) the case where oscillate with (maximal mixing) and oscillate with (maximal mixing). The data are consistent with the same oscillation parameters for neutrinos and anti-neutrinos. However, with the current statistics the possibility of a large value of for anti-neutrinos cannot be excluded.
VII Summary
The MINOS far detector has been taking data since the beginning of August 2003 at a depth of 2070 meters water-equivalent in the Soudan mine, Minnesota. This paper presents the first MINOS observations of and charged current atmospheric neutrino interactions based on an exposure of . A total of candidate contained-vertex neutrino interactions is observed, consistent with both the expectation of for no neutrino oscillations and for eV2 and . The expected numbers of events include the estimated background from cosmic-ray muons, , obtained from data. The errors on the expectation are dominated by uncertainty on the neutrino event rate which was obtained using results from the Soudan 2 collaboration. Of the events for which the direction can be cleanly identified, the ratio of upward to downward-going events in the data is compared to the Monte Carlo expectation in the absence of neutrino oscillations giving:
An extended maximum likelihood fit to the observed distribution yields a best fit value of and 90 % confidence limits of . The consistency of the data with the null hypothesis of no neutrino oscillations is investigated; the data exclude the null hypothesis at the confidence level.
The curvature of the observed muons in the 1.3 T MINOS magnetic field is used to separate and interactions. Of the selected events for which it is possible to cleanly determine the charge of the muon, are identified as candidates and as candidates, giving an observed to ratio of . The fraction of events in the data is compared to the Monte Carlo expectation assuming neutrinos and anti-neutrinos oscillate in same manner giving:
Although the statistics are limited, this is the first direct observation of atmospheric neutrino interactions separately for and . The data are consistent with neutrinos and anti-neutrinos oscillating with the same parameters, although CPT violating scenarios with large values of for anti-neutrinos are not excluded with the current data.
Acknowledgements.
This work was supported by the U.S. Department of Energy, the U.K. Particle Physics and Astronomy Research Council, the U.S. National Science Foundation, the State and University of Minnesota, the Office of Special Accounts for Research Grants of the University of Athens, Greece, and FAPESP (Fundacao de Amparo a Pesquisa do Estado de Sao Paulo) and CNPq (Conselho Nacional de Desenvolvimento Cientifico e Tecnologico) in Brazil. We gratefully acknowledge the Minnesota Department of Natural Resources for their assistance and for allowing us access to the facilities of the Soudan Underground Mine State Park. We also thank the crew of the Soudan Underground Physics Laboratory for their tireless work in building and operating the MINOS far detector.References
- Fukuda et al. (1998a) Y. Fukuda et al. (Super-Kamiokande), Phys. Lett. B 433, 9 (1998a).
- Fukuda et al. (1998b) Y. Fukuda et al. (Super-Kamiokande), Phys. Rev. Lett. 81, 1562 (1998b).
- Fukuda et al. (1998c) Y. Fukuda et al. (Super-Kamiokande), Phys. Rev. B 436, 33 (1998c).
- Fukuda et al. (1999a) Y. Fukuda et al. (Super-Kamiokande), Phys. Lett. B 467, 185 (1999a).
- Fukuda et al. (1999b) Y. Fukuda et al. (Super-Kamiokande), Phys. Rev. Lett. 85, 2644 (1999b).
- Ashie et al. (2005) Y. Ashie et al. (Super-Kamiokande), Phys. Rev. D 71, 112005 (2005).
- Ambrosio et al. (2003) M. Ambrosio et al. (MACRO), Phys. Lett. B 566, 35 (2003).
- Sanchez et al. (2003) M. Sanchez et al. (Soudan 2), Phys. Rev. D 68, 113004 (2003).
- Ashie et al. (2004) Y. Ashie et al. (Super-Kamiokande), Phys. Rev. Lett. 93, 101801 (2004).
- Aliu et al. (2005) E. Aliu et al. (K2K), Phys. Rev. Lett. 94, 081802 (2005).
- Adamson et al. (1998) P. Adamson et al. (MINOS), Minos technical design report numi-l-337 (1998), URL www-numi.fnal.gov/minwork/info/minos_tdr.html.
- Murayama and Yanagida (2001) H. Murayama and T. Yanagida, Phys. Lett. B 520, 263 (2001).
- Barenboim et al. (2002) G. Barenboim, L. Borissov, J. Lykken, and A. Smirnov, JHEP 0210, 001 (2002).
- Aguilar et al. (2001) A. Aguilar et al. (LSND), Phys. Rev. D 64, 112007 (2001).
- Gonzalez-Garcia et al. (2003) M. Gonzalez-Garcia, M. Maltoni, and T. Schwetz, Phys. Rev. D 68, 053007 (2003).
- Oliver et al. (2005) J. Oliver et al., IEEE Trans. Nucl. Sci. 51, 2193 (2005).
- Belias et al. (2005) A. Belias et al., IEEE Trans. Nucl. Sci. 51, 451 (2005).
- Adamson et al. (2004) P. Adamson et al., Nucl. Inst. & Meth. 521, 361 (2004).
- Hartnell (2005) J. Hartnell, D.Phil. thesis, University of Oxford (2005).
- (20) S. Giani et al., GEANT Detector Description and Simulation Tool, CERN Program Library Long Writeup W5013.
- Barr et al. (2004) G. Barr, T. Gaisser, P. Lipari, S. Robbins, and T. Stanev, Phys. Rev. D 70, 023006 (2004).
- Gallagher (2002) H. Gallagher, Nucl. Phys. B (Proc. Suppl.) 112, 188 (2002).
- Agrawal et al. (1996) V. Agrawal, T. Gaisser, P. Lipari, and T. Stanev, Phys. Rev. D 53, 1314 (1996).
- Battistoni et al. (2003) G. Battistoni, A. Ferrari, T. Monturuli, and P. Sala, Astroparticle Phys. 19, 269 (2003).
- (25) P. Adamson et al., The MINOS Calibration Detector, to be published in NIMA.
- (26) GCALOR program, URL http://wswww.physik.uni-mainz.de/zeitnitz/gcalor/gcalor.html.
- Kordosky (2004) M. Kordosky, Ph.D. thesis, University of Texas at Austin (2004), FERMILAB-THESIS-2004-34.
- (28) G. Bower and R. Cassell, GHEISHA (SLAC version), private communication.
- Allison et al. (2005) W. Allison et al. (Soudan 2), Phys. Rev. D 72, 052005 (2005).
- (30) G. Barr, private communication.
- Blake (2005) A. Blake, Ph.D. thesis, University of Cambridge (2005).
- Agostinelli et al. (2003) S. Agostinelli et al. (GEANT4 Collaboration), Nucl. Inst. & Meth. 506, 250 (2003).
- Gehrels (1986) N. Gehrels, Astrophys. J. 301, 336 (1986).
- (34) M. Thomson, A Bayesian Approach to Fitting Atmospheric Neutrino Data, to be submitted to NIMA.
- Feldman and Cousins (1998) G. Feldman and R. Cousins, Phys. Rev. D 57, 3873 (1998).
- Gaisser and Stanev (2003) T. Gaisser and T. Stanev, Phys. Lett. B 561, 125 (2003).
- Erriquez et al. (1979) M. Erriquez et al., Phys. Rev. B 80, 309 (1979).
- Fanourakis et al. (1980) G. Fanourakis et al., Phys. Rev. D 21, 562 (1980).
- Anikeev et al. (1996) V. Anikeev et al., Z. Phys. C 70, 39 (1996).
- Rein and Sehgal (1981) D. Rein and L. Sehgal, Ann. of Phys. 133, 79 (1981).
- Bodek and Yang (2004) A. Bodek and U. Yang, AIP Conf. Proc. 721, 358 (2004).