B meson mixing at CDF II
Abstract
We present the first limit on mixing frequency obtained using 360 of Tevatron Run II data with the CDF II detector. We derive C.L. with a sensitivity of 8.4.
1 Introduction
In the Standard Model (SM) flavor mixing of neutral mesons is induced by second-order charged weak interactions through box diagrams. For the mixing frequency, , is and thus provides a constraint on the usual unitarity triangle whereas for and is much higher since . Theoretical uncertainty on the hadronic parameters make the constraint from the precise measurement weak. On the other end a measurement of the mixing frequency ratio would fix the ratio of hadronic parameters thus allowing a much tighter constraint on the unitarity triangle. The expected range for from the analysis of all available B and Kaon physics data within the SM is getting narrower and narrower ( [1]). Observing mixing outside the SM favored range would be a signal for new physics. Experiments at LEP and SLD as well CDF in Run I have only provided a lower limit C.L. [2]. The high frequency expected for flavor oscillations poses formidable experimental challenges related to the need for extremely accurate proper time resolution in order to resolve the oscillation pattern. This is clearly reflected in the approximate expression for the significance of the mixing amplitude measurement [3]
| (1) |
where is the signal sample size, is the background, is the efficiency for flavor tagging and is the tagging dilution defined as , where the mistag rate is the fraction of B candidates with an incorrectly assigned flavor. The effect of finite resolution on proper time () reduces the statistical significance of the measurement, especially at high values of . A key point of the CDF upgrade for Run II has been the capability of triggering on hadronic decays of mesons allowing the collection of fully reconstructed decays. Despite the limited statistics available in these modes the excellent proper time resolution significantly helps the current sensitivity of CDF and will offer the unique chance of a determination of from CDF data alone. We describe here the first search for mixing using 360 of Run II data.
2 CDF II Detector and Trigger
The upgraded CDF detector for Run II [4] has been designed to enhance the sensitivity to mixing, in particular with the L00 [5] layer of silicon detector very close to the beam pipe, the TOF system [6] and the Silicon Vertex Tracker (SVT) [7]. This latter device, reconstructing on-line tracks in the silicon tracker, enabled triggering on -decay vertices, for the first time at a hadron collider. The current CDF physics related trigger menu is based on the following selections:
-
•
Di-muons with muon transverse momenta to select decays.
-
•
Single muon or electron with associated with a displaced trigger track with impact parameter greater than 120 (lepton+SVT).
-
•
A Two Track Trigger (TTT) requiring two displaced SVT tracks with impact parameters greater than 120 , consistent with originating at a vertex 200 away from the beam axis.
These different triggers provide large samples of, respectively, , and used to calibrate the vertex resolution function, the flavor-tagging dilution and to extract the impact parameter trigger bias. These measurements are an essential part of the mixing study making the latter really the “ultimate” -physics analysis at CDF.
3 Signal samples
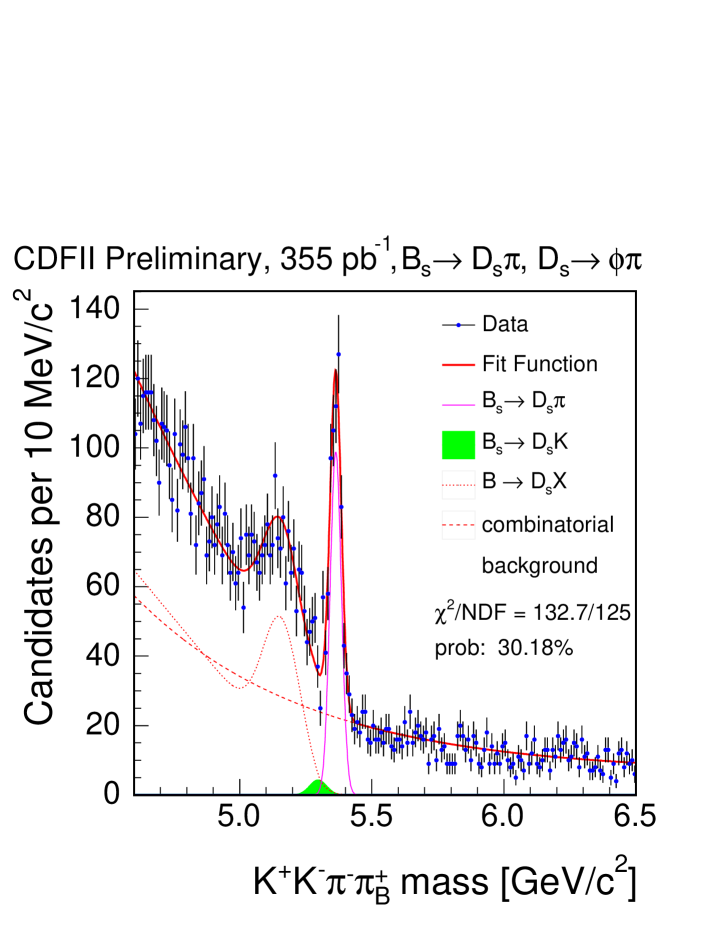
Currently we reconstruct (hadronic analysis) and channels (semileptonic analysis). In both cases the , and decay modes are used, where the light meson resonances are detected in the and channels only. These modes combined correspond to 4.9% of the total decay rate.
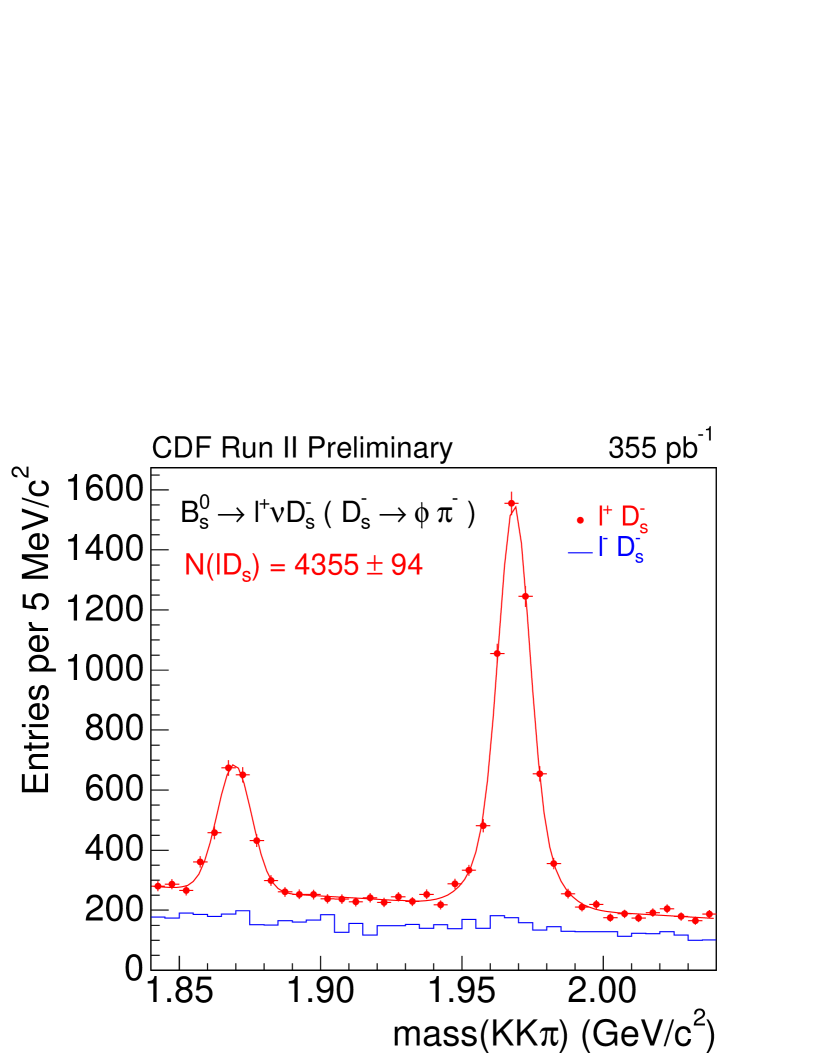
meson signals are identified as sharp peaks either in the reconstructed mass for hadronic decays or in the mass for opposite sign combinations of a lepton ( or ) and a meson candidate.
meson candidates are reconstructed starting from charged tracks and leptons matched to trigger objects satisfying on-line trigger selections, in order to accurately model trigger biases to the signal proper time distribution through Monte Carlo (MC) simulations. To ensure optimal vertexing and momentum resolution only tracks reconstructed both in the central drift chamber and in the silicon vertex detector with a minimum transverse momentum of 400 are used. A secondary/tertiary vertex fit is performed on all possible track combinations using a mass constraint on mesons involved in hadronic decays. Further selection criteria have been designed to optimize , using MC simulations for signal and sideband data for background.
Hadronic decays are selected requiring a significantly displaced secondary vertex and a tertiary vertex consistent with a downstream decay of a charmed meson. Selecting high probability vertex fit reduces combinatorial background and a minimum on the pion from decay is required to reduce background from production in events combined with a fragmentation track. Remaining background sources are combinatorics and partially reconstructed decays. The former is modeled by exponential functions and fixed by fits to the high mass sideband while the latter appear as a well separated bump to the low mass side of the signal peak. From MC simulation we derive shapes for the contributions from decays like or where the or escape undetected. Other backgrounds considered are Cabibbo-suppressed decays (whose contribution is fixed to the analogous decay rate) and reflections from b-baryon and decays whose shapes and relative contributions are fixed to those expected from simulation.
| Decay Channel | Yield | S/B |
|---|---|---|
| , | 1.8 | |
| , | 1.7 | |
| , | 1.0 | |
| , | 3.1 | |
| , | 0.4 | |
| , | 0.3 |
Similar selection criteria are used to isolate semileptonic decays. Further requests on the and helicity angle and on the the lepton + invariant mass () reduce combinatorial and background. An important background (of order 20% of the signal sample) arises from with decays. The expected contribution is determined from MC using world average branching ratios and considered in the mixing analysis with proper lifetime and mixing probabilities. The background from real prompt paired with a random track faking a lepton (prompt background) is estimated from wrong sign, , signal. Its contribution is about 4% of the right sign sample.
4 Proper Time Reconstruction and Resolution
| Tagger | ||||
|---|---|---|---|---|
| SMT | 35.9 | 5.0 | ||
| SET | 29.4 | 3.5 | ||
| JVX | 16.9 | 9.8 | ||
| JJP | 11.5 | 14.0 | ||
| JPT | 5.0 | 52.0 | ||
| Total | 35.9 | 5.0 |
The proper decay time of mesons is reconstructed using the distance in the transverse plane from the beam axis to the decay vertex () and the transverse momentum of the candidates: . For semileptonic decays a K factor is needed to compensate for missing momentum carried by neutrinos where is reconstructed from the lepton + transverse momentum. The K factor distribution is derived from MC simulation of inclusive semileptonic decays.
The time dependent mixing probability is convoluted with a Gaussian resolution function using the event-by-event expected error on . The latter includes a scale factor derived studying the proper time resolution function on a sample of pseudo- candidates constructed from a prompt meson paired with a fragmentation track. This sample exhibits characteristics very similar to those of the signal and allows the parameterization of the scale factor as a function of several kinematic variables. The average uncertainty for the golden , mode is corresponding to 60-70 resolution on the decay length. Note that the exponential term in eq. 1 implies a 60% loss of statistical power for 100 resolution at . Improving the proper time measurement accuracy, e.g. by using an event-by-event primary vertex, will certainly help in a future updated analysis.
5 Lifetime Measurement
Determinations of -meson lifetimes in several exclusive and decay channels provide an important check on the accuracy of proper time measurement. This has been successfully performed [8] using and semileptonic decays collected with a version of the trigger with no impact parameter requirement on tracks. For the present mixing analysis an additional crucial point has been the removal of the bias introduced by the trigger and offline selection criteria. A detailed Monte Carlo simulation of the trigger, including the effects of the variations with time of the beam axis position with respect to the detector and of trigger algorithms, has been used to derive the efficiency as a function of proper time for each of the decay modes analyzed. This method has been validated measuring and lifetime in modes collected by the same trigger used for the mixing analysis. The results (, , ) are consistent with world averages. The systematics are at the level of 1% and demonstrate that the the trigger bias is well under control. A similar analysis is currently under way using the same semileptonic sample used here. When completed, it will give the best measurement of lifetime in a flavor specific decay. For the time being a result consistent with the world average with a statistical uncertainty of 2% has been reported by CDF.
6 Flavor Tagging
Identifying the initial flavor of the mesons at hadron colliders has always been a critical task due to the busy environment of events in collisions. To determine the flavor algorithms have been developed relying either on the other -hadron in the event, Opposite Side (OS) taggers, or on the expected charge correlation () between the flavor and the kaons emerging close to the flight direction from the fragmentation and hadronization process, Same Side Kaon (SSK) tagger. Five different OS taggers are used here:
-
•
A Soft Muon Tagger (SMT), based on the detection of muons, with and pseudorapidity from decays. The dilution is parameterized as a function of a muon likelihood and muon momentum relative to the jet axis, , to account for the higher dilution expected at higher due to lower sequential background.
-
•
A similar algorithm, Soft Electron Tagger (SET), uses decays to electrons with detected in the central electromagnetic calorimeter.
-
•
Three different Jet Charge Taggers, where a weighted sum of track charges in opposite side jets is correlated with the initial -quark charge sign. The three algorithms differ on the choice of the tagging jet: jet containing an identified secondary vertex (JVX), jet characterized by at least one displaced track (JJP) or the highest jet in the event (JPT).
All the taggers have been tuned on an inclusive and almost pure sample of semileptonic decays from the lepton + SVT trigger. The dilution of each different algorithm is determined, as a function of several variables, from the the trigger lepton charge after correction for mixing and background. Taggers are ranked in order of their expected dilutions and only the decision from the highest dilution tagger available in any single event is used.
Since the calibration sample for the dilution may be different in certain aspects (e.g. spectra) from the signal sample a scale factor () is allowed for each of the 5 tagging algorithms. The factors for the semileptonic and hadronic analysis are fixed by measuring the oscillation frequency and its amplitude using respectively the high statistics and samples. A summary of the tagging figure of merit is reported in Tab. 2. The scale factors are consistent with 1 within the precision allowed by the present statistics.
7 Results and Perspectives
Following [3] an amplitude scan is performed, where, at each value of the mixing frequency, an amplitude is fitted from the data. The amplitude should be consistent with 0 for mixing frequencies far from the true value of and with 1 in its vicinity. This method allows for a straightforward way to combine several measurement (semileptonic and hadronic) as well as results from different experiments.
We determined systematic uncertainties on the amplitude using large toy MC experiments to minimize the effect of the limited statistics. The biggest effects on systematic uncertainties at high value of come from the level and the dilution parameterization of the prompt background for the semileptonic analysis (contributing ) and the dilution scale factor for the hadronic analysis (). It should be noticed that the latter will certainly be reduced with more data since it is limited by the available number of hadronic decays. In any case the combined systematic uncertainties are much smaller than the statistical uncertainties on the present measurements, for any value of the mixing frequency.
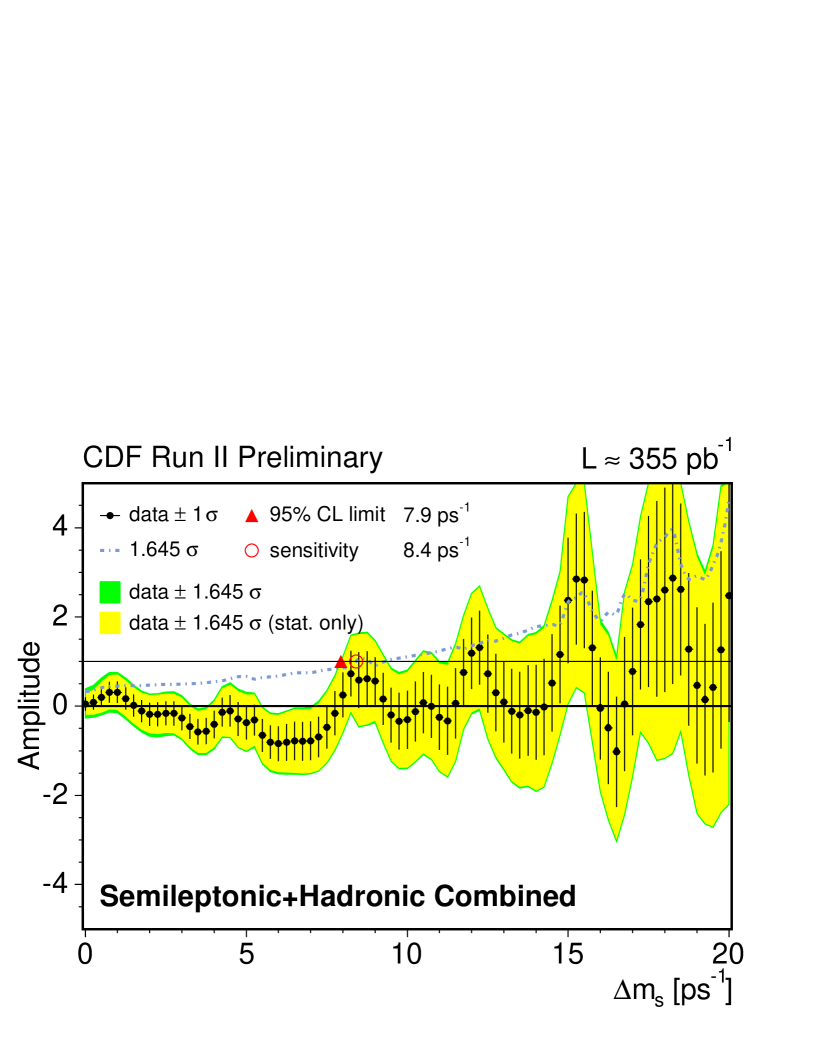
The present CDF sensitivity is dominated by the semileptonic result: C.L. with a sensitivity of 7.4 . The combined semileptonic and hadronic analysis limit is C.L. while the combined sensitivity increases to 8.4.
Combining the CDF mesaurement with previously available results does not change the actual limit and only marginally improves the sensitivity (from 18.2 to 18.6). It can be noticed, however, that the current sensitivity of CDF II data is relatively better behaved at higher than most of previous experiments due to the valuable hadronic sample that will dominate the sensitivity in future higher statistics searches for oscillations.
References
- [1] M. Bona et al. [UTfit Collaboration], JHEP 0507, 028 (2005) [arXiv:hep-ph/0501199].
- [2] S. Eidelman et al. [Particle Data Group], Phys. Lett. B 592, 1 (2004).
- [3] H.G.Moser and A.Roussarie, Nucl. Instrum. Meth. A 384 (1977)
- [4] D. Acosta et al., Phys. Rev. D71, 032001 (2005).
- [5] C.S. Hill et al., Nucl. Instrum. Meth. A 530,1 (2004).
- [6] D. Acosta et al., Nucl. Instrum. Meth. A 518,605 (2004).
- [7] W. Ashmanskas et al., Nucl. Instrum. Meth. A 518, 532 (2004).
-
[8]
Additional details can be found at:
http://www-cdf.fnal.gov/physics/new/bottom