Measurement of the meson lifetime with the KLOE detector
Abstract
We present a measurement of the lifetime using the KLOE detector. From a sample of pairs following the reaction we select decays tagged by events. From a fit of the proper time distribution we find ns. This is the most precise measurement of the lifetime performed to date.
PACS:
keywords:
, , , , , , , , , , , , , , , , , , , , , , , , , , , , , , , , , , , , , , , , , , , , , , , , , , , , , , , , , , , , , , , , , , , , , , , , , , , , , , , , , , 1 Corresponding author: Gaia Lanfranchi, INFN - LNF, CP 13, 00044 Frascati (Roma), Italy; e-mail: gaia.lanfranchi@lnf.infn.it
1 Introduction
The lifetime is necessary to determine its semileptonic partial widths from the branching ratios (BR). The partial widths can be used to extract the CKM matrix element . Present knowledge of comes from a single measurement performed more than 30 years ago [1] and its error dominates the uncertainty in the partial decay rates. At DAΦNE , the Frascati –factory , nearly monochromatic -mesons are produced with 110 MeV/c corresponding to a mean path of 340 cm. The KLOE detector is large enough, =200 cm, so that 50% of the decay inside it. The statistical error on the lifetime depends strongly on the time interval covered in the measurement [2]:
| (1) |
where is the time interval observed, in -lifetime units. With 0.4 and we can reach an accuracy of 0.3%.
We have measured the lifetime using the decay tagged by events. This choice maximizes the number of usable events and minimize the disturbance of the decay on the detection of the tagging decay and therefore the systematic uncertainty.
2 Experimental setup
In DANE electrons and positrons collide with an angle of 25 mrad and a center of mass (CM) energy . -mesons are produced with a cross section of 3 b and a transverse momentum of 12.5 MeV/c toward the center of the collider rings. The energy , the position of the beam crossing point () and the momentum are determined from Bhabha scattering events. In a typical run of integrated luminosity dt100 nb-1, lasting about 30 minutes, the corresponding errors are: =40 keV, =30 keV/c, m, and m.
The detector consists of a large cylindrical drift chamber, DC [3], whose axis, defined as the -axis, coincides with the bisectrix of the two beams. The DC is surrounded by a lead-scintillating fiber sampling calorimeter, EMC [4]. The DC and EMC are immersed in a solenoidal magnetic field of 0.52 T with the axis parallel to the beams’ bisectrix. The DC tracking volume extends from 28.5 to 190.5 cm in radius and is 340 cm long. The transverse momentum resolution is 0.4%. Vertices are reconstructed with a resolution of 3 mm. The calorimeter is divided into a barrel and two endcaps and covers 98 of the solid angle. Photon energies and arrival times are measured with resolutions and respectively. Photon entry points are determined with an accuracy along the fibers and 1 cm in the transverse direction. A photon is defined as an EMC cluster of energy deposits not associated to a track. We require that the distance between the cluster centroid and the entry point of the nearest extrapolated track be greater than 3, .
The trigger [5] uses information from the calorimeter and chamber. The EMC trigger requires two local energy deposits above threshold ( MeV in the barrel, MeV in the endcaps). Rejection of cosmic-ray events is also performed at trigger level, checking for the presence of two energy deposits above 30 MeV in the outermost calorimeter planes. The DC trigger is based on the multiplicity and topology of the hits in the drift cells. The trigger has a large time spread with respect to the beam crossing time. It is therefore re-synchronized with the machine radio frequency divided by four, = 10.85 ns, with an accuracy of 50 ps. During the 2001-2002 data taking the bunch crossing period at DAΦNE was =5.43 ns. The correct collision time, , of the event is determined off-line during event reconstruction [6].
3 Data analysis
-mesons decay into - pairs 34% of the time. Production of a is tagged by the observation of decay. The decay vertex is reconstructed along the direction opposite to that of the in the rest frame. The chamber alone measures the decay and therefore the direction of the . The decay vertex and the photon energies are obtained from EMC information. The data sample, collected during 2001 and 2002, corresponds to an integrated luminosity of 400 pb-1. Some -mesons were produced. Additional details can be found in reference [2]. decay events must satisfy the following requirements:
-
1.
There must be two tracks with opposite charge, forming a vertex V in a cylinder with cm, cm. No other tracks should be connected to the vertex.
-
2.
The momentum in the rest system, must satisfy MeV/c. The invariant mass must satisfy 492503 MeV/c2.
The efficiency for finding events is . The position of the production point, , is determined as the point of closest approach of the momentum, propagated backwards from the vertex, to the beam line. The decay provides an almost unbiased tag for the when it decays into neutral particles and a good measurement of the momentum, . The accuracy in the determination of the direction is obtained from events, measuring the angle between and the line joining the production point and the decay vertex. We find , .
The position of the vertex for decays is obtained from the photon arrival times at the EMC. Each photon defines a triangle CDE, see figure 1 (left), where is the path length, is the distance from the decay point D to the entry point E and is the distance from the cluster to the collision point C. From the known positions of C and E, the angle and the time spent by the kaon and the photon to cover the path CDE we find the length of CD. There are two solutions. One has D along the path and is rejected. The position D of the decay vertex is obtained from the energy weighted average of the two closest , where is the photon index. Finally we require at least one third photon with .
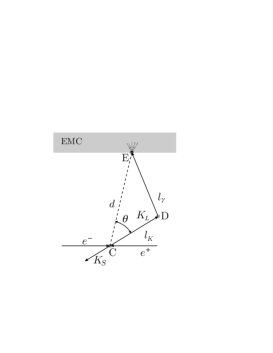

The accuracy of the determination is checked by comparing the path measured by timing with the calorimeter and, with a much better accuracy, by tracking with the DC, for decays. The path length from the calorimeter timing has on average a constant offset of 2 mm with respect to the value obtained with the DC, figure 1, right. The determination of depends crucially on the correct identification of the collision time . Using again events we have verified that is incorrect less than 0.1% of the time.
The resolution is determined from events by comparing and , where the former is the weighted average obtained from the two photons from and is the distance between the vertex of the two charged decay pions and the production point. An example of the distribution is shown in figure 2, left. It has been fitted both with a single and a double gaussian [2]. In the case of the double-gaussian fit the relative weights of the two components are free parameters of the fit. The single-gaussian fit gives an average resolution of cm. In the double-gaussian fit, the bulk of the distribution ( of the total) has cm, while the broader part () is well described by a gaussian with cm. The behaviour of the resolution has been studied as a function of : we find a quadratic dependence on in both cases (single and double-gaussian fit). For the single-gaussian fit we have cm (figure 2, right). In the double-gaussian fit the relative weights of the two components change as a function of . Since for each point the population weighted average of and agrees at the 10 level with the of a single-gaussian fit, we use the latter as estimate of the vertex resolution. The effects of the tails on the fit value are discussed in Section 6.


The tagging efficiency has been evaluated by MC as a function of for the dominant decay channels. The results are shown in figure 3.

The difference in tagging efficiency among the decay modes is mainly due to the dependence of the trigger efficiency. Only the calorimeter trigger [5] is used for the present analysis. The trigger efficiency is, on average, 100% for and between for charged decays. The trigger efficiency also depends on the position of the decay vertex. Another contribution is the dependence of the reconstruction efficiency for the pion tracks from on the presence of other tracks in the drift chamber. This contribution depends on the position of the decay point and affects mainly events with charged particles near the production point.
The tagging efficiency for the channel has a small linear dependence on , with a slope of /cm, and a constant .
4 acceptance
The decay has a relatively large BR, 21%, and has very low background. events are accepted if at least three calorimeter clusters are found satisfying:
-
1.
Energy larger than 20 MeV.
-
2.
Distance from any other cluster larger than 50 cm.
-
3.
No association to a chamber track.
-
4.
, where is the energy weighted average of the two values of nearest together.
For the lifetime measurement, we retain events with 40 165 cm and a polar angle in the interval . These two conditions define the fiducial volume (FV). The main sources of event losses are: 1) geometrical acceptance; 2) cluster energy threshold; 3) merging of clusters; 4) accidental association to a charged track; 5) Dalitz decay of one or more ’s. The effect of these inefficiencies is to modify the relative population for events with 3, 4, 5, 6, 7 and , clusters with a loss of global efficiency of .
Monte Carlo (MC) simulations, based on the KLOE standard MC [6] show that event acceptance with the above selection has a linear dependence on , with in cm, (figure 4, left) mainly due to the vertex reconstruction efficiency. This has also been checked using events both from data and MC. We find the same linear dependence, with compatible slopes within their statistical uncertainties, figure 4, right.


A comparison between data and MC of the photon multiplicity and total energy distributions for decays shows that only events with three and four clusters contain some background. Background, mostly to the three cluster events, is due to decays where one or two charged pions produce a cluster not associated to a track and neither track is associated to the vertex. Other sources of background are decays (possibly in coincidence with machine background showering close to the collision point generating soft neutral particles) and following regeneration in the DC material. The background and the other backgrounds in the three cluster sample are strongly reduced by requiring at least one cluster in the barrel with 50 MeV and no tracks approaching the line of flight by less than 20 cm. The efficiency vs for the three cluster sample has been found by MC. It is almost flat with an average 55% inside the FV.
In Table 1 we show the fractions of the background components before and after the background cuts. The background contamination is reduced from to with an efficiency on the signal of . The distributions of the total photon energy for events with photons are shown in figure 5. For three and four photon-cluster samples the different contributions from the residual background components are also shown.
The fractions of events with in the FV are given in Table 2, together with MC results. The few percent differences between data and MC are mostly due to a higher proportion of split clusters in the MC than in the data.
| 3 before cuts | 3 after cuts | |||
|---|---|---|---|---|
| channel | Events | B/(S+B) | Events | B/(S+B) |
| signal+backgrounds | 10,536,674 | 10,114,899 | ||
| all backgrounds | 518,520 | 4.92 | 133,535 | 1.32 |
| 325,076 | 3.08 | 44,917 | 0.44 | |
| 28,917 | 0.28 | 3,583 | 0.03 | |
| 49,140 | 0.47 | 6,062 | 0.06 | |
| 43,436 | 0.41 | 42,313 | 0.42 | |
| 30,273 | 0.29 | 28,166 | 0.28 | |
| 41,298 | 0.39 | 8440 | 0.08 | |


| Number of clusters | Data | Monte Carlo |
|---|---|---|
| 3 | 1.163 0.004 | 0.980 0.003 % |
| 4 | 7.64 0.01 | 7.01 0.01 % |
| 5 | 30.22 0.02 | 28.65 0.02 % |
| 6 | 57.77 0.03 | 60.12 0.03 % |
| 7 | 3.091 0.006 | 3.074 0.001 % |
| 0.106 0.001 | 0.151 0.001 % |
5 Fit of the proper time distribution
The proper time, , is obtained event by event dividing the decay length by of the in the laboratory, . In figure 6 we show the distribution obtained with tagged events. The residual background is subtracted using MC results. The variation of the vertex reconstruction efficiency as a function of the decay length is taken into account by correcting bin by bin the distribution with product of the MC efficiency (figure 4, left) and the data/MC efficiency ratios for (figure 4, right). The statistical uncertainty () of the efficiency estimate is included in the error.
Both the background subtraction and the vertex reconstruction efficiency correction affect the number of events per bin at the level and the combined effect of both corrections leaves the effective statistics essentially unchanged. Figure 6 is therefore representative of the sample statistics.
The distribution is fitted with an exponential function over the range 624.8 ns. This corresponds to a time interval 0.37. With events in the fit region we obtain:
with a -value of 58 for 62 degrees of freedom (figure 6).


6 Systematic uncertainties
The number of decays at the end of the selection is given by:
| (2) |
where is the residual background at the end of the signal selection, is the signal efficiency () and is the vertex resolution function. Finally is the effective mean decay length taking into account the interactions inside the chamber (in the gas mixture and wires) and is the mean decay length.
Many effects distort the proper time distribution and have been corrected for. The uncertainty in the corrections is included in the systematic error on the lifetime. As noted in Section 3, the tagging efficiency (figure 3) is well described by a linear function of with a constant term and a slope =/cm. While the tagging efficiency is easily parametrised, it has a significant effect on the overall statistics of the sample. Therefore, the value of the lifetime is corrected for the effects of the dependence of the tagging efficiency using an analytical correction: [2]. This results in a correction on the lifetime of with a systematic uncertainty of .
We also vary the threshold of the cluster energy of the pions from from 40 to 70 MeV in 10 MeV steps. The slope changes by 0.5% with a systematic uncertainty of .
As discussed, the vertex reconstruction efficiency has been corrected for its dependence on . We assign a systematic error of 0.2% due to the statistical uncertainty on the slope of the data/Monte Carlo efficiency ratios evaluated with events.
We investigate the effects of the cluster energy threshold for photons , by varying from 10 to 35 MeV in steps of 5 MeV and repeating the full analysis. The value of this threshold affects dramatically both the background contamination and the relative weights of the samples of different photon-cluster multeplicity. For example, if goes from 20 MeV to 15 MeV, the relative weight of the three photon-cluster sample is reduced by almost a factor 2 while the background increases by 20 %, affecting mainly the four photon-cluster sample. Nevertheless, the fit changes by for MeV, which we take as a systematic uncertainty. The total systematic uncertainty due to the event selection is therefore .
The effect of the vertex resolution on the fit value has been studied by smearing the values sampled from an exponential function with the measured ’s (as a function of ) both in the case of a single-gaussian fit and in the case of a double-gaussian fit [2]. In the second case, the smearing is performed by taking into account the relative weights of the two gaussians at a given . When the fit is performed to a generated sample of values without or with a smearing with the known resolution parameters, the lifetime value changes by well under 0.1 %. Resolution effects are thus negligible in determining the final value of lifetime. However, if the resolution parameters are larger than the measured values, the effect on the value of the lifetime is . The ’s are know at 1-2 % level. For the systematic uncertainty in the lifetime value for vertex resolution effects we assign a symmetric 0.1 % error, which is conservately based on the assumption that the resolution parameters can be underestimated by as much as 10 %.
interactions with the material inside the chamber bias the lifetime measurement since they reduce the mean path by [2]. The interaction rates for regeneration and or production are determined from data [7]. The contribution of the regeneration in the DC material is found to be 3 times lower in data than in the MC prediction. In data the contribution of the total nuclear interactions is to which we assign a conservative error of 50%, (0.330.16). Therefore, the lifetime is corrected by +0.33 with a systematic uncertainty of 0.16%.
The background (table 1) is subtracted from the proper time distribution using MC simulation. A residual correction of due to background subtraction has been added due to the fact that the background from the regeneration in the drift chamber material is a factor of three higher in the Monte Carlo than in data [7]. Therefore, from Table 1, the 0.28 contribution from the reaction must be reduced to and the global amount of background contamination from 1.32 to . This directly increases the fit value of the lifetime by .
An additional systematic error is due to uncertainties in the background scale and dependence in the three and four photon-cluster samples. Comparing bin-by-bin data and MC distributions for background with the combined three and four-cluster event samples after MC signal subtraction (figure 7), we find an agreement at the level, with a small linear dependence on . Although the agreement is at the level, we have conservatively taken the uncertainty in the overall background scale to be . The uncertainty in the background scale produces a systematic uncertainty in the lifetime value of . Correction for the background slope changes the fit result by +0.15% with an uncertainty of 0.06% due to the statistical precision of the slope value.
Uncertainties in the DC momentum scale and the absolute EMC time scale enter directly in the proper time evaluation and give systematic errors respectively of [6] and (figure 1, right).
The fit stability has been checked by changing the lower limit of the time interval used in the fit between 6 ns and 12 ns and the upper between 21 ns and 28 ns, independently. No change in is found within its statistical error. We have also checked the fit stability vs polar angle dividing the fiducial volume in two regions containing the same number of events. Specifically we chose events with and . The values of from the two zones are consistent to within the statistical accuracy.
In table 3 we summarize the corrections to be applied to the lifetime fit result and the corresponding systematic uncertainties.
| source | correction | systematic uncertainty |
|---|---|---|
| tagging efficiency | ||
| acceptance | bin by bin | |
| selection efficiency | bin by bin | |
| vertex resolution | - | |
| background subtraction | bin by bin, +0.2% | |
| background shape | +0.15% | |
| nuclear interactions | +0.33% | |
| momentum scale | - | |
| time scale | - | |
| total | +0.1 |
The corrections add to +0.1% and the central value of the fit is moved accordingly. The systematic error of is at present dominated by the uncertainty on the dependence of tagging efficiency with and by background subtraction. The final result is:
This result differs by 1.2 from the other direct measurement ns [1] and by 1.8 from the PDG 2004 fit [8], ns.
References
- [1] K. G. Vosburgh et al., Phys. Rev. Lett. 26 (1971), 866 and Phys. Rev. D6 (1972), 1834.
- [2] G. Lanfranchi Direct measurement of the lifetime, KLOE note n. 203, July 2005. URL: http://www.lnf.infn.it/kloe/pub/knote/kn203.ps
- [3] The KLOE Collaboration, M. Adinolfi et al., Nucl. Instr. and Meth. A488 (2002) 51.
- [4] The KLOE Collaboration, M. Adinolfi et al., Nucl. Instr. and Meth. A482 (2002) 363.
- [5] The KLOE Collaboration, M. Adinolfi et al., Nucl. Instr. and Meth. A492 (2002) 134.
- [6] F. Ambrosino et al., Nucl. Instr. Meth. A534 (2004), 403.
- [7] M. Antonelli, P. Beltrame, M. Dreucci, M. Moulson, M. Palutan, A. Sibidanov, Measurements of the absolute branching fractions for the dominant decays, the lifetime and with the KLOE detector, KLOE note n. 204 (2005). URL: http://www.lnf.infn.it/kloe/pub/knote/kn204.ps
- [8] S. Eidelman et al., Phys. Lett. B592 (2004) 1