First results of the search for neutrinoless double beta decay with the NEMO 3 detector
Abstract
The NEMO 3 detector, which has been operating in the Fréjus underground laboratory since February 2003, is devoted to the search for neutrinoless double beta decay (0). The half-lives of the two neutrino double beta decay () have been measured for 100Mo and 82Se. After 389 effective days of data collection from February 2003 until September 2004 (Phase I), no evidence for neutrinoless double beta decay was found from 7 kg of 100Mo and 1 kg of 82Se. The corresponding limits are years for 100Mo and years for 82Se (90% C.L.). Depending on the nuclear matrix element calculation, the limits for the effective Majorana neutrino mass are eV for 100Mo and eV for 82Se.
pacs:
23.40.-s; 14.60.PqI Introduction
The positive results obtained in the last few years in neutrino oscillation experiments SuperKSolar ; SuperKAtm ; SNO ; Kamland have demonstrated that neutrinos are massive particles and that lepton flavor is not conserved.
In parallel, tritium -decay experiments Mainz ; Troitsk have established a very low limit on the electron neutrino mass of eV (95% CL).
Grand Unified Theories can provide a natural framework for neutrino masses and lepton number violation. In particular the see-saw model Mohapatra1980 which requires the existence of a Majorana neutrino, naturally explains the smallness of neutrino masses.
The existence of Majorana neutrinos would also provide a natural framework for the leptogenesis mechanism Leptogenesis which could explain the observed baryon-antibaryon asymmetry in the universe.
The observation of neutrinoless double beta decay (0) would prove that neutrinos are Majorana particles and that global lepton number is not conserved.
It would also constrain the mass spectrum and the absolute mass of the neutrinos.
II The NEMO 3 detector
The NEMO 3 detector Augier2005 , installed in the Fréjus underground laboratory (LSM, France) is searching for decay by the direct detection of the two electrons with a combination of tracking and calorimeter information.
The two main isotopes present inside the detector in the form of very thin foils (40-60 mg/cm2) are 100Mo (6914 g, ) and 82Se (932 g, ).
On both sides of the sources, there is a gaseous tracking detector which consists of open drift cells operating in the Geiger mode allowing three-dimensional track reconstruction.
To minimize the multiple scattering, the gas is a mixture of 95% helium, 4% ethyl alcohol, 1% argon and 0.1% water.
The wire chamber is surrounded by a calorimeter which consists of plastic scintillator blocks coupled to very low radioactive photomultipliers (PMTs).
The energy resolution (FWHM) of the calorimeter is 14% at 1 MeV for the scintillators equipped with a 5” PMTs on the external wall and 17% for the 3” PMTs on the internal wall.
The resolution of the summed energy of the two electrons in the decay is mainly a convolution of the energy resolution of the calorimeter and the fluctuation in the electron energy loss in the foil source which gives a non-gaussian tail. The FWHM of the expected two-electron energy spectrum of the decay is 350 keV.
Absolute energy calibrations are carried out every 40 days using 207Bi sources.
A daily laser survey controls the gain stability of each PMT.
A solenoid surrounding the detector produces a 25 Gauss magnetic field in order to distinguish electrons from positrons.
An external shield of 18 cm of low radioactivity iron, a water shield and a wood shield cover the detector to reduce external and neutrons.
III Measurement of decays
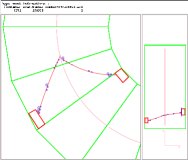
A two-electron (2) event (see Fig. 1) candidate for a decay is defined as follows:
two tracks come from the same vertex on the source foil, each track must be associated with a fired scintillator,
its curvature must correspond to a negative charge and the time-of-flight must correspond
to the two electrons being emitted from the same source position.
For each electron an energy threshold of 200 keV for 100Mo and 300 keV for 82Se is applied.
Fig. 2(a) and Fig. 3 show the two-electron energy sum spectra after background subtraction
obtained after 389 effective days of data collection with 100Mo and with 82Se respectively.
The angular distribution of the two electrons and the single energy spectrum are also
presented in the case of 100Mo in Fig. 2(b) and (c).
All these spectra are in good agreement with the simulations.
The values of the measured half-lives are
y for 100Mo
(with a Single State Dominance decay) and
y
for 82Se.
These values are in agreement with, but have a higher precision than the previous measurementsPDG .


IV Study of the background in the energy window
A complete study of the background in the energy window has been performed. The level of each background component has been directly measured using different analysis channels in the data.
External backgrounds due to 214Bi and 208Tl contaminants outside the source foils (mostly in the PMTs) have been measured by searching for Compton electrons emitted from the source foils by external . For 208Tl, a total activity of 40 Bq has been measured and is in agreement with the previous HPGe measurements of samples of the PMT glass. For 214Bi, an activity of 300 Bq has been found, again in agreement with the HPGe measurements of PMTs and also the level of radon surrounding the detector inside the shield. The expected number of -like events due to this background is negligible, counts.kg-1.y-1 in the MeV energy window where the signal is expected.
External neutrons and high energy backgrounds have been measured by searching for crossing electron events above 4 MeV. This corresponds to a negligible expected level of background of counts.kg-1.y-1 in the energy window.
The level of 208Tl impurities inside the sources has been measured by searching for internal () and () events. The measured activity is Bq/kg in molybdenum and Bq/kg in Selenium. It is in agreement with the previous HPGe measurements which gave an upper limit of 100 Bq/kg for Molybdenum and a positive measurement of Bq/kg for Selenium. This corresponds to an expected level of background in the energy window of counts.kg-1.y-1 for Molybdenum and counts.kg-1.y-1 for Selenium. The measurement of 214Bi impurities inside the sources could not be achieved in this first period of data due to Radon contamination (see later). However the previous HPGe measurements gave an upper limit of 350 Bq/kg for Molybdenum and a positive measurement of mBq/kg for Selenium, corresponding to a negligable expected level of backgound.
The expected level of background due to the tail of the distribution in the energy window is counts.kg-1.y-1 for Molybdenum and counts.kg-1.y-1 for Selenium.
The dominant background in this first period of data was Radon gas inside the tracking chamber due to a
low rate of diffusion of Radon from the laboratory (15 Bq/m3) into the detector.
Two independent measurements of the Radon level in the detector were carried out.
The first used a high sensitivity Radon detector similar to the one developed by the Super-Kamiokande
collaboration Takeuchi1999 .
The second was done by searching for (, delayed-) events in the NEMO 3 data.
Indeed the tracking detector allows the detection of the delayed tracks (up to 700 s later) in order
to tag delayed- emitted by 214Po in the Bi-Po process.
Both measurements are in good agreement and indicate a level of radon inside the detector of mBq/m3.
This radon contamination corresponds to an expected level of background in the
energy window of 1 count.kg-1.y-1.
V First results on the limitsearch of decay with 100Mo and 82Se
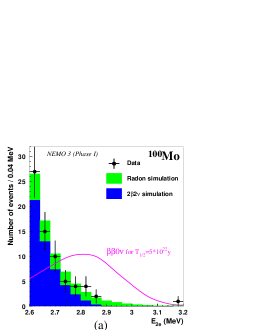
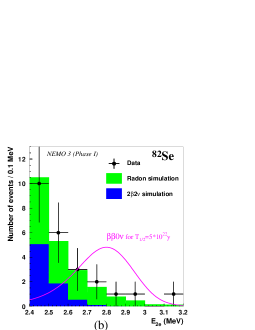
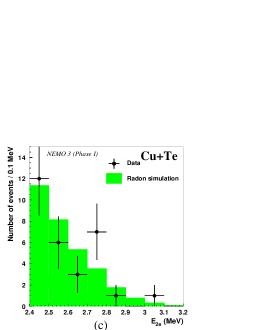
Fig. 4(a) and (b) show the tail of the two-electron energy sum spectrum in the energy window for 100Mo and for 82Se respectively. The number of 2 events observed in the data is in agreement with the expected number of events from and the Radon simulations. For 100Mo, in the energy window MeV, the expected background is (error dominated by the uncertainty on the Radon activity) and 7 events have been observed. For 82Se, in the energy window MeV, the expected background is and 5 events have been observed. In order to independently check the dominant Radon contribution above 2.8 MeV, the energy sum spectrum (Fig. 4.c) has been plotted for the two electrons emitted from the Copper and Tellurium foils where no background except radon is expected. The data are in agreement with the Radon simulations.
In order to make the optimum use of all the information from the NEMO 3 detector,
a maximum likelihood analysis Etienvre2003 has been applied to the 2 event
sample above 2 MeV using the three available variables: the energy sum () of the two electrons,
the energy of each electron ( is the minimum electron energy) and the angle between the two tracks ().
A three-dimensional probability distribution function, , can be written as:
where and are two conditional probability distribution functions.
The likelihood is defined as
where corresponds to one of the eight contributions: , ,
Radon, external and internal 214Bi and 208Tl, and neutrons.
Here is the ratio of the number of 2 events due to the
process relative to the total number of observed events .
Finally is built using simulated events of contribution .
With 389 effective days of data collection, limits at 90% C.L. obtained with the likelihood
analysis are years for 100Mo and
years for 82Se.
These limits are about 10 times higher than the previous
limits obtained with 100Mo and 82Se Ejiri2001 ; Arnold1998 .
The corresponding upper limits for the effective Majorana neutrino mass range
from 0.7 to 2.8 eV for 100Mo and 1.7 to 4.9 eV for 82Se depending on the nuclear matrix
element calculation Caurier1996 ; Rodin2005 ; Simkovic1999 ; Suhonen1998 ; Suhonen2003 ; Stoica2001 .
Results for each calculation are given in Table 1.
For 100Mo,
since an incorrect value of the phase-space factor has been used in reference Stoica2001 ,
the value calculated in reference Vogel1992 has been used.
The claim of a positive signal observed with 76Ge Klapdor2004
gives an allowed effective mass range eV. Our limit obtained with
100Mo slightly overlaps this range.
In the hypothesis of gluino or neutralino exchange, and using the nuclear matrix
elements calculated in reference FaesslerL111 , limits obtained on the trilinear
R-parity-violating supersymmetric coupling are
for 100Mo and for 82Se.
In the hypothesis of a right-handed weak current, the limits are
years at 90% C.L. for 100Mo and
years for 82Se, corresponding to an upper limit on the coupling
constant of for 100Mo and
for 82Se using the nuclear calculations from references Suhonen1998 ; Suhonen2002 .
| Nuclear matrix elements | 100Mo | 82Se | |
|---|---|---|---|
| Shell model | Caurier 1996 Caurier1996 | 4.9 | |
| QRPA | Rodin 2005 Rodin2005 | 2.7 - 2.8 | 4.1 - 4.5 |
| QRPA | Simkovic 1999 Simkovic1999 | 1.0 | 3.3 |
| QRPA | Suhonen 2003 Suhonen1998 ; Suhonen2003 | 1.1 | 2.8 - 4.2 |
| QRPA | Stoica 2001 Stoica2001 | 0.7 - 1.1 | 1.7 - 3.7 |
VI Conclusions
In conclusion, the NEMO 3 detector has been running reliably since February 2003. The decay has been measured for 82Se and 100Mo with very high statistics and better precision than the previous measurements. The two-electron energy sum spectrum, the single energy spectrum and the angular distibution are all in good agreement with the simulations. All components of the background in the energy window have been measured directly using different analysis channels in the data. After 389 effective days of data collection, no evidence for decay has been found in 100Mo or 82Se. The limits at the 90% C.L. are y for 100Mo and y for 82Se. For this first running period (Phase I) presented here, Radon was the dominant background at a level of about 3 times higher than the background for 100Mo. It has now been significantly reduced by a factor 10 by a radon-tight tent enclosing the detector and a radon-trap facility in operation since December 2004 which has started a second running period (Phase II). After five years of data collection, the expected sensitivity at 90% C.L will be y for 100Mo and y for 82Se, corresponding to eV for 100Mo and eV for 82Se.
A portion of this work was supported by grants from INTAS (03051-3431, 03-55-1689) and NATO (PST CLG 980022)
References
- (1) Y. Fukuda et al., Phys. Rev. Lett. 86 (2001) 5651
- (2) Y. Fukuda et al., Phys. Rev. Lett. 81 (1998) 1562
- (3) Q.R. Ahmad et al., Phys. Rev. Lett. 89 (2002) 011301
- (4) T. Araki et al., Phys. Rev. Lett. 94 (2005) 081801
- (5) C. Weinheimer et al., Nucl. Phys. B 118 (2003) 279
- (6) V. Lobashev et al., Nucl. Phys. B 91 (2001) 280
- (7) R.N. Mohapatra et al., Phys. Rev. Lett. 44 (1980) 912
- (8) M. Fukugita et al., Phys. Lett. B174 (1986) 45
- (9) R. Arnold et al., Nucl. Inst. Meth. A536 (2005) 79
- (10) Particle Data Group, K. Hagiwara et al., Phys. Rev. D66 (2002) 010001
- (11) A.I. Etienvre, PhD Thesis, University Paris-Sud (2003)
- (12) Y. Takeuchi et al., Nucl. Inst. Meth. A421 (1999) 334
- (13) H. Ejiri et al., Phys. Rev. C63 (2001) 065501
- (14) R. Arnold et al., Nucl. Phys. A636 (1998) 209
- (15) E. Caurier et al., Phys. Rev. Lett. 77 (1996) 1954
- (16) V.A. Rodin et al., Phys. Rev. C68 (2003) 044302, nucl-th/0503063
- (17) F. Simkovic et al., Phys. Rev. C60 (1999) 055502
- (18) M. Aunola et al., Nucl. Phys. A643 (1998) 207
- (19) J. Suhonen et al., Nucl. Phys. A723 (2003) 271
- (20) S. Stoica et al., Nucl. Phys. A694 (2001) 269
- (21) F. Boehm and P. Vogel, Physics of massive neutrinos, Cambridge Univ. Press, second edition (1992)
- (22) A. Faessler et al., Phys. Rev. D58 (1998) 115004
- (23) J. Suhonen, Nucl. Phys. A700 (2002) 649
- (24) H.V. Klapdor-Kleingrothaus et al., Nucl. Inst. Meth. A522 (2004) 371