DESY 05-110 ISSN 0418-9833
July 2005
Measurement of and
at Low and
using the H1 Vertex Detector at HERA
H1 Collaboration
Measurements are presented of inclusive charm and beauty cross sections in collisions at HERA for values of photon virtuality and of the Bjorken scaling variable . The fractions of events containing charm and beauty quarks are determined using a method based on the impact parameter, in the transverse plane, of tracks to the primary vertex, as measured by the H1 vertex detector. Values for the structure functions and are obtained. This is the first measurement of in this kinematic range. The results are found to be compatible with the predictions of perturbative quantum chromodynamics and with previous measurements of .
To be submitted to Eur. Phys. J. C
A. Aktas10, V. Andreev26, T. Anthonis4, S. Aplin10, A. Asmone34, A. Astvatsatourov4, A. Babaev25, S. Backovic31, J. Bähr39, A. Baghdasaryan38, P. Baranov26, E. Barrelet30, W. Bartel10, S. Baudrand28, S. Baumgartner40, J. Becker41, M. Beckingham10, O. Behnke13, O. Behrendt7, A. Belousov26, Ch. Berger1, N. Berger40, J.C. Bizot28, M.-O. Boenig7, V. Boudry29, J. Bracinik27, G. Brandt13, V. Brisson28, D.P. Brown10, D. Bruncko16, F.W. Büsser11, A. Bunyatyan12,38, G. Buschhorn27, L. Bystritskaya25, A.J. Campbell10, S. Caron1, F. Cassol-Brunner22, K. Cerny33, V. Cerny16,47, V. Chekelian27, J.G. Contreras23, J.A. Coughlan5, B.E. Cox21, G. Cozzika9, J. Cvach32, J.B. Dainton18, W.D. Dau15, K. Daum37,43, Y. de Boer25, B. Delcourt28, A. De Roeck10,45, K. Desch11, E.A. De Wolf4, C. Diaconu22, V. Dodonov12, A. Dubak31,46, G. Eckerlin10, V. Efremenko25, S. Egli36, R. Eichler36, F. Eisele13, M. Ellerbrock13, E. Elsen10, W. Erdmann40, S. Essenov25, A. Falkewicz6, P.J.W. Faulkner3, L. Favart4, A. Fedotov25, R. Felst10, J. Ferencei16, L. Finke11, M. Fleischer10, P. Fleischmann10, Y.H. Fleming10, G. Flucke10, A. Fomenko26, I. Foresti41, G. Franke10, T. Frisson29, E. Gabathuler18, E. Garutti10, J. Gayler10, C. Gerlich13, S. Ghazaryan38, S. Ginzburgskaya25, A. Glazov10, I. Glushkov39, L. Goerlich6, M. Goettlich10, N. Gogitidze26, S. Gorbounov39, C. Goyon22, C. Grab40, T. Greenshaw18, M. Gregori19, B.R. Grell10, G. Grindhammer27, C. Gwilliam21, D. Haidt10, L. Hajduk6, M. Hansson20, G. Heinzelmann11, R.C.W. Henderson17, H. Henschel39, O. Henshaw3, G. Herrera24, M. Hildebrandt36, K.H. Hiller39, D. Hoffmann22, R. Horisberger36, A. Hovhannisyan38, T. Hreus16, S. Hussain19, M. Ibbotson21, M. Ismail21, M. Jacquet28, L. Janauschek27, X. Janssen10, V. Jemanov11, L. Jönsson20, D.P. Johnson4, A.W. Jung14, H. Jung20,10, M. Kapichine8, J. Katzy10, N. Keller41, I.R. Kenyon3, C. Kiesling27, M. Klein39, C. Kleinwort10, T. Klimkovich10, T. Kluge10, G. Knies10, A. Knutsson20, V. Korbel10, P. Kostka39, K. Krastev10, J. Kretzschmar39, A. Kropivnitskaya25, K. Krüger14, J. Kückens10, M.P.J. Landon19, W. Lange39, T. Laštovička39,33, G. Laštovička-Medin31, P. Laycock18, A. Lebedev26, G. Leibenguth40, V. Lendermann14, S. Levonian10, L. Lindfeld41, K. Lipka39, A. Liptaj27, B. List40, E. Lobodzinska39,6, N. Loktionova26, R. Lopez-Fernandez10, V. Lubimov25, A.-I. Lucaci-Timoce10, H. Lueders11, D. Lüke7,10, T. Lux11, L. Lytkin12, A. Makankine8, N. Malden21, E. Malinovski26, S. Mangano40, P. Marage4, R. Marshall21, M. Martisikova10, H.-U. Martyn1, S.J. Maxfield18, D. Meer40, A. Mehta18, K. Meier14, A.B. Meyer11, H. Meyer37, J. Meyer10, S. Mikocki6, I. Milcewicz-Mika6, D. Milstead18, D. Mladenov35, A. Mohamed18, F. Moreau29, A. Morozov8, J.V. Morris5, M.U. Mozer13, K. Müller41, P. Murín16,44, K. Nankov35, B. Naroska11, Th. Naumann39, P.R. Newman3, C. Niebuhr10, A. Nikiforov27, D. Nikitin8, G. Nowak6, M. Nozicka33, R. Oganezov38, B. Olivier3, J.E. Olsson10, S. Osman20, D. Ozerov25, V. Palichik8, I. Panagoulias10, T. Papadopoulou10, C. Pascaud28, G.D. Patel18, M. Peez29, E. Perez9, D. Perez-Astudillo23, A. Perieanu10, A. Petrukhin25, D. Pitzl10, R. Plačakytė27, B. Portheault28, B. Povh12, P. Prideaux18, N. Raicevic31, P. Reimer32, A. Rimmer18, C. Risler10, E. Rizvi19, P. Robmann41, B. Roland4, R. Roosen4, A. Rostovtsev25, Z. Rurikova27, S. Rusakov26, F. Salvaire11, D.P.C. Sankey5, E. Sauvan22, S. Schätzel10, F.-P. Schilling10, S. Schmidt10, S. Schmitt10, C. Schmitz41, L. Schoeffel9, A. Schöning40, H.-C. Schultz-Coulon14, K. Sedlák32, F. Sefkow10, R.N. Shaw-West3, I. Sheviakov26, L.N. Shtarkov26, T. Sloan17, P. Smirnov26, Y. Soloviev26, D. South10, V. Spaskov8, A. Specka29, B. Stella34, J. Stiewe14, I. Strauch10, U. Straumann41, V. Tchoulakov8, G. Thompson19, P.D. Thompson3, F. Tomasz14, D. Traynor19, P. Truöl41, I. Tsakov35, G. Tsipolitis10,42, I. Tsurin10, J. Turnau6, E. Tzamariudaki27, M. Urban41, A. Usik26, D. Utkin25, S. Valkár33, A. Valkárová33, C. Vallée22, P. Van Mechelen4, A. Vargas Trevino7, Y. Vazdik26, C. Veelken18, A. Vest1, S. Vinokurova10, V. Volchinski38, B. Vujicic27, K. Wacker7, J. Wagner10, G. Weber11, R. Weber40, D. Wegener7, C. Werner13, N. Werner41, M. Wessels10, B. Wessling10, C. Wigmore3, Ch. Wissing7, R. Wolf13, E. Wünsch10, S. Xella41, W. Yan10, V. Yeganov38, J. Žáček33, J. Zálešák32, Z. Zhang28, A. Zhelezov25, A. Zhokin25, Y.C. Zhu10, J. Zimmermann27, T. Zimmermann40, H. Zohrabyan38 and F. Zomer28
1 I. Physikalisches Institut der RWTH, Aachen, Germanya
2 III. Physikalisches Institut der RWTH, Aachen, Germanya
3 School of Physics and Astronomy, University of Birmingham,
Birmingham, UKb
4 Inter-University Institute for High Energies ULB-VUB, Brussels;
Universiteit Antwerpen, Antwerpen; Belgiumc
5 Rutherford Appleton Laboratory, Chilton, Didcot, UKb
6 Institute for Nuclear Physics, Cracow, Polandd
7 Institut für Physik, Universität Dortmund, Dortmund, Germanya
8 Joint Institute for Nuclear Research, Dubna, Russia
9 CEA, DSM/DAPNIA, CE-Saclay, Gif-sur-Yvette, France
10 DESY, Hamburg, Germany
11 Institut für Experimentalphysik, Universität Hamburg,
Hamburg, Germanya
12 Max-Planck-Institut für Kernphysik, Heidelberg, Germany
13 Physikalisches Institut, Universität Heidelberg,
Heidelberg, Germanya
14 Kirchhoff-Institut für Physik, Universität Heidelberg,
Heidelberg, Germanya
15 Institut für Experimentelle und Angewandte Physik, Universität
Kiel, Kiel, Germany
16 Institute of Experimental Physics, Slovak Academy of
Sciences, Košice, Slovak Republicf
17 Department of Physics, University of Lancaster,
Lancaster, UKb
18 Department of Physics, University of Liverpool,
Liverpool, UKb
19 Queen Mary and Westfield College, London, UKb
20 Physics Department, University of Lund,
Lund, Swedeng
21 Physics Department, University of Manchester,
Manchester, UKb
22 CPPM, CNRS/IN2P3 - Univ. Mediterranee,
Marseille - France
23 Departamento de Fisica Aplicada,
CINVESTAV, Mérida, Yucatán, Méxicok
24 Departamento de Fisica, CINVESTAV, Méxicok
25 Institute for Theoretical and Experimental Physics,
Moscow, Russial
26 Lebedev Physical Institute, Moscow, Russiae
27 Max-Planck-Institut für Physik, München, Germany
28 LAL, Université de Paris-Sud, IN2P3-CNRS,
Orsay, France
29 LLR, Ecole Polytechnique, IN2P3-CNRS, Palaiseau, France
30 LPNHE, Universités Paris VI and VII, IN2P3-CNRS,
Paris, France
31 Faculty of Science, University of Montenegro,
Podgorica, Serbia and Montenegroe
32 Institute of Physics, Academy of Sciences of the Czech Republic,
Praha, Czech Republice,i
33 Faculty of Mathematics and Physics, Charles University,
Praha, Czech Republice,i
34 Dipartimento di Fisica Università di Roma Tre
and INFN Roma 3, Roma, Italy
35 Institute for Nuclear Research and Nuclear Energy,
Sofia, Bulgariae
36 Paul Scherrer Institut,
Villigen, Switzerland
37 Fachbereich C, Universität Wuppertal,
Wuppertal, Germany
38 Yerevan Physics Institute, Yerevan, Armenia
39 DESY, Zeuthen, Germany
40 Institut für Teilchenphysik, ETH, Zürich, Switzerlandj
41 Physik-Institut der Universität Zürich, Zürich, Switzerlandj
42 Also at Physics Department, National Technical University,
Zografou Campus, GR-15773 Athens, Greece
43 Also at Rechenzentrum, Universität Wuppertal,
Wuppertal, Germany
44 Also at University of P.J. Šafárik,
Košice, Slovak Republic
45 Also at CERN, Geneva, Switzerland
46 Also at Max-Planck-Institut für Physik, München, Germany
47 Also at Comenius University, Bratislava, Slovak Republic
a Supported by the Bundesministerium für Bildung und Forschung, FRG,
under contract numbers 05 H1 1GUA /1, 05 H1 1PAA /1, 05 H1 1PAB /9,
05 H1 1PEA /6, 05 H1 1VHA /7 and 05 H1 1VHB /5
b Supported by the UK Particle Physics and Astronomy Research
Council, and formerly by the UK Science and Engineering Research
Council
c Supported by FNRS-FWO-Vlaanderen, IISN-IIKW and IWT
and by Interuniversity
Attraction Poles Programme,
Belgian Science Policy
d Partially Supported by the Polish State Committee for Scientific
Research, SPUB/DESY/P003/DZ 118/2003/2005
e Supported by the Deutsche Forschungsgemeinschaft
f Supported by VEGA SR grant no. 2/4067/ 24
g Supported by the Swedish Natural Science Research Council
i Supported by the Ministry of Education of the Czech Republic
under the projects INGO-LA116/2000 and LN00A006, by
GAUK grant no 175/2000
j Supported by the Swiss National Science Foundation
k Supported by CONACYT,
México, grant 400073-F
l Partially Supported by Russian Foundation
for Basic Research, grant no. 00-15-96584
1 Introduction
Measurements of the charm () and beauty () contributions to the inclusive proton structure function have been made recently in Deep Inelastic Scattering (DIS) at HERA, using information from the H1 vertex detector, for values of the negative square of the four momentum of the exchanged boson [1]. In this high region a fraction of () of DIS events contain () quarks. It was found that perturbative QCD (pQCD) calculations at next-to-leading order (NLO) gave a good description of the data. In this paper a similar method is employed, using data from the same running period, to extend the measurements to the range of lower , , and of Bjorken , .
Events containing heavy quarks are distinguished from those containing only light quarks by reconstructing the displacement of tracks from the primary vertex, using precise spatial information from the H1 vertex detector. The long lifetimes of and flavoured hadrons lead to larger displacements than for light quark events. The charm structure function and the beauty structure function are obtained from the measured and cross sections after small corrections for the longitudinal structure functions and . The measurements at low benefit from increased statistics when compared to those at high . However, the low region is experimentally more challenging because the final state does not have as large a transverse boost in the laboratory frame. The separation between and events is also difficult since, although the fraction is expected to be similar as at high , the fraction is expected to be much smaller ( at [2, 3]).
Previous measurements of the open charm cross section in DIS at HERA have mainly been of exclusive or meson production[4, 5, 6]. From the measurements the contribution of charm to the proton structure function has been derived by correcting for the fragmentation fraction and the unmeasured phase space (mainly at low values of transverse momentum of the meson). The results are found to be in good agreement with pQCD predictions. The cross section in DIS, in a similar kinematic region to the present analysis, has been measured for events containing a muon and an associated jet in the Breit frame in the final state [7, 8]. The measured cross sections are found to be somewhat higher than perturbative calculations at NLO.
2 Theoretical Description of Heavy Flavour Production in Deep Inelastic Scattering
2.1 NLO QCD Calculations
In the framework of NLO QCD analyses of global inclusive and jet cross section measurements, the production of heavy flavours is described using the variable flavour number scheme (VFNS) which aims to provide reliable pQCD predictions over the whole kinematic range in . At values of the effects of the quark mass must be taken into account and the heavy flavour partons are treated as massive quarks. The dominant LO process in this region is photon gluon fusion (PGF) and the NLO diagrams are of order [9]. As increases, in the region the heavy quark may be treated as a massless parton in the proton. Several approaches[10, 11, 12] have been developed which deal with the transition from the heavy quark mass effects at low to the asymptotic massless parton behaviour at high . Recently, predictions for inclusive heavy flavour production within a VFNS approach have been calculated at next-to-next-to-leading order (NNLO)[13].
Predictions for the charm and beauty cross sections may also be obtained from fits[14] to the HERA inclusive data based on CCFM evolution[15]. The heavy quarks are produced in the fixed flavour number scheme (FFNS) according to the LO PGF off-shell matrix elements (with and ) convoluted with the CCFM -unintegrated gluon density of the proton (J2003 set 1[14]). The predictions are calculated using the Monte Carlo program CASCADE [16].
2.2 Monte Carlo Simulation
Monte Carlo simulations are used to correct for the effects of the finite detector resolution, acceptance and efficiency. The Monte Carlo program RAPGAP[17] is used to generate low DIS events for the processes and . The Monte Carlo program DJANGO[18] is used to generate light quark () events. Both programs combine () matrix elements with higher order QCD effects modelled by the emission of parton showers. The heavy flavour event samples are generated according to the massive PGF matrix element with the mass of the and quarks set to and , respectively. In the heavy flavour event generation, the DIS cross section is calculated using the parton distribution functions (PDFs) from [19]. The light flavour event samples are generated with the LO PDFs from[20]. The partonic system for all generated events is fragmented according to the LUND string model implemented within the JETSET program[21]. The HERACLES program[22] calculates single photon radiative emissions off the lepton line, virtual and electroweak corrections. The Monte Carlo program PHOJET[23] is used to simulate the background contribution from photoproduction ().
The samples of events generated for the , , and processes are passed through a detailed simulation of the detector response based on the GEANT3 program[24], and through the same reconstruction software as is used for the data. A total of million events, million events and million events were simulated to evaluate the cross sections, corresponding to luminosities of , and , respectively.
3 H1 Detector
The analysis is based on a low sample of neutral current scattering events corresponding to an integrated luminosity of , taken in the years 1999-2000, at an centre of mass energy , with a proton beam energy of .
Only a short description of the H1 detector is given here; a full description may be found in[25]. A right handed coordinate system is employed at H1 that has its -axis pointing in the proton beam, or forward, direction and () pointing in the horizontal (vertical) direction.
Charged particles are measured in the central tracking detector (CTD). This device consists of two cylindrical drift chambers interspersed with -chambers to improve the -coordinate reconstruction and multi–wire proportional chambers mainly used for triggering. The CTD is situated in a uniform magnetic field, enabling momentum measurement of charged particles over the polar angular range111 The angular coverage of each detector component is given for the interaction vertex in its nominal position. .
The CTD tracks are linked to hits in the vertex detector (central silicon tracker CST)[26] to provide precise spatial track reconstruction. The CST consists of two layers of double-sided silicon strip detectors surrounding the beam pipe, covering an angular range of for tracks passing through both layers. The information on the -coordinate of the CST tracks is not used in the analysis presented in this paper. For CTD tracks with CST hits in both layers the transverse distance of closest approach (DCA) to the nominal vertex in – can be measured with a resolution of , where the first term represents the intrinsic resolution (including alignment uncertainty) and the second term is the contribution from multiple scattering in the beam pipe and the CST; is the transverse momentum of the track.
The track detectors are surrounded in the forward and central directions () by a fine grained liquid argon calorimeter (LAr) and in the backward region () by a lead–scintillating fibre calorimeter (SPACAL)[27] with electromagnetic and hadronic sections. These calorimeters provide energy and angular reconstruction for final state particles from the hadronic system. The SPACAL is used in this analysis to measure and identify the scattered positron. A planar drift chamber (BDC [28]), positioned in front of the SPACAL (), measures the angle of the scattered positron and allows suppression of photoproduction background, where particles from the hadronic final state fake a positron signal.
Electromagnetic calorimeters situated downstream in the positron beam direction allow detection of photons and electrons scattered at very low . The luminosity is measured from the rate of photons produced in the Bethe-Heitler process .
4 Experimental Method
4.1 Event and Track Selection
The events are selected by requiring a compact electromagnetic cluster in the SPACAL associated with a track segment in the BDC to define the scattered positron candidate. The position of the interaction vertex, reconstructed by one or more charged tracks in the tracking detectors, must be within of the centre of the detector to match the acceptance of the CST. Photoproduction events are suppressed by requiring . Here, and denote the energy and longitudinal momentum components of a particle and the sum is over all final state particles including the scattered positron and the hadronic final state (HFS). The HFS particles are reconstructed using a combination of tracks and calorimeter deposits in an energy flow algorithm that avoids double counting. The event kinematics, and the inelasticity variable , are reconstructed with the ‘’ method[29], which uses the scattered positron and the HFS. The Bjorken scaling variable is obtained from . In order to have good acceptance in the SPACAL and to ensure that the HFS has a significant transverse momentum, events are selected in the range . The analysis is restricted to to ensure that the direction of the quark which is struck by the photon is mostly in the CST angular range. A further cut of is imposed for events with to reduce photoproduction background.
The triggers used in the analysis require a SPACAL energy deposit in association with a loose track requirement. Although these triggers are almost efficient, not all events could be recorded, due to the large rate for low events. A fraction of events is rejected at the first trigger level (L1) and final trigger level (L4). The Monte Carlo events are assigned weights to account for the events rejected at L1 while the data events are assigned weights to account for the events rejected at L4. The weights are largest for those events with an electron at low radius and low energy. The overall effect of the trigger is a reduction of the effective luminosity by a factor of about for the lowest bin and for the highest. After applying the event weights and the inclusive selection detailed above, the total number of events is about million. The background from photoproduction events is estimated from the PHOJET Monte Carlo simulation. In most of the range this background is negligible and does not exceed in any - bin used in this analysis.
The primary event vertex in – is reconstructed from all tracks (with or without CST hits) and the position and spread of the beam interaction region [1]. The impact parameter of a track, which is the transverse distance of closest approach (DCA) of the track to the primary vertex point, is only determined for those tracks which are measured in the CTD and have at least two CST hits linked (referred to as CST tracks). Only CST tracks with a transverse momentum are included in the DCA and related distributions that are used to separate the different quark flavours. In the kinematic range of this measurement, the fraction of () events that have at least one charged track within the angular range of the CST, with transverse momentum and originating from the decay of a heavy flavoured hadron, is expected to be (), as determined from the Monte Carlo simulation. The efficiency to obtain a CST track from a CTD track is , within the angular range of the CST.
In order to determine a signed impact parameter () for a track, the azimuthal angle of the struck quark must be determined for each event. To do this, jets with a minimum of , in the angular range , are reconstructed using the invariant algorithm[30] in the laboratory frame using all reconstructed HFS particles. The angle is defined as the of the jet with the highest transverse momentum or, if there is no jet reconstructed in the event, as , where is the azimuthal angle of the electron in degrees. The direction defined in the transverse plane by and the primary vertex is called the quark axis. Approximately () of () events have reconstructed from a jet, as determined from the Monte Carlo simulation.
The difference between the reconstructed to the true (defined as the azimuthal angle of the quark with highest transverse momentum) is estimated from the Monte Carlo simulation to have a resolution of about for events with a reconstructed jet and for the rest. The resolution of is checked with events containing a reconstructed meson. Figure 1 shows the difference between the reconstructed azimuthal angle and for events with and without a reconstructed jet. Both distributions are well described by the Monte Carlo simulation.
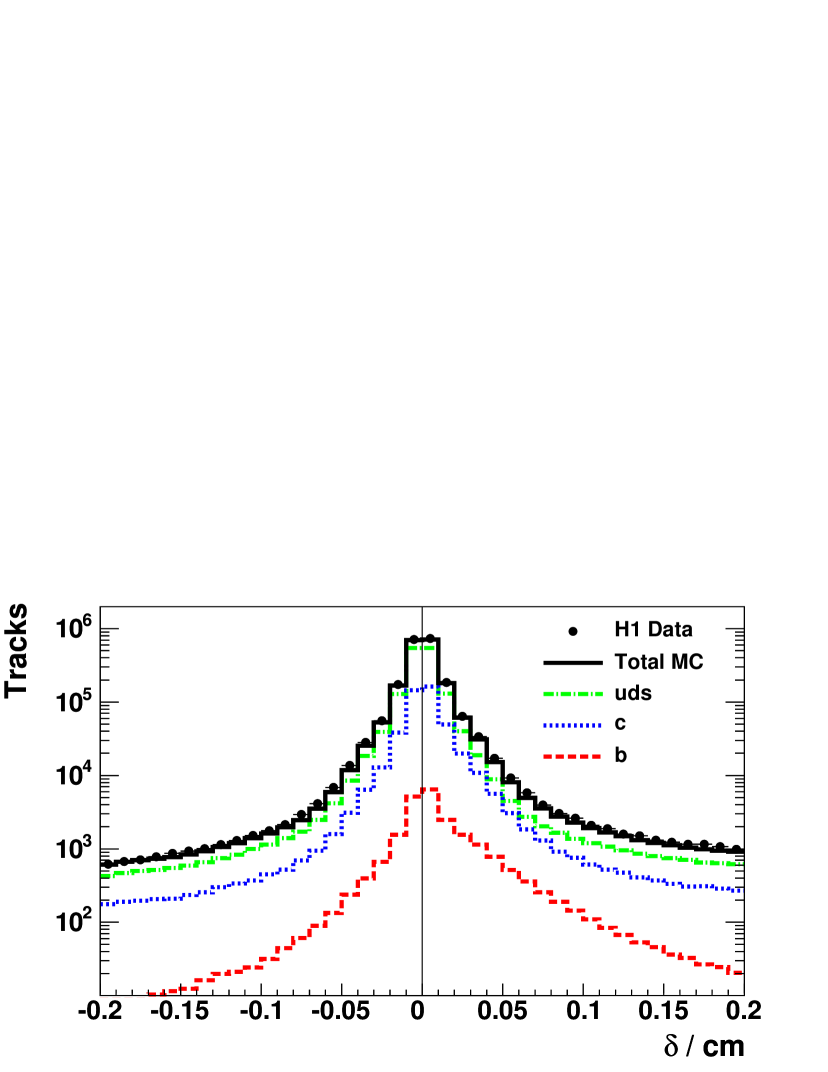
If the angle between the quark axis and the line joining the primary vertex to the point of DCA is less than , is defined as positive, and is defined as negative otherwise. Tracks with azimuthal angle outside of are rejected. The distribution, shown in figure 2, is seen to be asymmetric with positive values in excess of negative values indicating the presence of long lived particles. It is found to be well described by the Monte Carlo simulation. Tracks with are rejected from the analysis to suppress light quark events containing long lived strange particles.
4.2 Quark Flavour Separation
The method used in [1] to distinguish between the , and light quark flavours has been modified in the present analysis because here the fraction of quarks is smaller. The quantities , and are defined as the significance () of the track with the highest, second highest and third highest absolute significance, respectively, where is the error on . Distributions of each of these quantities are made. The events contributing to the distribution also contribute to the distribution. Similarly, those contributing to the distribution also contribute to the and distributions. Events in which and have opposite signs are excluded from the distribution. Events in which , and do not all have the same sign are excluded from the distribution.
Figure 3 shows the three significance distributions. The simulation gives a reasonable description of the data. In order to substantially reduce the uncertainty due to the resolution of and the light quark normalisation, the contents of the negative bins in the significance distributions are subtracted from the contents of the corresponding positive bins. The subtracted distributions are shown in figure 4. It can be seen that the resulting distributions are dominated by quark events, with a fraction increasing with significance. The light quarks contribute a small fraction for all values of significance.
The fractions of , and light quarks of the data are extracted in each – interval using a least squares simultaneous fit to the subtracted , and distributions (as in figure 4) and the total number of inclusive events before any CST track selection. The , and Monte Carlo simulation samples are used as templates. The Monte Carlo , and contributions in each – interval are scaled by factors , and , respectively, to give the best fit to the observed subtracted , , and total distributions. Only the statistical errors of the data and Monte Carlo simulation are considered in the fit. The fit to the subtracted significance distributions mainly constrains and , whereas the overall normalisation constrains .
The results of the fit to the complete data sample are shown in figure 4. The fit gives a good description of all the significance distributions, with a of . Values of , and are obtained. The and scale factors are found to be anti-correlated with an overall correlation coefficient of -0.70. Acceptable values are also found for the fits to the samples in the separate – intervals. Since the same event may enter the , and distributions, it was checked using a high statistics Monte Carlo simulation that this has negligible effect on the results of the fits with the present data statistics.
The results of the fit in each – interval are converted to a measurement of the ‘reduced cross section’ defined from the differential cross section as
| (1) |
using:
| (2) |
where is the measured inclusive reduced cross section from H1[28] and , and are the number of , and light quark events generated from the Monte Carlo in each bin. A bin centre correction is applied using a NLO QCD expectation for to convert the bin averaged measurement into a measurement at a given – point. The NLO QCD expectation is calculated from the results of a fit similar to that performed in [31] but using the FFNS scheme to generate heavy flavours. A small correction () for the beam energy difference is applied, using the NLO QCD expectation, to the measurement of which was performed at a lower centre of mass energy of than the data presented here. The cross section is defined so as to include a correction for pure QED radiative effects. Events that contain hadrons via the decay of hadrons are not included in the definition of the cross section. The differential cross section is evaluated in the same manner.
4.3 Systematic Errors
The systematic uncertainties on the measured cross sections are estimated by applying the following variations to the Monte Carlo simulation:
-
•
An uncertainty in the resolution of the tracks is estimated by varying the resolution by an amount that encompasses the differences between the data and simulation (figures 2, 3). This was achieved by applying an additional Gaussian smearing in the Monte Carlo of to of randomly selected tracks and to the rest.
-
•
A track efficiency uncertainty of due to the CTD and of due to the CST.
-
•
The uncertainties on the various and meson lifetimes, decay branching fractions and mean charge multiplicities are estimated by varying the input values of the Monte Carlo simulation by the errors on the world average measurements. For the branching fractions of quarks to hadrons and the lifetimes of the and mesons the central values and errors on the world averages are taken from[32]. For the branching fractions of quarks to hadrons the values and uncertainties are taken from[33], which are consistent with measurements made in DIS at HERA[34]. For the mean charged track multiplicities the values and uncertainties for and quarks are taken from MarkIII[35] and LEP/SLD[36] measurements, respectively.
-
•
An uncertainty on the fragmentation function of the heavy quarks is estimated using the Peterson fragmentation function[37] with parameters and , instead of the LUND fragmentation model.
-
•
An uncertainty on the QCD model of heavy quark production is estimated by using the CASCADE Monte Carlo instead of the RAPGAP Monte Carlo.
-
•
The uncertainty on the asymmetry of the light quark distribution is estimated by repeating the fits with the subtracted light quark significance distributions (figure 4) changed by . The light quark asymmetry was checked to be within this uncertainty by comparing the asymmetry of Monte Carlo events to that of the data, in the region , where the light quark asymmetry is enhanced.
-
•
An error on the quark axis is estimated by shifting the quark axis by () for events with (without) a reconstructed jet. These shifts were estimated by comparing the difference between and the track azimuthal angle in data and Monte Carlo.
-
•
A uncertainty on the hadronic energy scale.
-
•
Uncertainties on the acceptance and bin centre correction due to the input structure functions used are estimated by reweighting the input distribution by and and by and . The range of variation of the input structure functions was estimated by comparing to the measured values obtained in this analysis.
-
•
An uncertainty on the photoproduction background is estimated by assigning of the expected number of events from the PHOJET simulation that enter the significance distributions.
Other sources of systematic error pertaining to the NC selection were also considered[28]: a uncertainty on the luminosity measurement; an uncertainty on the scattered positron polar angle of and energy of – depending on the energy; a uncertainty on the scattered positron identification efficiency; a – uncertainty on the positron track-cluster link efficiency; a uncertainty on the trigger efficiency and a uncertainty on the cross section evaluation due to QED radiative corrections.
A detailed list of the systematic effect on each cross section measurement is given in table 1. The systematic error is larger for the measurement than it is for the because the fraction is much smaller than the fraction. The errors which contribute most to the uncorrelated systematic error in table 1 are, at low and high , the uncertainty on the photoproduction background and, elsewhere, the uncertainty on the acceptance and bin centre correction due to the input structure function.
5 Results
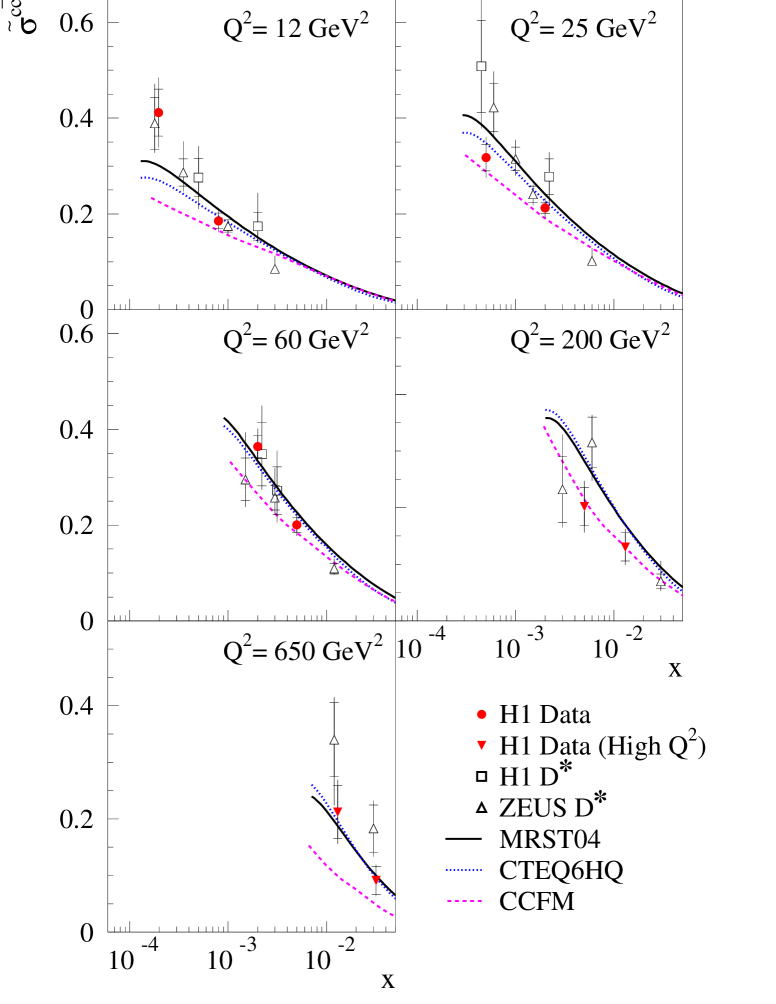
The measurements of are listed in table 1 and shown in figure 5 as a function of for fixed values of . The H1 data for are compared with the results extracted from meson measurements by H1 [5] and ZEUS [6] obtained using a NLO program [38] based on DGLAP evolution to extrapolate the measurements outside the visible range. The measurements for from the present analysis and the extraction methods are in good agreement.
The data are compared with two VFNS predictions from NLO QCD (see section 2.1) from MRST[2] and CTEQ[3], and with predictions based on CCFM[15] parton evolution. The predictions provide a reasonable description of the present data.
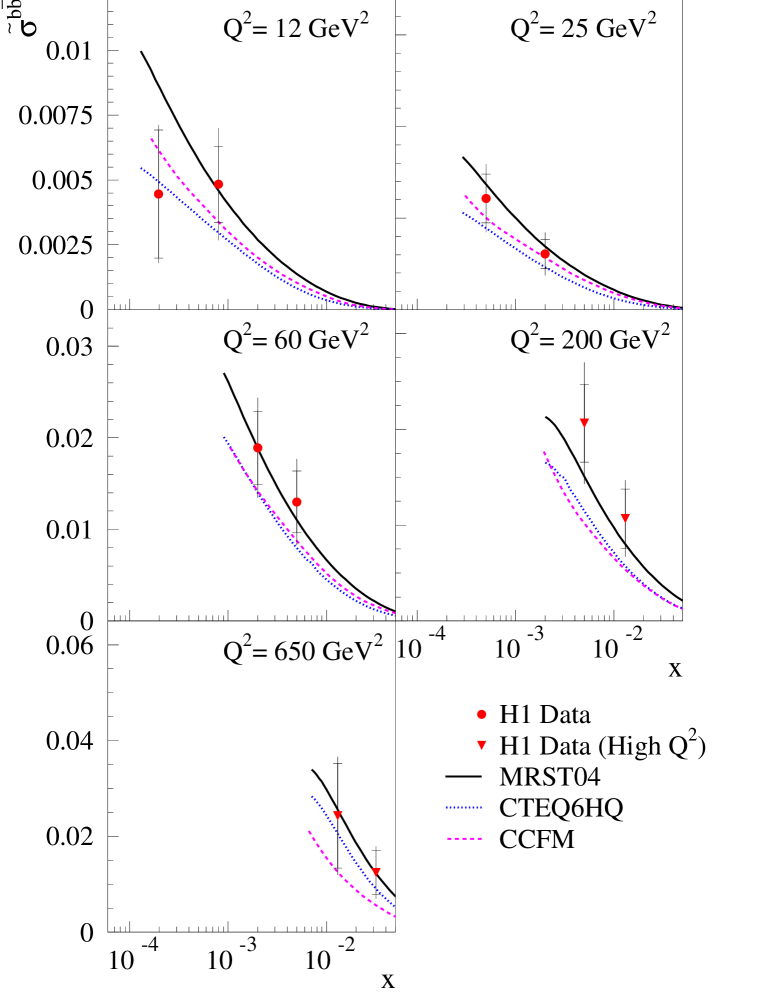
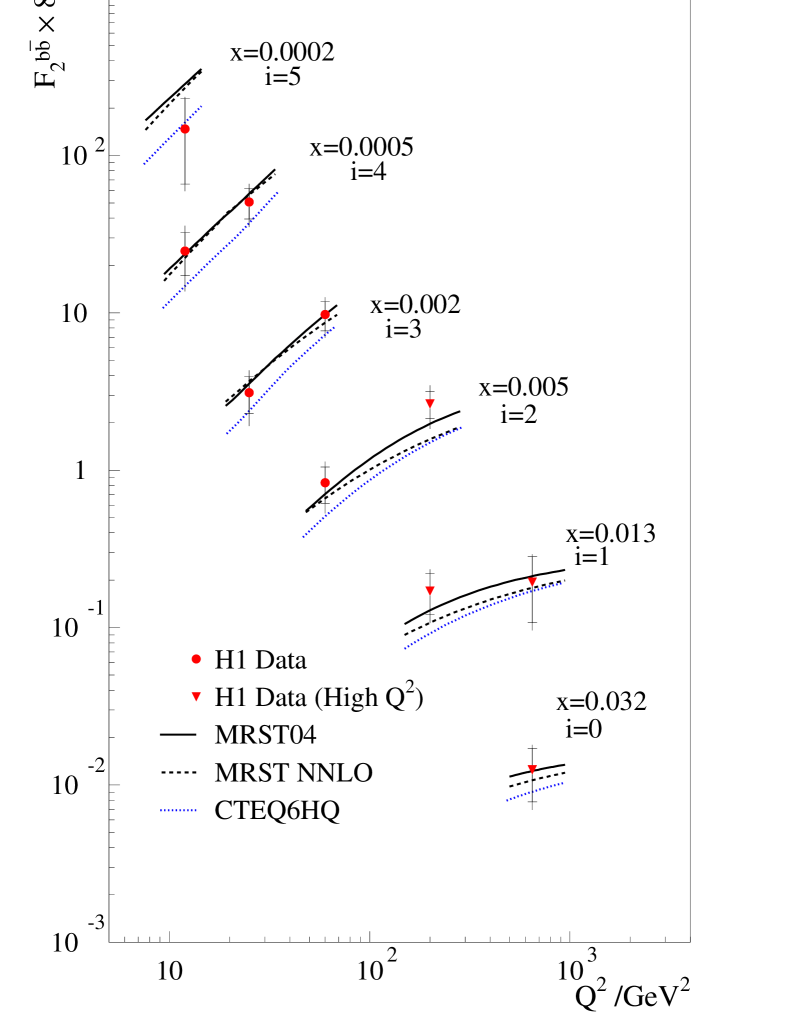
The measurements of are also listed in table 1 and are shown in figure 6 as a function of for fixed values of . This is the first measurement of in this kinematic range. The data are also compared with the two VFNS NLO QCD predictions and the CCFM prediction. The difference between the two VFNS NLO QCD calculations, which reaches a factor at the lowest and , arises from the different treatments of threshold effects by MRST and CTEQ. Within the current experimental errors these differences cannot be resolved.
The structure function is evaluated from the reduced cross section
| (3) |
where the longitudinal structure function is estimated from the same NLO QCD expectation as used for the bin centre correction. The structure function is evaluated in the same manner.
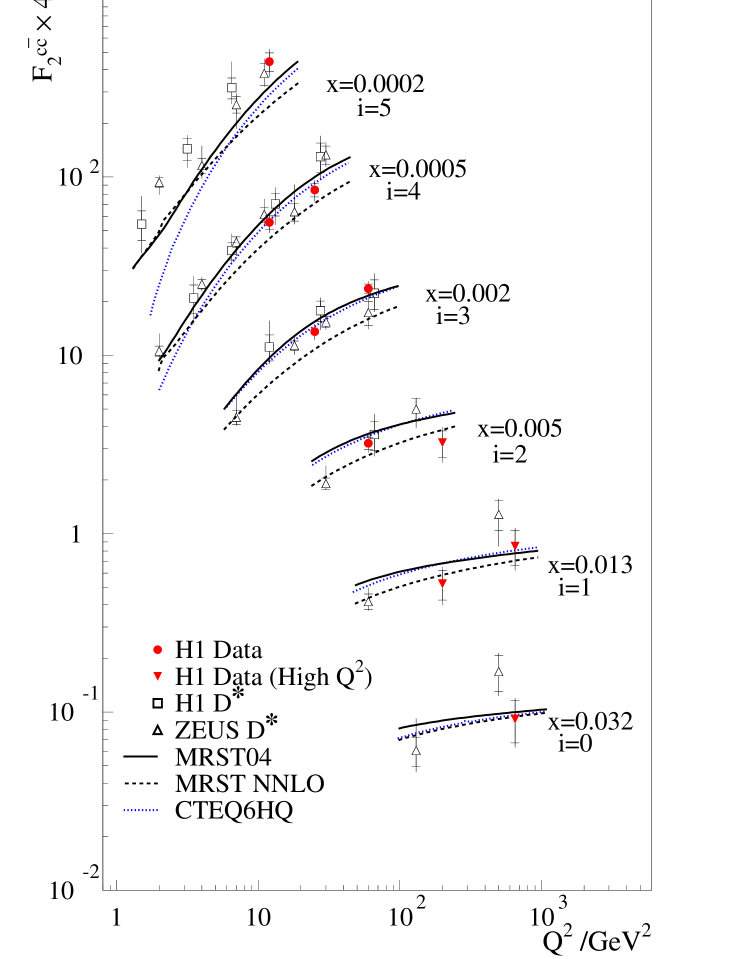
The measurements and are shown as a function of in figure 7 and figure 8. The measurements of and show positive scaling violations which increase with decreasing . The data are compared with the VFNS QCD predictions from MRST and CTEQ at NLO and a recent calculation at NNLO[13]. The charm data are more precise than the spread in predictions of the QCD calculations.
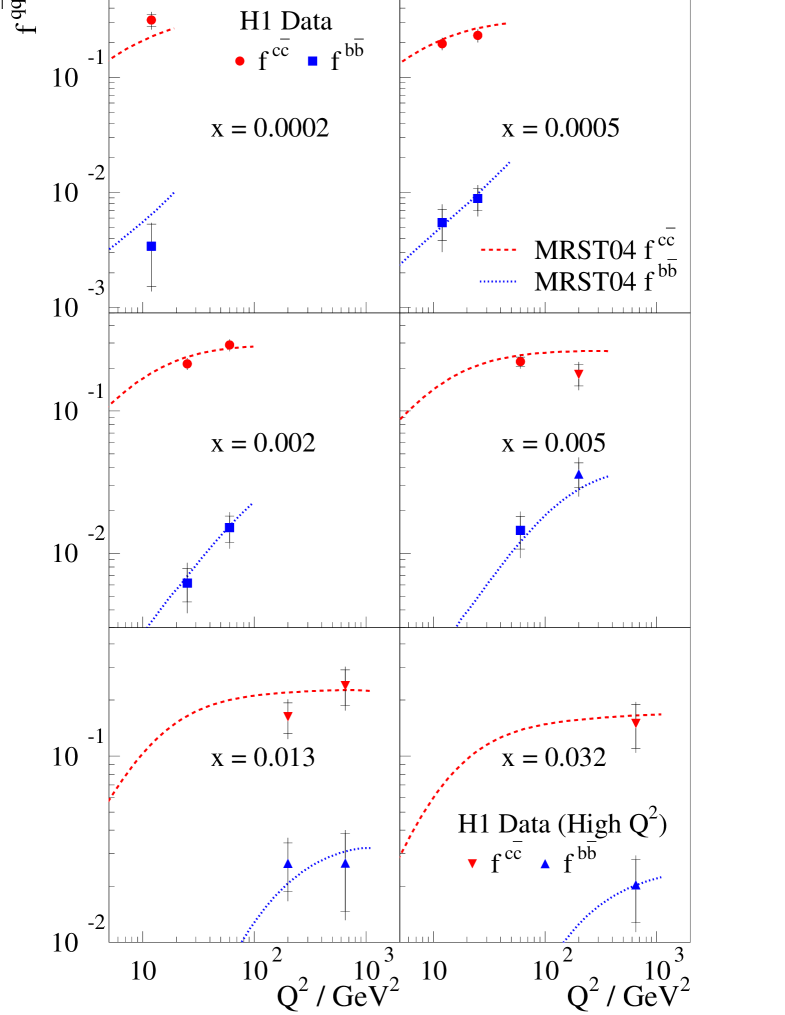
The measurements are also presented in table 2 and figure 9 in the form of the fractional contribution to the total cross section
| (4) |
The fraction is defined in the same manner. In the present kinematic range the value of is around on average and increases slightly with increasing and decreasing . The value of increases rapidly with from at to at . The NLO QCD predictions of MRST shown in figure 9 are found to describe the data reasonably well.
6 Conclusion
The differential charm and beauty cross sections in Deep Inelastic Scattering are measured at low and Bjorken using the impact parameters of tracks from decays of long lived and hadrons as reconstructed from the vertex detector. This is the first measurement of in the low kinematic region. In this kinematic range the charm cross section contributes on average of the inclusive cross section, and the beauty fraction increases from at to at . The cross sections and derived structure functions and are found to be well described by predictions of perturbative QCD.
Acknowledgements
We are grateful to the HERA machine group whose outstanding efforts have made this experiment possible. We thank the engineers and technicians for their work in constructing and maintaining the H1 detector, our funding agencies for financial support, the DESY technical staff for continual assistance and the DESY directorate for support and for the hospitality which they extend to the non-DESY members of the collaboration. We are grateful to S. Kretzer, R. S. Thorne and W. K. Tung for providing us with their calculations and for productive discussions.
References
- [1] A. Aktas et al. [H1 Collaboration], Eur. Phys. J. C 40 (2005) 349 [hep-ex/0411046].
- [2] A. D. Martin, R. G. Roberts, W. J. Stirling and R. S. Thorne, Eur. Phys. J. C 39 (2005) 155 [hep-ph/0411040].
- [3] S. Kretzer, H. L. Lai, F. I. Olness and W. K. Tung, Phys. Rev. D 69 (2004) 114005 [hep-ph/0307022].
- [4] C. Adloff et al. [H1 Collaboration], Z. Phys. C 72 (1996) 593 [hep-ex/9607012]; J. Breitweg et al. [ZEUS Collaboration], Phys. Lett. B 407 (1997) 402 [hep-ex/9706009]; C. Adloff et al. [H1 Collaboration], Nucl. Phys. B 545 (1999) 21 [hep-ex/9812023]; J. Breitweg et al. [ZEUS Collaboration], Eur. Phys. J. C 12 (2000) 35 [hep-ex/9908012].
- [5] C. Adloff et al. [H1 Collaboration], Phys. Lett. B 528 (2002) 199 [hep-ex/0108039].
- [6] S. Chekanov et al. [ZEUS Collaboration], Phys. Rev. D 69 (2004) 012004 [hep-ex/0308068].
- [7] S. Chekanov et al. [ZEUS Collaboration], Phys. Lett. B 599 (2004) 173 [hep-ex/0405069].
- [8] A. Aktas et al. [H1 Collaboration], Eur. Phys. J. C 41 (2005) 453 [hep-ex/0502010].
- [9] E. Laenen, S. Riemersma, J. Smith and W. L. van Neerven, Nucl. Phys. B 392 (1993) 162; E. Laenen, S. Riemersma, J. Smith and W. L. van Neerven, Nucl. Phys. B 392 (1993) 229.
- [10] F. I. Olness and W. K. Tung, Nucl. Phys. B 308 (1988) 813; M. A. G. Aivazis, F. I. Olness and W. K. Tung, Phys. Rev. D 50 (1994) 3085 [hep-ph/9312318]; M. A. G. Aivazis, J. C. Collins, F. I. Olness and W. K. Tung, Phys. Rev. D 50 (1994) 3102 [hep-ph/9312319]; M. Krämer, F. I. Olness and D. E. Soper, Phys. Rev. D 62 (2000) 096007 [hep-ph/0003035].
- [11] R. S. Thorne and R. G. Roberts, Phys. Rev. D 57 (1998) 6871 [hep-ph/9709442]; R. S. Thorne and R. G. Roberts, Phys. Lett. B 421 (1998) 303 [hep-ph/9711223]; R. S. Thorne and R. G. Roberts, Eur. Phys. J. C 19 (2001) 339 [hep-ph/0010344];
- [12] M. Buza, Y. Matiounine, J. Smith and W. L. van Neerven, Phys. Lett. B 411 (1997) 211 [hep-ph/9707263]; A. Chuvakin, J. Smith and W. L. van Neerven, Phys. Rev. D 61 (2000) 096004 [hep-ph/9910250]; A. Chuvakin, J. Smith and W. L. van Neerven, Phys. Rev. D 62 (2000) 036004 [hep-ph/0002011].
- [13] R. Thorne, “A Variable Flavour Number Scheme at NNLO,” To appear in the proceedings of 13th International Workshop on Deep Inelastic Scattering (DIS 2005), Madison, Wisconsin, USA, April 2005. [hep-ph/0506251].
- [14] M. Hansson and H. Jung, “Status of CCFM: Un-integrated gluon densities,” Proceedings of 11th International Workshop on Deep Inelastic Scattering (DIS 2003), St. Petersburg, Russia, April 2003, p 488. Edited by V.T. Kim and L.N. Lipatov. [hep-ph/0309009].
- [15] M. Ciafaloni, Nucl. Phys. B 296 (1988) 49; S. Catani, F. Fiorani and G. Marchesini, Phys. Lett. B 234 (1990) 339; S. Catani, F. Fiorani and G. Marchesini, Nucl. Phys. B 336 (1990) 18; G. Marchesini, Nucl. Phys. B 445 (1995) 49 [hep-ph/9412327].
-
[16]
H. Jung and G. P. Salam,
Eur. Phys. J. C 19 (2001) 351
[hep-ph/0012143];
H. Jung,
Comput. Phys. Commun. 143 (2002) 100
[hep-ph/0109102];
(see also http://www.desy.de/jung/cascade/). -
[17]
H. Jung,
Comput. Phys. Commun. 86 (1995) 147;
(see also http://www.desy.de/jung/rapgap/). - [18] K. Charchula, G. A. Schuler and H. Spiesberger, Comput. Phys. Commun. 81 (1994) 381; (see also http://www.desy.de/hspiesb/django6.html).
- [19] A. D. Martin, W. J. Stirling and R. G. Roberts, Phys. Rev. D 50 (1994) 6734 [hep-ph/9406315].
- [20] M. Glück, E. Reya and A. Vogt, Z. Phys. C 67 (1995) 433.
- [21] T. Sjöstrand et al., Comput. Phys. Commun. 135 (2001) 238 [hep-ph/0010017].
- [22] A. Kwiatkowski, H. Spiesberger and H. J. Möhring, Comput. Phys. Commun. 69 (1992) 155.
- [23] R. Engel and J. Ranft, Phys. Rev. D 54 (1996) 4244 [hep-ph/9509373].
- [24] R. Brun, R. Hagelberg, M. Hansroul and J. C. Lassalle, CERN-DD-78-2-REV.
- [25] I. Abt et al. [H1 Collaboration], Nucl. Instrum. Meth. A 386 (1997) 310 and 348.
- [26] D. Pitzl et al., Nucl. Instrum. Meth. A 454 (2000) 334 [hep-ex/0002044].
- [27] T. Nicholls et al. [H1 SPACAL Group], Nucl. Instrum. Meth. A 374 (1996) 149.
- [28] C. Adloff et al. [H1 Collaboration], Eur. Phys. J. C 21 (2001) 33 [hep-ex/0012053].
- [29] U. Bassler and G. Bernardi, Nucl. Instrum. Meth. A 361 (1995) 197 [hep-ex/9412004]; U. Bassler and G. Bernardi, Nucl. Instrum. Meth. A 426 (1999) 583 [hep-ex/9801017].
- [30] S. D. Ellis and D. E. Soper, Phys. Rev. D 48 (1993) 3160 [hep-ph/9305266]; S. Catani, Y. L. Dokshitzer, M. H. Seymour and B. R. Webber, Nucl. Phys. B 406 (1993) 187.
- [31] C. Adloff et al. [H1 Collaboration], Eur. Phys. J. C 13 (2000) 609 [hep-ex/9908059].
- [32] K. Hagiwara et al. [Particle Data Group], Phys. Rev. D 66 (2002) 010001.
- [33] L. Gladilin, “Charm hadron production fractions”, [hep-ex/9912064].
- [34] A. Aktas et al. [H1 Collaboration], Eur. Phys. J. C 38 (2005) 447 [hep-ex/0408149].
- [35] D. Coffman et al. [MARK-III Collaboration], Phys. Lett. B 263 (1991) 135.
-
[36]
D. Abbaneo et al. [LEP/SLD Heavy Flavour Working Group],
LEPHF 2001-01;
(available from http://lepewwg.web.cern.ch/LEPEWWG/heavy/). - [37] C. Peterson, D. Schlatter, I. Schmitt and P.M. Zerwas, Phys. Rev. D 27 (1983) 105.
- [38] B. W. Harris and J. Smith, Phys. Rev. D 57 (1998) 2806 [hep-ph/9706334].
| \bigstrut[t] | ||||||||||||||||||
| (GeV2) | () | (%) | (%) | (%) | (%) | (%) | (%) | (%) | (%) | (%) | (%) | (%) | (%) | |||||
| 12 | 0.197 | 0.600 | 0.412 | -0.62 | 12 | 13 | 18 | 11 | +3.2 | -1.4 | -3.1 | -0.3 | -0.7 | -1.9 | -5.0 | +2.0 | 0.435 | |
| 12 | 0.800 | 0.148 | 0.185 | -0.68 | 8.8 | 9.4 | 13 | 5.6 | +2.5 | -1.7 | -3.2 | -0.2 | -0.4 | -2.2 | -5.2 | +2.0 | 0.186 | |
| 25 | 0.500 | 0.492 | 0.318 | -0.66 | 8.7 | 10 | 13 | 6.8 | +3.1 | -1.4 | -3.1 | -0.3 | -0.7 | -1.9 | -5.0 | +2.0 | 0.331 | |
| 25 | 2.000 | 0.123 | 0.212 | -0.72 | 5.2 | 8.6 | 10 | 4.1 | +2.6 | -1.6 | -3.1 | -0.2 | -0.5 | -2.1 | -5.2 | +2.0 | 0.212 | |
| 60 | 2.000 | 0.295 | 0.364 | -0.74 | 6.2 | 8.3 | 10 | 3.5 | +3.2 | -1.4 | -3.1 | -0.3 | -0.7 | -1.9 | -5.0 | +2.0 | 0.369 | |
| 60 | 5.000 | 0.118 | 0.200 | -0.76 | 7.8 | 8.5 | 12 | 3.8 | +2.7 | -1.6 | -3.1 | -0.2 | -0.5 | -2.1 | -5.1 | +2.0 | 0.201 | |
| 12 | 0.197 | 0.600 | 0.0045 | -0.62 | 55 | 22 | 60 | 12 | -13 | -7.5 | -2.9 | +3.0 | +4.6 | +8.9 | -4.8 | +1.3 | 0.0045 | |
| 12 | 0.800 | 0.148 | 0.0048 | -0.68 | 30 | 33 | 45 | 13 | -21 | -10 | -5.4 | +3.1 | +6.9 | +15 | -7.7 | +1.7 | 0.0048 | |
| 25 | 0.500 | 0.492 | 0.0122 | -0.66 | 22 | 21 | 31 | 9.1 | -13 | -7.6 | -3.0 | +3.0 | +4.7 | +9.1 | -4.8 | +1.3 | 0.0123 | |
| 25 | 2.000 | 0.123 | 0.0061 | -0.72 | 26 | 28 | 39 | 9.8 | -18 | -9.4 | -4.7 | +3.1 | +6.3 | +13 | -6.8 | +1.6 | 0.0061 | |
| 60 | 2.000 | 0.295 | 0.0189 | -0.74 | 21 | 20 | 29 | 6.2 | -13 | -7.5 | -2.9 | +3.0 | +4.6 | +8.8 | -4.7 | +1.3 | 0.0190 | |
| 60 | 5.000 | 0.118 | 0.0130 | -0.76 | 26 | 25 | 36 | 7.4 | -16 | -8.8 | -4.1 | +3.0 | +5.8 | +12 | -6.1 | +1.5 | 0.0130 |
| \bigstrut[t] | ||||||||||
|---|---|---|---|---|---|---|---|---|---|---|
| (GeV2) | (%) | (%) | (%) | (%) | (%) | (%) | ||||
| 0.000197 | 0.600 | 12 | 0.316 | 12 | 12 | 17 | 0.0034 | 55 | 22 | 60 |
| 0.000800 | 0.148 | 12 | 0.188 | 8.6 | 9.1 | 12 | 0.0049 | 30 | 33 | 45 |
| 0.000500 | 0.492 | 25 | 0.232 | 8.7 | 9.8 | 13 | 0.0089 | 22 | 21 | 30 |
| 0.002000 | 0.123 | 25 | 0.215 | 5.1 | 8.0 | 10 | 0.0062 | 26 | 28 | 38 |
| 0.002000 | 0.295 | 60 | 0.291 | 6.1 | 8.0 | 10 | 0.0151 | 21 | 20 | 29 |
| 0.005000 | 0.118 | 60 | 0.223 | 7.7 | 7.8 | 11 | 0.0144 | 26 | 25 | 36 |