Presenter: A. Habig (ahabig@umn.edu), usa-habig-A-abs2-he22-oral
Neutrino-induced muons observed with MINOS
Abstract
The Main Injector Neutrino Oscillation Search (MINOS) experiment’s Far Detector has been operational since July 2003, taking cosmic ray and atmospheric neutrino data from its location in the Soudan Mine Underground Lab. Numerous neutrino-induced muons have been observed. The detector’s magnetic field allows the first determination by a large underground detector of muon charge and thus neutrino versus anti-neutrino on an event by event basis.
1 Introduction
The MINOS experiment uses two similar iron/scintillator calorimeters to measure the properties of the NuMI neutrino beam over a long baseline, with a goal of precisely measuring the neutrino flavor oscillations seen in atmospheric neutrinos [1]. The 5400 ton Far Detector is located 700 m (2070 mwe) deep in the Soudan Mine Underground Lab in northern Minnesota [2]. The rock overburden reduces the rate of cosmic ray muons reaching the Lab by a factor of , allowing the detection of atmospheric via their charged-current production of muons tracked in the detector. These interactions can occur in the detector itself [3] or in the rock surrounding it. While such muons entering the detector from above cannot be distinguished from the Hz of cosmic ray muons penetrating the overburden, cosmic rays cannot penetrate large depths of rock so selecting horizontal and upward-going muons ensures that they are neutrino-induced. While other experiments have made such a measurement in the past [4], the MINOS detector is magnetized with a toroidal field of T, allowing the determination of momentum and charge on an event-by-event basis via the curvature of the muon track. Muon momentum provides information on the energy of the parent neutrino, and muon charge tags the parent neutrino as a neutrino or anti-neutrino, something which has only been previously measured in bulk [5].
2 The Data
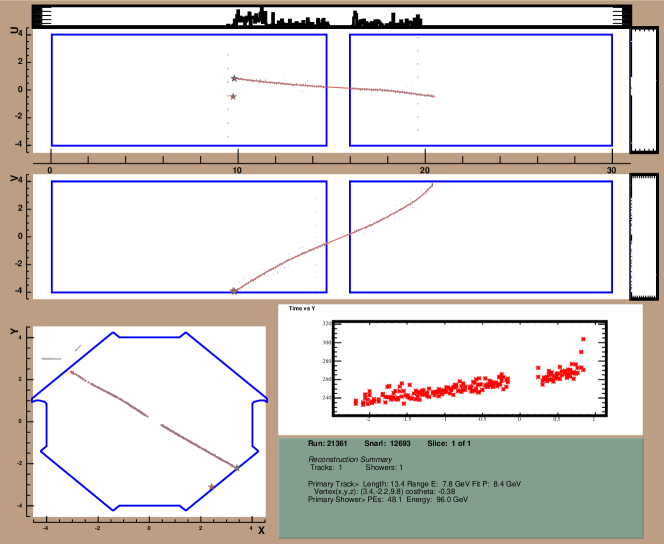
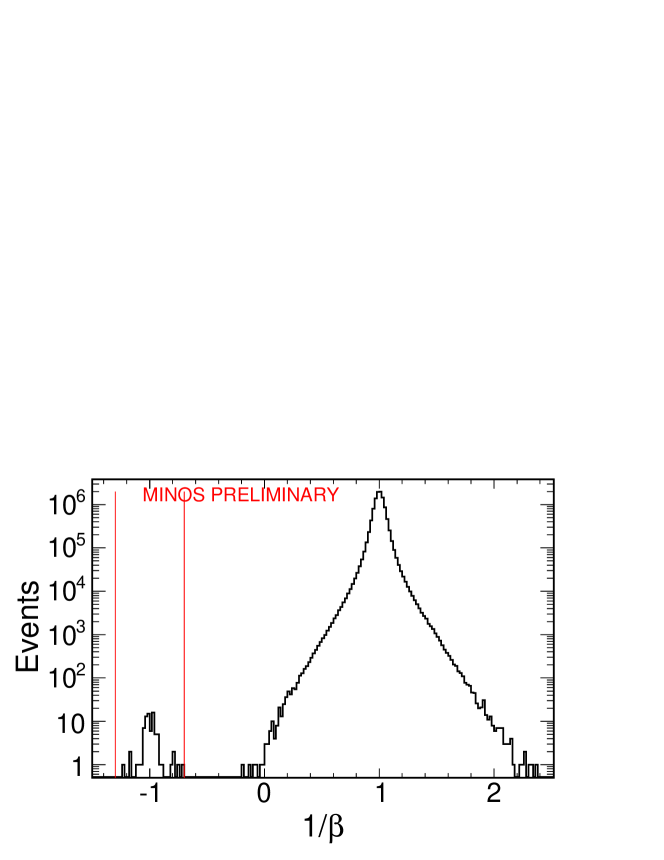
To separate those neutrino-induced muons coming from below (at a rate of a bit more than one per week) from those cosmic ray muons coming from above (at a rate of one every couple seconds), timing information along the track is used. Topologically, the two classes of events look identical - a series of flashes of light (localized to several cm in space by the granularity of the scintillator strips) creating a track which crosses the detector. The only difference between upward- and downward-going events is the times the light was deposited in the scintillator, giving the direction the particle was headed along the track. This is expressed in terms of a measurement of the muon’s velocity . For highly relativistic down-going muons . Upward-going muons have a negative velocity in this convention, .
The ability to tag each flash of scintillation light precisely in time is crucial to this analysis. The electronics used in MINOS have a granularity of 1.56 ns and the rise time of a phototube signal is ns. Signal propagation delays between different sections of electronics can be tens of ns, but these timing offsets are easily calculated using a clean sample of single cosmic ray muons, the geometry of the detector, and the knowledge that these muons move close to the speed of light. The quality of the timing calibration is checked by comparing the light arrival times at both ends of the same scintillator strip with the true location of the hit obtained via tracking. The total uncertainty in the time for each hit or “digit” is ns. An example of this direction determination can be seen in the graph in the lower right of Fig. 1. This time vs. height graph is clearly upward going. The scatter of the points about the trend is indicative of the timing uncertainty.
To ensure a well-determined data sample, the following cuts were applied to the collection of muon tracks (for details see [6]). A single muon which crossed 20 planes over a length of at least 2.0 m must have a well-determined spatial track fit, enter the detector, have a well-determined time fit, and fall within the range shown in Fig. 2. Data were collected from the completion of the MINOS Far Detector in July 2003 through April 2005, spanning 464 live-days (160 of those days had a reversed magnetic field for systematic checks). 91 upward-going muons were observed, a rate of 1 per 5.1 days.
The arrival direction of the muons is closely correlated with the baseline of the parent neutrino, so data were plotted with respect to the cosine of the zenith angle. The momentum of the muon is correlated to the energy of the parent neutrino, so the data were broken into three samples, low ( GeV/c), high ( GeV/c), and indeterminate momenta. The last category tends to hold the highest momenta muons as their tracks are too straight to clearly identify any curvature. All the data are in the upper right of Fig. 3, the other plots separated by momenta. Of the muons for which a momenta was able to be determined, 25 were and 16 were .
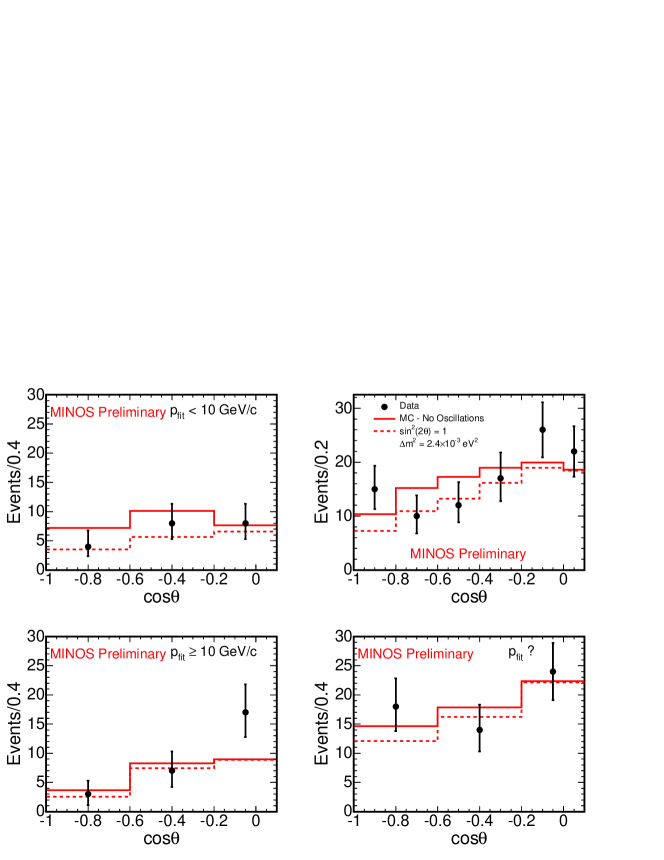
Monte Carlo (“MC”) data were created for comparison to the real data. A 2500 year equivalent neutrino exposure was generated using the NUANCE generator [7] with the Bartol96 [8] input flux. The detector response has been carefully modeled with a GEANT 3 based simulation, and the resulting MC data analyzed using the same reconstruction tools and cuts as the real data. Both the no-oscillation hypothesis and the current Super-K best fit oscillation parameters are also shown in Fig. 3.
3 Conclusions
A sample of neutrino-induced upward going muons has been collected by the MINOS Far Detector. 91 events were observed over 464 live-days. The detector’s magnetic field allows the separation of these muons by charge and by momentum. The distribution of the muon arrival directions in was compared to Monte Carlo expectations. The data and expectations are consistent within the current statistical errors.
4 Acknowledgments
This work was supported by the U.S. Department of Energy, the U.K. Particle Physics and Astronomy Research Council, and the State and University of Minnesota. We gratefully acknowledge the Minnesota Department of Natural Resources for allowing us to use the facilities of the Soudan Underground Mine State Park. This presentation was directly supported by NSF RUI grant #0354848.
References
- [1] Y. Ashie et al., Phys. Rev. D 71, 112005 (2005).
- [2] A. Habig, E.W. Grashorn et al., these proceedings (2005).
- [3] K. Ruddick et al., these proceedings (2005).
- [4] Y. Fukuda et al., Phys. Rev. Lett. 82, 2644 (1999); M. Ambrosio et al., Phys. Lett. B434, 451 (1998).
- [5] A. Habig et al., Proceedings of the 28th ICRC, Tsukuba, Japan, p.1255 (2003).
- [6] B. Rebel, Indiana University PhD thesis (2004).
- [7] D. Casper, Nucl. Phys. Proc. Suppl. 112, 161 (2002).
- [8] V. Agrawal et al., Phys. Rev. D53, 1314 (1996).