BABAR-PUB-05/032
SLAC-PUB-11331
The BABAR Collaboration
A Precision Measurement of the Baryon Mass
Abstract
The baryon mass is measured using and decays reconstructed in 232 of data collected with the BABAR detector at the PEP-II asymmetric-energy storage ring. The mass is measured to be . The dominant systematic uncertainties arise from the amount of material in the tracking volume and from the magnetic field strength.
pacs:
14.20.LqI Introduction
The invariant masses of the stable charmed hadrons are currently reported by the Particle Data Group (PDG) with a precision of about 0.5–0.6 PDG . The best individual measurements have a statistical and systematic precision of about and use data samples of a few hundred events. The BABAR data contains large samples of many charmed-hadron decays and, due to the excellent momentum and vertex resolution in BABAR, many of the decay modes can be reconstructed with an event-by-event mass uncertainty of a few . We can therefore significantly improve the precision on the charm-hadron mass measurements.
In this analysis we present a precision measurement of the mass. The measurement is based on the reconstruction of the decay modes and conjugates . Because almost all of the invariant mass in these decays results from the well-known rest-mass values of the decay products, the systematic uncertainty in the reconstructed mass is significantly reduced compared to the precision obtained in other decay modes. Large samples of and decays are used for cross-checks and studies of systematic uncertainties.
II Analysis Method
The measurement of invariant mass relies on precise and unbiased measurements of particle three-momenta. If the chosen decay mode contains any photons, unbiased energy and position measurements in the electromagnetic calorimeter (EMC) are also necessary. The momentum measurement depends on a well-aligned detector, precise knowledge of the magnetic field and material distribution in the tracking volume, and mass-dependent corrections for the energy loss of charged particles passing through the detector material. All three requirements are met to a large degree by the BABAR detector and its event reconstruction algorithms. We quantify residual systematic effects in studies of various control samples. To minimize such contributions to the systematic uncertainty, we choose to measure the mass by using decay modes with a low -value, where the -value for a decay is defined as
Uncertainties related to track reconstruction, such as those involving energy-loss correction or magnetic field strength, tend to scale with the -value.
The main signal mode used in this analysis is , which has a -value of 177.9 calculated using the PDG mass. The branching ratio was measured by CLEO to be Ammar:1995je . BELLE observed that about of these decays proceed through Abe:2001mb . Since the baryon has a width of several and its mass is not well-known, it does not help in constraining the mass. We reconstruct the and only in their charged decay modes, and , which account for about 44% of decays. To obtain the most precise mass value, the long-lived particles are reconstructed with their mass values constrained to their respective PDG values.
A second low -value decay mode, , has also been studied. With the -value of 100.9 it has the potential for an even lower systematic uncertainty. The results of this study indicates that the branching fraction for this decay mode is significantly smaller than for the decay mode, which makes the statistical precision worse than the total precision of the mode. The decay also requires the measurement of a photon from the decay and this introduces an additional systematic uncertainty.
For decays, the event-by-event uncertainty on the invariant mass is about 2; hence, with a few thousand reconstructed signal events, the statistical uncertainty is below 50 and the dominant uncertainty is systematic. The major part of the systematic uncertainty is estimated directly from the data by redoing the track fits with different assumptions on the amounts of detector material or the magnetic field strength, and measuring how much the invariant mass value changes with each assumption. The candidate selection criteria have been optimized on simulated events to minimize the expected systematic uncertainty.
To check that the procedure for estimating the systematic uncertainty is reasonable, we study large samples of and decays. The goal is to ensure that the measured mass values are consistent with the PDG values within the systematic uncertainty we estimate using the same procedure as for the signal mode. Large samples of and decays are also used and give invariant mass measurements that are consistent with the signal when their larger systematic uncertainties are taken into account.
III The BABAR Detector
The BABAR detector is described in detail elsewhere ref:babar . The momenta of charged particles are measured with a combination of a five-layer silicon vertex tracker (SVT) and a 40-layer drift chamber (DCH) in a 1.5-T solenoidal magnetic field. The momentum resolution is measured to be . A detector of internally reflected Cherenkov radiation (DIRC) is used in charged particle identification. Kaons and protons are identified with likelihood ratios calculated from measurements in the SVT and DCH, and from the observed pattern of Cherenkov light in the DIRC. A finely segmented CsI(Tl) electromagnetic calorimeter (EMC) is used to detect and measure photons and neutral hadrons, and to identify electrons. The instrumented flux return (IFR) contains resistive plate chambers for muon and long-lived neutral-hadron identification. For event simulation we use the Monte Carlo generator EVTGEN evtgen with a full detector simulation that uses GEANT4 geant4 .
The most critical component of this analysis is the quality of the track reconstruction. In order to maximize tracking efficiency, the track-finding algorithm is based on tracks found by the trigger system and by stand-alone track reconstruction in the SVT and in the DCH. Once a track has been found, the track parameters are determined using a Kalman filter algorithm chep2000 , which makes optimal use of the hit information and corrects for energy loss and multiple scattering in the material traversed and for inhomogeneities in the magnetic field. The material-traversal corrections change the track momentum according to the expected average energy loss and increase the covariance for track parameters to account for both multiple scattering and the variance in the energy loss. The energy loss depends on the particle velocity, therefore each track fit is performed separately for five particle hypotheses: electron, muon, pion, kaon, and proton. A simplified model of the BABAR detector material distribution is used in the Kalman filter algorithm in order to maintain reasonable execution time. The main layers of material traversed by a particle originating from the interaction point are the beam pipe at a radius of 2.5 cm, consisting of about 1.4-mm of beryllium and 1.5-mm of cooling water; five layers of 300-m-thick silicon detectors at radii from 3.3 cm to 15 cm; a 2-mm-thick carbon-fiber tube at a radius of 22 cm supporting the SVT and beam-line magnets; and the inner wall of the DCH at a radius of 24 cm, which is a 1-mm thick beryllium tube. Part of the support structure for the silicon detectors is modeled by increasing the thickness of each layer in the silicon detector by 60, while the effect of the DCH gas is modeled as a series of discrete material contributions. Detailed knowledge of the magnetic field is also essential to the track reconstruction. This is discussed in Section VII.2 below.
IV Data Sample
The data sample used for the mass measurement comprises an integrated luminosity of 232 collected from collisions at or 40 below the resonance. For the studies of and decays only a small subsample of the data is used due to the high production rates of these hadrons. Studies of simulated events are performed using Monte Carlo samples of generic and continuum events with an integrated luminosity equivalent to 240 to 275. More than 230000 simulated decays and 60000 simulated decays are used for studies of systematic uncertainty.
V Event Selection
V.1 Selection
The signal is reconstructed using only the charged two-body decay modes of the and hadrons. We form candidates from two tracks, one of which must be identified as a proton, and, after fitting to a common vertex, we require the combined invariant mass to be between 1106 and 1125. For surviving candidates, the two tracks are fit to a common vertex with the invariant mass constrained to the PDG mass. The probability of this mass-constrained vertex fit is required to be above . Similarly, a candidate is formed from two tracks, neither of which belongs to the candidate, with a combined invariant mass between 460 and 530. For surviving candidates, the two daughter tracks are fit to a common vertex with the mass constrained to the PDG mass and the fit probability is required to be higher than . The and candidates are then combined with a fifth track, identified as a charged kaon, in a fit to a common vertex to form a candidate. The candidate must have an invariant mass between 2250 and 2330. The probability of the vertex fit should be greater than . To suppress combinatorial background, the signed decay length of a candidate is required to be larger than three times its estimated uncertainty. The signed decay length is defined as the distance between the and candidate along the momentum in the CM frame. To further suppress background, which results mainly from decays, the momentum () of the candidate in the center-of-mass frame (CM) is required to be at least 2. This requirement also helps to reduce systematic uncertainties that affect mainly low-momentum tracks. The selection efficiency, not including branching fractions, is about 15% for decays with CM momentum larger than 2. The background is suppressed sufficiently to not be an issue for the mass measurement.
V.2 Selection
The mode is reconstructed from , and and hadrons decaying into two charged particles. The and candidates are formed in the same way as in the selection. A candidate is formed by combining a candidate with a photon and requiring the combined invariant mass to be between 1184 and 1196. A photon candidate is defined as an energy deposit in the EMC of at least 30 that is not associated with any track and has a lateral moment LAT of its shower energy deposition of less than 0.8. If several photons can be combined with a to form candidates, only the candidate with the most energetic photon is retained in order to avoid double counting. The candidates are fit with their mass constrained to the PDG mass and are combined with and candidates to form candidates that must satisfy the same invariant mass, vertex probability, and requirements as candidates. The selection efficiency, not including branching fractions, is estimated to be about 8% for decays with CM momentum larger than 2.
From simulation we expect that 18% of the decays are reconstructed with the wrong photon in the candidate. Due to the low energy of the photon and the mass constraint on the candidate, these candidates still have the correct mass on average, but the mass resolution of these candidates is significantly degraded.
V.3 Selection
candidates are formed from three tracks identified as a proton, a kaon, and a pion with a combined invariant mass between 2240 and 2330. The tracks are fit to a common vertex and the probability of the vertex fit is required to be greater than . The signal-selection efficiency is about 42% and depends on the momentum.
V.4 Selection
For the decay mode, the candidates are required to satisfy the same criteria as in the mode, but with the further constraint that the decay angle of the in the rest frame with respect to the line-of-flight must satisfy . This removes contamination from conversions. The candidates are combined with tracks identified as protons in a fit to a common vertex and the resulting candidates are required to have an invariant mass between 2240 and 2330. The probability of the vertex fit is required to be above . The signal selection efficiency is about 41% and depends on the momentum.
V.5 and Selection
For the cross check studies in Section VII, large samples of and decays are reconstructed using similar criteria as those used to select and candidates for decays. The mass-constrained vertex fits are replaced with geometric vertex fits with the requirement of a fit probability greater than . For both and candidates the signed decay length calculated with respect to the interaction point is required to be larger than three times its uncertainty.
VI Signal Fits
The invariant mass distribution for the candidates is shown in Fig. 1. A clear signal peak is observed. A binned maximum likelihood fit to the mass distribution is performed using a sum of two Gaussians with a common mean for the signal function. The background is described by a linear function as suggested by simulation studies. The fit parameter values are given in Table 1. Note that the uncertainty on the mean mass is statistical only and a correction for underestimated energy loss described in the next section has not been applied to the fitted mass.
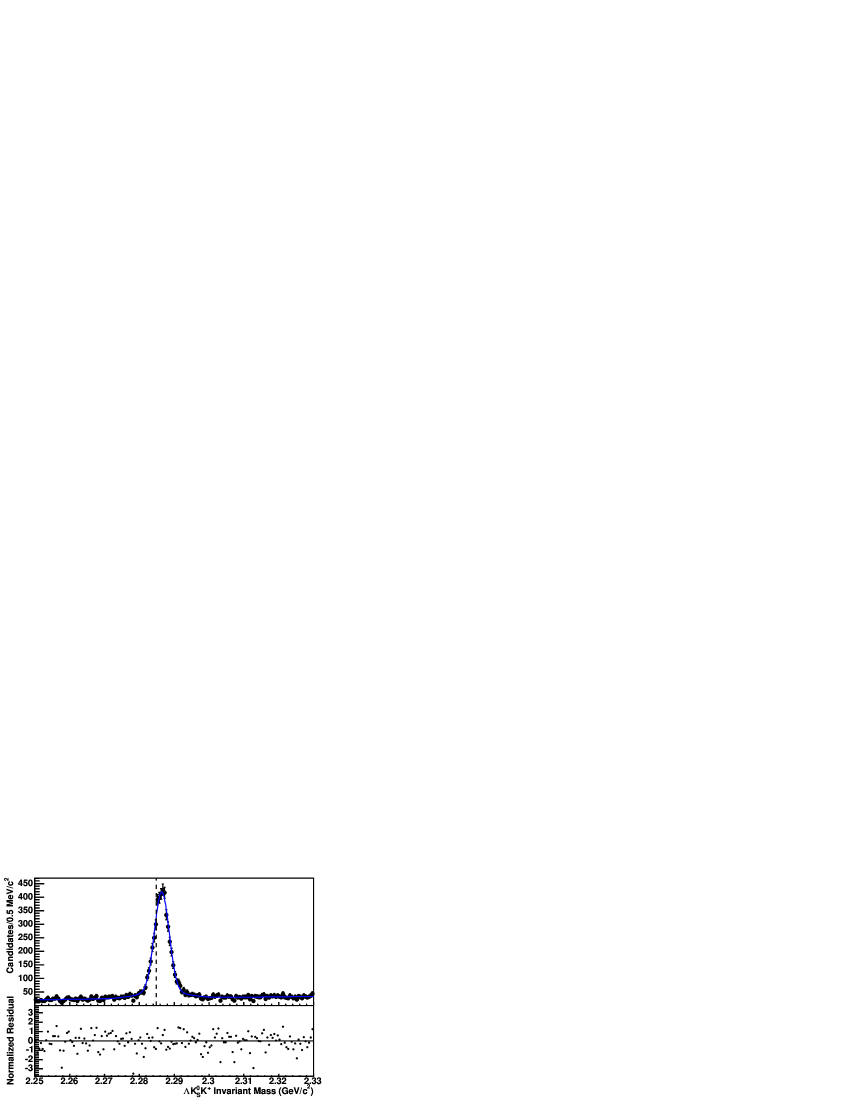
| Parameter | ||
|---|---|---|
| Fitted mass () | ||
| Signal yield (events) | ||
| Narrow width () | ||
| Broad width () | — | |
| Narrow fraction | — | |
| HWHM () |
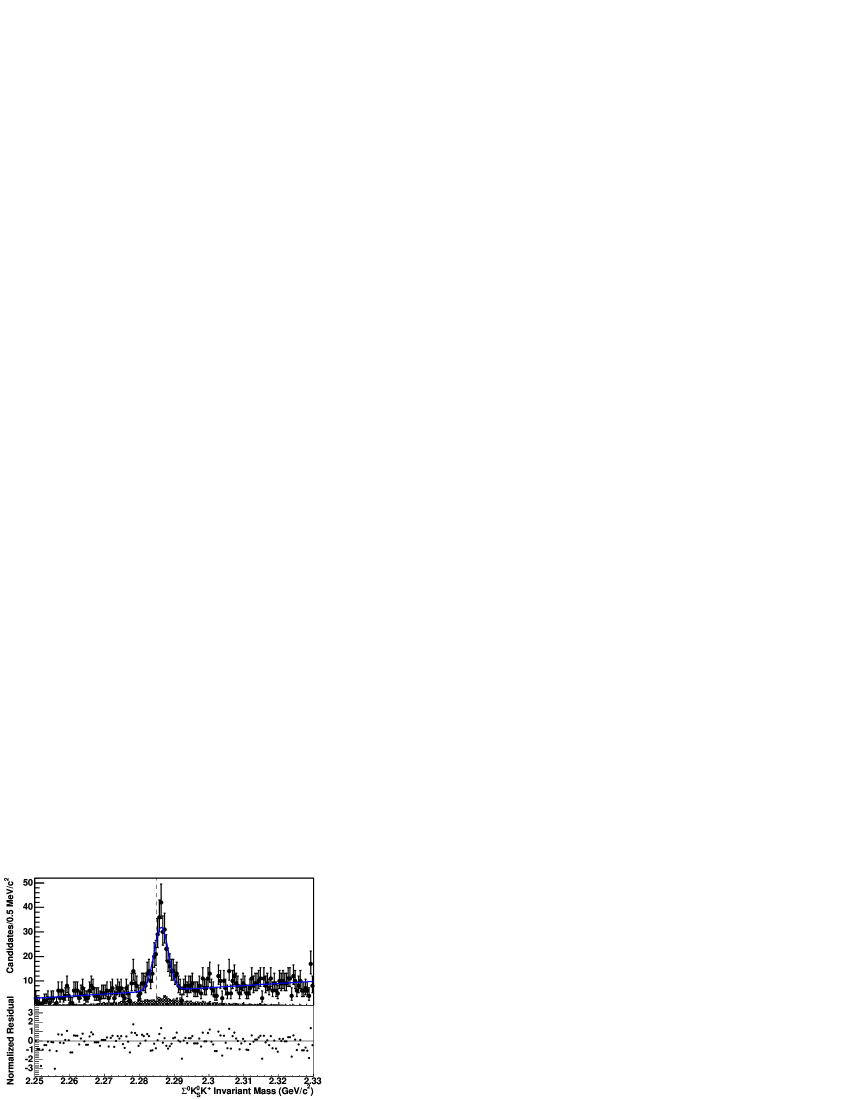
The invariant mass distribution for the candidates is shown in Fig. 2. A small but significant signal peak is observed. The figure also shows the expected background under the peak from decays with a correct but a wrong photon used in candidate selection. A binned maximum likelihood fit of the mass distribution is performed using a single Gaussian for the signal. The background is described by a linear function. The wrongly-reconstructed candidates are absorbed into the signal and background because they peak at the mass. The fit parameter values are given in Table 1.
The invariant-mass distributions for the four control modes are shown in Fig. 3. The and signals are fit to a sum of three Gaussians with common mean, while the two signals are fit to a sum of two Gaussians with common mean. The background in all four cases is modeled with a second-degree polynomial. The fit yields, mass, and signal RMS values are listed in Table VI. The fitted mass values for the and are significantly below the PDG values. This is mainly due to an underestimation of the energy loss in the detector material and is described in more detail in the next section.
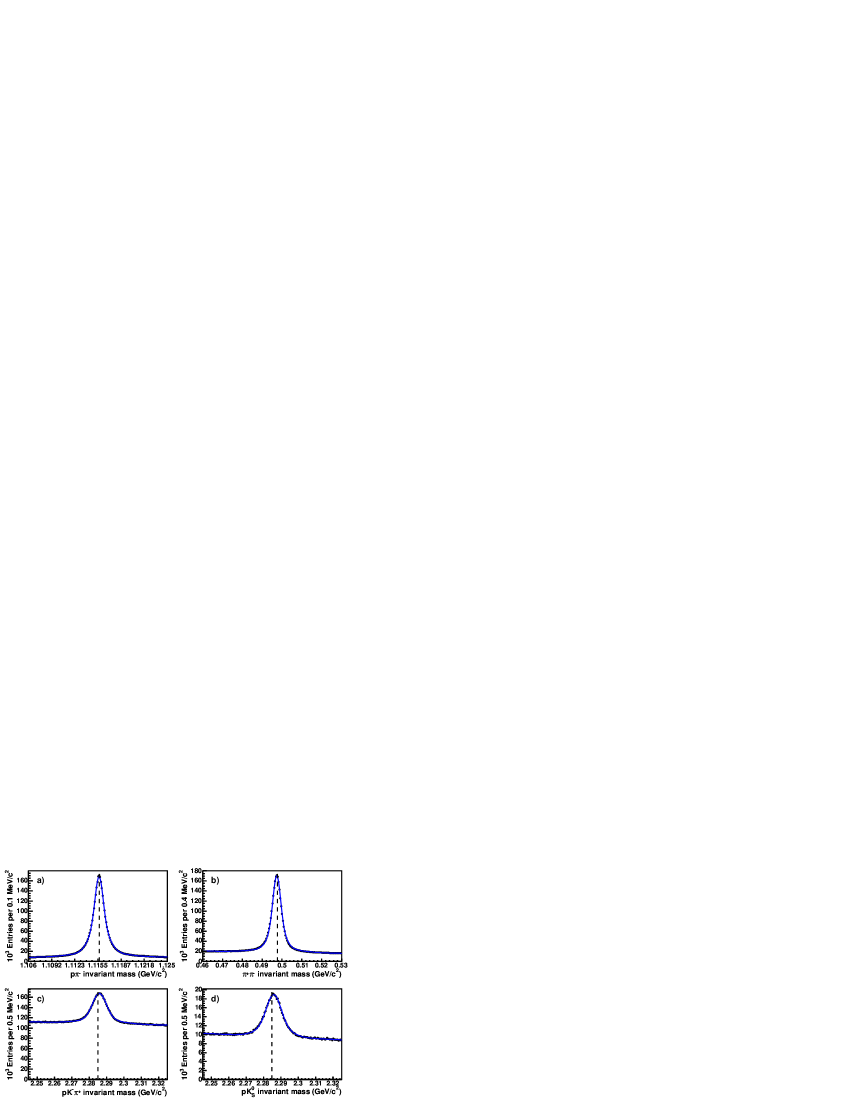
| Parameter | ||||
|---|---|---|---|---|
| PDG mass () | ||||
| Fitted mass () | ||||
| Signal yield (events) | ||||
| HWHM () |
VII Cross-checks
The four control mode samples discussed above are used to understand the accuracy to which particle masses can be measured in BABAR.
VII.1 Material Dependence
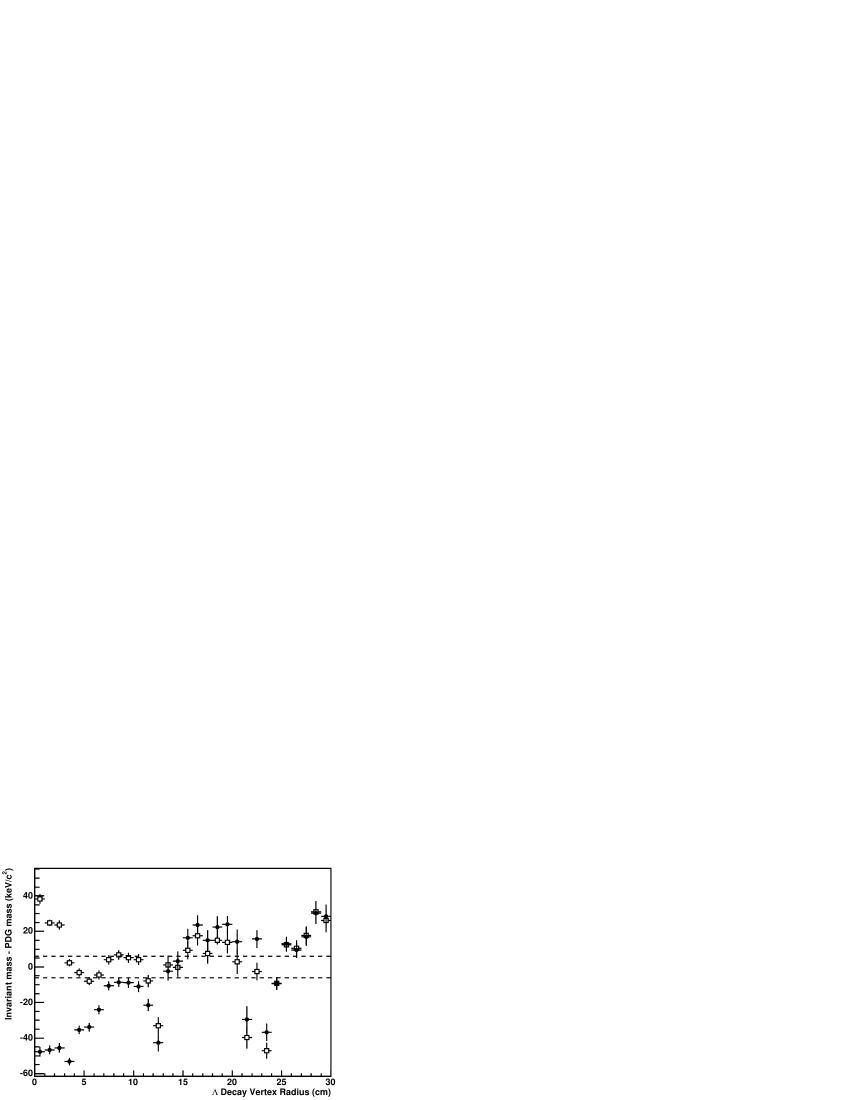
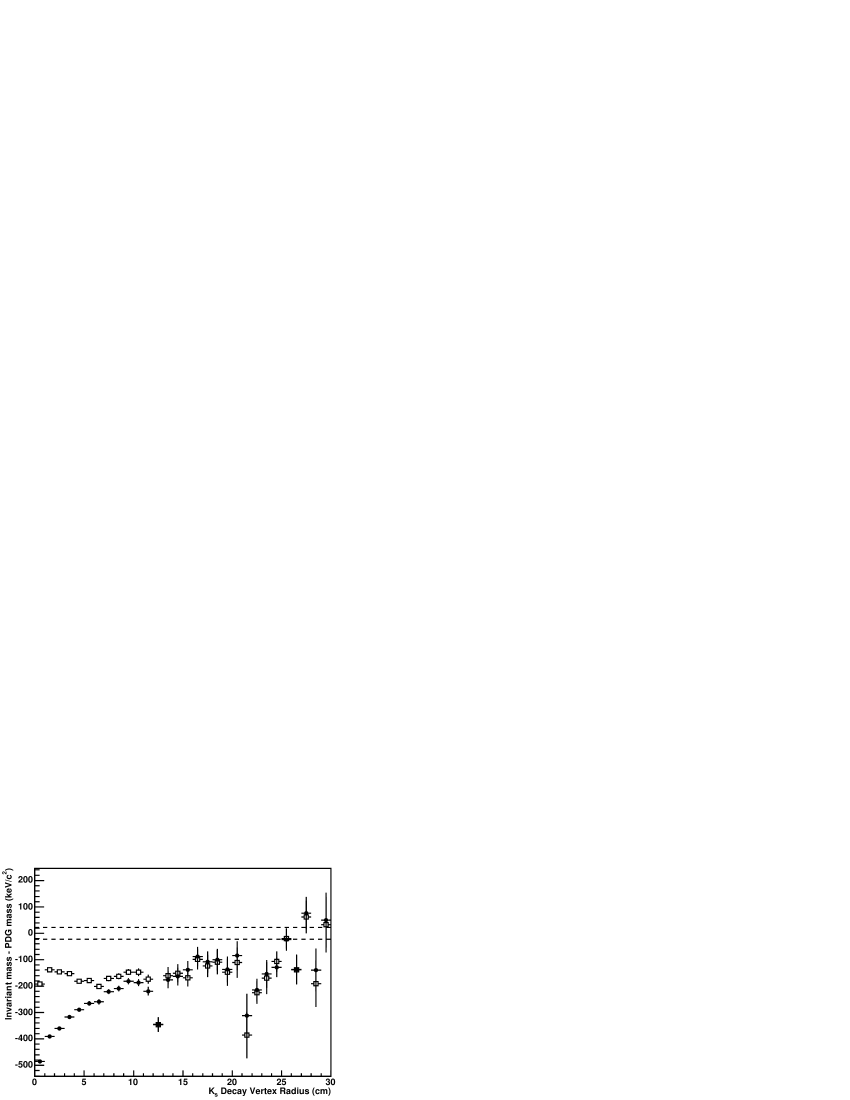
The main systematic uncertainty on the mass comes from uncertainties in the energy-loss correction in charged particle tracking. The low and fitted mass values given in Table VI indicate that the energy-loss correction may be underestimated. The long lifetimes of and hadrons enable us to study this in more detail. Figure 4 shows the and fitted mass values as a function of the radial distance from the interaction point to their decay point. The further the decay point is from the interaction point, the less material the charged daughter particles traverse, and so energy-loss corrections become less significant. The deviation from the PDG value is seen to be largest for decays closest to the interaction point, thereby strongly indicating that the underestimation of the mass values is due to insufficient material corrections. The lower fitted mass values at radii of 12 cm, 21 cm, and 23 cm coincide with vertices reconstructed inside or very near material sites. The same effect is observed in the reconstruction of simulated data. This is related to details of the incorporation of energy-loss corrections into the track-fit procedure in such circumstances.
The effect of increasing the amount of material assumed during the track reconstruction has been studied using several different scenarios. Figure 4 shows what happens if the material density in all parts of the SVT is increased uniformly by 20%. This is a gross simplification; however it removes most of the dependence on decay radius and moves the fitted hadron masses closer to their PDG values. The mass is, however, still consistently low compared to the PDG value by about 0.15.
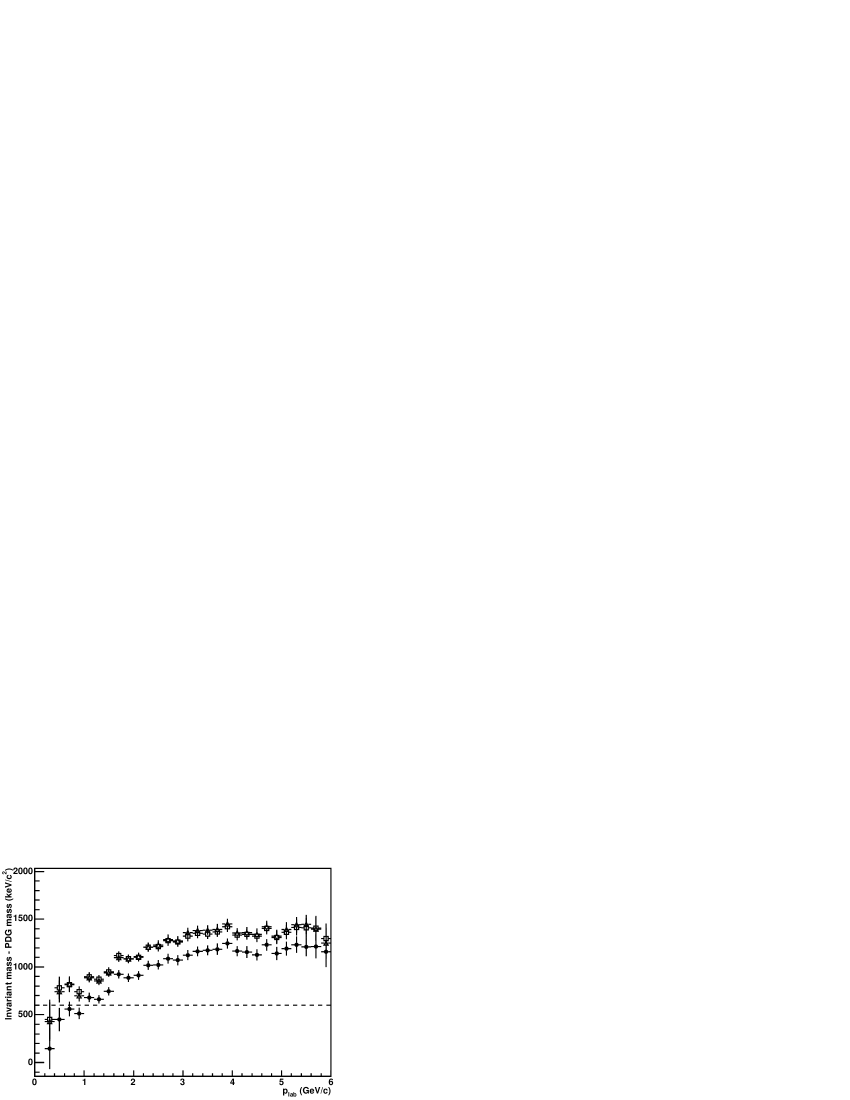
Another way to investigate the energy-loss correction is to study the fitted mass as a function of particle momentum. The lower the momentum of a charged particle, the more significant the energy-loss corrections become. Candidates are reconstructed from multiple tracks, but to simplify this investigation, the mass value is studied as a function of net candidate momentum calculated in the laboratory frame. Figure 5 shows the fitted mass value for and candidates as a function of the laboratory momentum. Above 3 the fitted mass value reaches a limit that is significantly above the PDG, while below 3 it falls by more than 800 as the momentum decreases. Similar behavior is observed for and hadrons, but the limiting value is reached at about 2. The decrease in mass is only about 60 for baryons and about 500 for mesons.

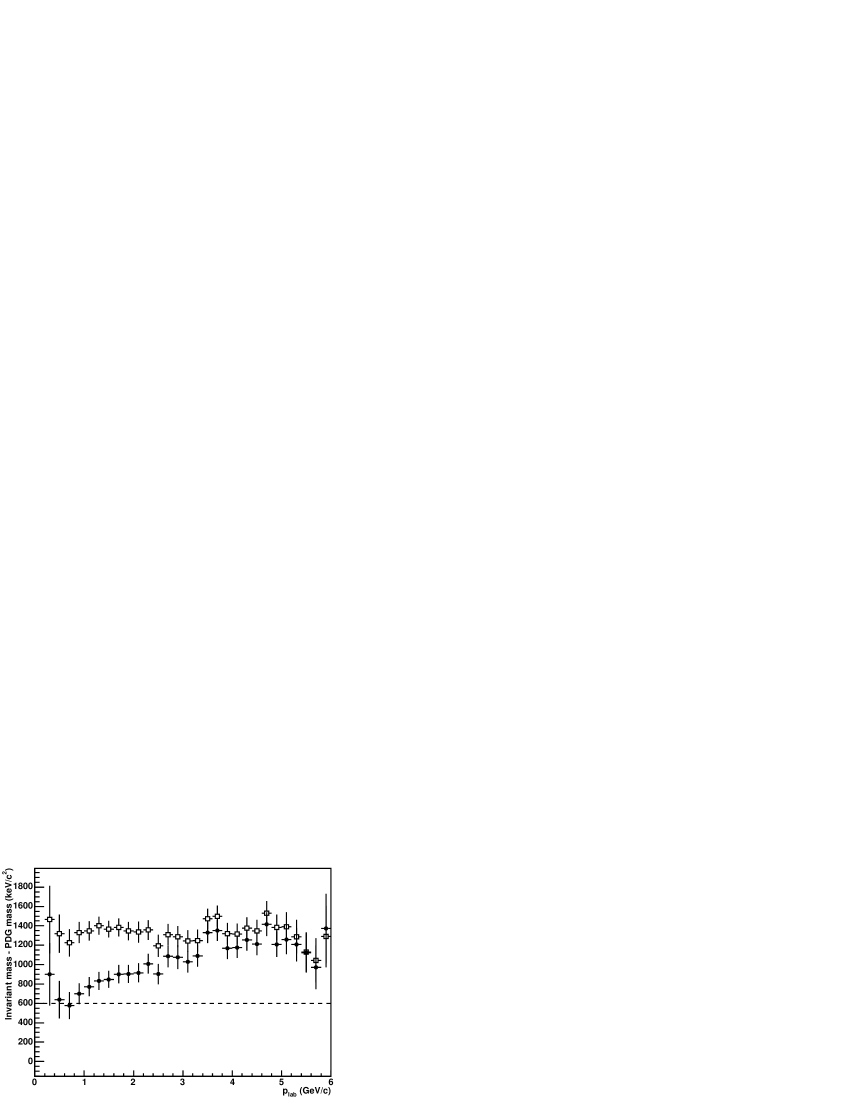
Increasing the assumed material density in the SVT by 20% is seen to greatly reduce the radial mass dependence in the and control samples and the momentum dependence in all control samples. We therefore apply this change to the reconstruction of the two low -value modes in order to obtain a more accurate mass measurement. However, since the mass still is not in agreement with the PDG value, we will use the largest observed variation in the fitted mass when we vary the material model as an estimate of the systematic uncertainty.
VII.2 Magnetic Field Dependence
The momentum measurements, and thus the mass measurements, depend critically on the magnetic field. The main component of the magnetic field is the solenoid field, which has an average value of 1.5 T parallel to the beam axis. The field was mapped very precisely with movable Hall probes before the detector was installed; an NMR probe measured the absolute field strength. The field strength in the tracking volume is estimated to be known to an accuracy of about 0.2 mT. The second most significant field component comes from the permanent magnets used for the final focusing and bending of the beams. The magnet closest to the interaction point is about 20 cm away. The fringe fields in the tracking volume from the magnets are weak and have been measured. More uncertain is the contribution to the magnetization of the permanent magnet material due to the solenoid field. This effect is measured only at a few specific points with Hall and NMR probes and we therefore rely on a finite element calculation to estimate the magnetization effect elsewhere. This model depends on the permeability of the magnets. These magnets are made of a SmCo alloy, which has a measured permeability in the direction transverse to the solenoidal field. However this is an average over many samples, which range from 1.04 to 1.10. Furthermore in the direction of the solenoidal field the permeability of the SmCo elements is measured to be about 5% larger. Therefore there is a significant uncertainty on this component of the field. The longitudinal field component at the interaction point from these magnets is about mT. This increases the curvature of charged particle trajectories.
We vary the assumed solenoid field strength by 0.02% for the systematic uncertainty studies. The magnetization field is varied by 20% in order to account for differences between the direct field measurements and the permeability measurements. Fig. 6 shows the effect on the fitted mass value as a function of momentum. The fitted mass value is seen to be shifted by the same amount independent of the momentum. The same is true for the other control samples, in particular for the and mass dependence on decay vertex radius. The control samples therefore provide little guidance on the magnetic field uncertainty.
VII.3 Dependence
Studies of the control samples reveal a significant dependence of the fitted mass value on the azimuthal angle of the hadron candidate momentum at the origin. This effect is not seen in simulated events. The dependence is shown in Figure 7 for the and samples. The effect is seen to be roughly anti-symmetric in with the lowest fitted mass at , corresponding to upward going hadrons, and the largest fitted mass at , corresponding to downward going hadrons.


We have not been able to identify the source of the dependence, but we can estimate the potential impact on the mass measurement. The magnitude of the variation increases with the momentum of the reconstructed hadron. This shows that the variation is not due to some asymmetry in the material distribution that was unaccounted for in reconstruction, which would influence low momentum particles the most. The dependence is also observed when only the DCH is used for reconstructing the tracks. This indicates that the source may be related to the internal alignment of the DCH, which is based on end-plate surveys done during construction of the chamber.
The dependence in the fitted mass can be reproduced qualitatively in simulated events by introducing an explicit dependence in the measured track momenta. To get the largest dependence at high momentum, the change has to be introduced as a bias in the track sagitta measurements. To a good approximation this corresponds to changing the transverse track momentum according to
| (1) |
The constant is chosen to reproduce the observed magnitude of the dependence. The chosen value corresponds to a change in track sagitta of 11, where the full sagitta for a track with 1 transverse momentum is about 3. Applying this modification to the and Monte Carlo samples introduces a dependence in the fitted mass values with an amplitude of 55 and 30, respectively. When averaging over all , the fitted mass value does not change, but given that the source of the dependence is not understood, we use these amplitudes as estimates of systematic uncertainty.
VIII Systematic Uncertainties
The major sources of systematic uncertainty (energy-loss correction, magnetic field, and dependence) have been described in detail in the previous section. All of the known systematic uncertainties are listed in Table 3. For the systematic uncertainty on the energy-loss correction we use the observed change in mass when the material density is increased uniformly by 10% in the tracking volume, which is a slightly larger change than the one from increasing the density in the SVT by 20%. The fit-procedure uncertainty summarizes the variation in the fitted mass value when the shapes of the signal, the background, and the choice of binning are varied. Possible biases from the internal alignment of the SVT are studied by applying small distortions to the SVT alignment in simulated events. The magnitude of the distortions correspond to the changes observed in the internal alignment between different run periods. For the mode, we vary the EMC energy scale by 5%, but due to the low energy of the photon and the mass constraint on the , this has little effect on the fitted mass. Finally the , and masses have uncertainties of 6, 16 and 22 and the effect of these uncertainties on the mass has been estimated.
| Solenoid field | ||
|---|---|---|
| Magnetization | ||
| Energy-loss correction | ||
| dependence | ||
| Fit procedure | ||
| SVT alignment | ||
| EMC energy scale | — | |
| Particle masses | ||
| Total systematic | ||
VIII.1 Energy-Loss Correction
The fitted mass values from Section VI need to be corrected for the underestimated energy loss. The correction is calculated by increasing the material density of the SVT by 20%, which is seen in the control samples to remove most of the momentum and decay-radius dependence. The corrections are 61 and 18 for the and samples, respectively. This gives the following results for the mass:
VIII.2 Combined Result
The systematic uncertainties on the two measurements are highly, but not fully, correlated. We combine the two mass measurements using the BLUE (Best Linear Unbiased Estimate) technique BLUE . Besides the statistical uncertainty, we consider the fit procedure uncertainty and uncertainties related only to the mode to be uncorrelated, while the remaining systematic uncertainties are 100% correlated. The correlation coefficient for the two measurements is estimated to be 0.355. The combined mass result is
VIII.3 Mass Cross-checks
From the two large--value data samples, we obtain measurements of the mass that can be compared to our more precise measurements from the and samples. To keep the systematic uncertainty low, we use only and candidates with laboratory momentum above 3, as Figure 5 shows that those candidates have less dependence on the assumed amount of detector material. The resulting mass value for each decay mode from fitting the invariant-mass spectra with the sum of two Gaussian distributions with common mean is given in Table VIII.3. The central values are corrected for the shift in mass observed when the material density of the SVT is increased by 20%. These corrections are 211 and 145 for the and modes, respectively.
Table VIII.3 also lists the major systematic uncertainties. The solenoid and magnetization fields are varied as for the low--value modes. For the energy-loss correction, we compare the effect of increasing the density of the SVT by 20% to the effect of increasing the density of material in the tracking volume by 10%, taking the larger change from the standard reconstruction as an estimate of the uncertainty. For both decays the larger effect is the 10% material change in the full tracking volume. The dependence is estimated by introducing a dependence in the simulation as described by Eq. (1). The uncertainty is the maximum change in mass introduced. The results
are in good agreement with our main result, but have larger systematic uncertainties.
The sample is sufficiently large that we can fit the and mass distributions for candidates that are combined to form the . In order to fit the and mass distributions, the mass constraint is removed from the candidate reconstruction and the resulting invariant mass spectra are fit with a double-Gaussian signal shape and a linear background. The resulting mass values and systematic uncertainties are listed in Table 5. The mass correction for the underestimated energy loss and the systematic uncertainties are estimated as for the and samples. The final results after the energy-loss correction,
are in agreement with the PDG
Since the and candidates are the same candidates used in the final sample, the agreement with the PDG mass values gives further confidence in the mass result.
| Fitted Mass | ||
|---|---|---|
| Corrected Mass | ||
| Solenoid field | ||
| Magnetization | ||
| Energy-loss correction | ||
| dependence | ||
| Total systematic |
IX Summary
We have presented a precision measurement of the mass using the low--value decay modes and in order to minimize systematic uncertainty. The measured mass in the two modes is
Combining these measurements, taking the correlated systematics into account, the final result for the mass is
This result is in agreement with the mass values measured in other decay modes, although those are subject to large systematic uncertainty. The systematic uncertainty has been cross-checked using large data samples of , and decays. The studies have shown that there is an underestimation of the energy-loss correction, and a dependence on azimuthal angle in the standard BABAR track reconstruction. The impact on the mass measurement has been taken into account in the corresponding estimates of systematic uncertainty.
This mass measurement is the most precise measurement of an open charm hadron mass to date and is an improvement in precision by more than a factor of four over the current PDG value of . Our result is about higher than the PDG value, which is based on several high -value decay modes, mainly decays. Theoretical calculations of the mass, such as those based upon lattice QCD Bowler:1996ws or advanced potential models Albertus:2003sx , currently have significantly larger uncertainty than the experimental result presented here.
Acknowledgements.
We are grateful for the extraordinary contributions of our PEP-II colleagues in achieving the excellent luminosity and machine conditions that have made this work possible. The success of this project also relies critically on the expertise and dedication of the computing organizations that support BABAR. The collaborating institutions wish to thank SLAC for its support and the kind hospitality extended to them. This work is supported by the US Department of Energy and National Science Foundation, the Natural Sciences and Engineering Research Council (Canada), Institute of High Energy Physics (China), the Commissariat à l’Energie Atomique and Institut National de Physique Nucléaire et de Physique des Particules (France), the Bundesministerium für Bildung und Forschung and Deutsche Forschungsgemeinschaft (Germany), the Istituto Nazionale di Fisica Nucleare (Italy), the Foundation for Fundamental Research on Matter (The Netherlands), the Research Council of Norway, the Ministry of Science and Technology of the Russian Federation, and the Particle Physics and Astronomy Research Council (United Kingdom). Individuals have received support from CONACyT (Mexico), the A. P. Sloan Foundation, the Research Corporation, and the Alexander von Humboldt Foundation.References
- (1) S. Eidelman et al., Phys. Lett. B 592, 1 (2004). We refer to averages or fits from this reference as “PDG” values.
- (2) Throughout this paper, flavor-eigenstate decay modes imply also their charge conjugate.
- (3) R. Ammar et al. (CLEO Collaboration), Phys. Rev. Lett. 74, 3534 (1995).
- (4) K. Abe et al. (Belle Collaboration), Phys. Lett. B 524, 33 (2002).
- (5) B. Aubert et al. (BABAR Collaboration), Nucl. Instr. Methods Phys. Res., Sect. A 479, 1 (2002).
- (6) D. J. Lange, Nucl. Instr. Methods Phys. Res., Sect. A 462, 152 (2001).
- (7) S. Agostinelli et al. (GEANT4 Collaboration), Nucl. Instr. Methods Phys. Res., Sect. A 506, 250 (2003).
- (8) D. Brown, E. Charles, and D. Roberts, “The BABAR Track Fitting Algorithm”, contributed paper to CHEP 2000.
- (9) A. Drescher et al. (ARGUS Collaboration), Nucl. Instr. Methods Phys. Res., Sect. A 237, 464 (1985).
- (10) L. Lyons, D. Gibaut and P. Clifford, Nucl. Instr. Methods Phys. Res., Sect. A 270, 110 (1988).
- (11) K. C. Bowler et al. (UKQCD Collaboration), Phys. Rev. D 54, 3619 (1996).
- (12) C. Albertus, J. E. Amaro, E. Hernandez and J. Nieves, Nucl. Phys. A 740, 333 (2004).