BABAR-CONF-05/05/006
SLAC-PUB-11329
hep-ex/0000
June 2005
Results from the BABAR Fully Inclusive Measurement of
The BABAR Collaboration
Abstract
We present preliminary results from a lepton-tagged fully-inclusive
measurement of decays, where is any strange hadronic state.
Results are based on a BABAR data set of
88.5 million pairs at the resonance. We present a
reconstructed photon energy spectrum in the frame, and
partial branching fractions above minimum reconstructed photon energies of
1.9, 2.0, 2.1 and 2.2 GeV. We then convert these to measurements of
partial branching fractions and truncated first and second moments of the
true photon energy distribution in the rest frame, above the same
minimum photon energy values.
The full correlation matrices between the first and second moments are
included to allow fitting to any parameterized theoretical calculation.
We also measure the direct asymmetry
(based on the charge of the tagging lepton) above a reconstructed photon
energy of 2.2 GeV.
Contributed to the XXIIst International Symposium on Lepton and Photon Interactions at High Energies, 6/30 — 7/5/2005, Uppsala, Sweden
Stanford Linear Accelerator Center, Stanford University, Stanford, CA 94309
Work supported in part by Department of Energy contract DE-AC03-76SF00515.
The BABAR Collaboration,
B. Aubert, R. Barate, D. Boutigny, F. Couderc, Y. Karyotakis, J. P. Lees, V. Poireau, V. Tisserand, A. Zghiche
Laboratoire de Physique des Particules, F-74941 Annecy-le-Vieux, France
E. Grauges
IFAE, Universitat Autonoma de Barcelona, E-08193 Bellaterra, Barcelona, Spain
A. Palano, M. Pappagallo, A. Pompili
Università di Bari, Dipartimento di Fisica and INFN, I-70126 Bari, Italy
J. C. Chen, N. D. Qi, G. Rong, P. Wang, Y. S. Zhu
Institute of High Energy Physics, Beijing 100039, China
G. Eigen, I. Ofte, B. Stugu
University of Bergen, Institute of Physics, N-5007 Bergen, Norway
G. S. Abrams, M. Battaglia, A. B. Breon, D. N. Brown, J. Button-Shafer, R. N. Cahn, E. Charles, C. T. Day, M. S. Gill, A. V. Gritsan, Y. Groysman, R. G. Jacobsen, R. W. Kadel, J. Kadyk, L. T. Kerth, Yu. G. Kolomensky, G. Kukartsev, G. Lynch, L. M. Mir, P. J. Oddone, T. J. Orimoto, M. Pripstein, N. A. Roe, M. T. Ronan, W. A. Wenzel
Lawrence Berkeley National Laboratory and University of California, Berkeley, California 94720, USA
M. Barrett, K. E. Ford, T. J. Harrison, A. J. Hart, C. M. Hawkes, S. E. Morgan, A. T. Watson
University of Birmingham, Birmingham, B15 2TT, United Kingdom
M. Fritsch, K. Goetzen, T. Held, H. Koch, B. Lewandowski, M. Pelizaeus, K. Peters, T. Schroeder, M. Steinke
Ruhr Universität Bochum, Institut für Experimentalphysik 1, D-44780 Bochum, Germany
J. T. Boyd, J. P. Burke, N. Chevalier, W. N. Cottingham
University of Bristol, Bristol BS8 1TL, United Kingdom
T. Cuhadar-Donszelmann, B. G. Fulsom, C. Hearty, N. S. Knecht, T. S. Mattison, J. A. McKenna
University of British Columbia, Vancouver, British Columbia, Canada V6T 1Z1
A. Khan, P. Kyberd, M. Saleem, L. Teodorescu
Brunel University, Uxbridge, Middlesex UB8 3PH, United Kingdom
A. E. Blinov, V. E. Blinov, A. D. Bukin, V. P. Druzhinin, V. B. Golubev, E. A. Kravchenko, A. P. Onuchin, S. I. Serednyakov, Yu. I. Skovpen, E. P. Solodov, A. N. Yushkov
Budker Institute of Nuclear Physics, Novosibirsk 630090, Russia
D. Best, M. Bondioli, M. Bruinsma, M. Chao, S. Curry, I. Eschrich, D. Kirkby, A. J. Lankford, P. Lund, M. Mandelkern, R. K. Mommsen, W. Roethel, D. P. Stoker
University of California at Irvine, Irvine, California 92697, USA
C. Buchanan, B. L. Hartfiel, A. J. R. Weinstein
University of California at Los Angeles, Los Angeles, California 90024, USA
S. D. Foulkes, J. W. Gary, O. Long, B. C. Shen, K. Wang, L. Zhang
University of California at Riverside, Riverside, California 92521, USA
D. del Re, H. K. Hadavand, E. J. Hill, D. B. MacFarlane, H. P. Paar, S. Rahatlou, V. Sharma
University of California at San Diego, La Jolla, California 92093, USA
J. W. Berryhill, C. Campagnari, A. Cunha, B. Dahmes, T. M. Hong, M. A. Mazur, J. D. Richman, W. Verkerke
University of California at Santa Barbara, Santa Barbara, California 93106, USA
T. W. Beck, A. M. Eisner, C. J. Flacco, C. A. Heusch, J. Kroseberg, W. S. Lockman, G. Nesom, T. Schalk, B. A. Schumm, A. Seiden, P. Spradlin, D. C. Williams, M. G. Wilson
University of California at Santa Cruz, Institute for Particle Physics, Santa Cruz, California 95064, USA
J. Albert, E. Chen, G. P. Dubois-Felsmann, A. Dvoretskii, D. G. Hitlin, I. Narsky, T. Piatenko, F. C. Porter, A. Ryd, A. Samuel
California Institute of Technology, Pasadena, California 91125, USA
R. Andreassen, S. Jayatilleke, G. Mancinelli, B. T. Meadows, M. D. Sokoloff
University of Cincinnati, Cincinnati, Ohio 45221, USA
F. Blanc, P. Bloom, S. Chen, W. T. Ford, J. F. Hirschauer, A. Kreisel, U. Nauenberg, A. Olivas, P. Rankin, W. O. Ruddick, J. G. Smith, K. A. Ulmer, S. R. Wagner, J. Zhang
University of Colorado, Boulder, Colorado 80309, USA
A. Chen, E. A. Eckhart, J. L. Harton, A. Soffer, W. H. Toki, R. J. Wilson, Q. Zeng
Colorado State University, Fort Collins, Colorado 80523, USA
D. Altenburg, E. Feltresi, A. Hauke, B. Spaan
Universität Dortmund, Institut fur Physik, D-44221 Dortmund, Germany
T. Brandt, J. Brose, M. Dickopp, V. Klose, H. M. Lacker, R. Nogowski, S. Otto, A. Petzold, G. Schott, J. Schubert, K. R. Schubert, R. Schwierz, J. E. Sundermann
Technische Universität Dresden, Institut für Kern- und Teilchenphysik, D-01062 Dresden, Germany
D. Bernard, G. R. Bonneaud, P. Grenier, S. Schrenk, Ch. Thiebaux, G. Vasileiadis, M. Verderi
Ecole Polytechnique, LLR, F-91128 Palaiseau, France
D. J. Bard, P. J. Clark, W. Gradl, F. Muheim, S. Playfer, Y. Xie
University of Edinburgh, Edinburgh EH9 3JZ, United Kingdom
M. Andreotti, V. Azzolini, D. Bettoni, C. Bozzi, R. Calabrese, G. Cibinetto, E. Luppi, M. Negrini, L. Piemontese
Università di Ferrara, Dipartimento di Fisica and INFN, I-44100 Ferrara, Italy
F. Anulli, R. Baldini-Ferroli, A. Calcaterra, R. de Sangro, G. Finocchiaro, P. Patteri, I. M. Peruzzi,111Also with Università di Perugia, Dipartimento di Fisica, Perugia, Italy M. Piccolo, A. Zallo
Laboratori Nazionali di Frascati dell’INFN, I-00044 Frascati, Italy
A. Buzzo, R. Capra, R. Contri, M. Lo Vetere, M. Macri, M. R. Monge, S. Passaggio, C. Patrignani, E. Robutti, A. Santroni, S. Tosi
Università di Genova, Dipartimento di Fisica and INFN, I-16146 Genova, Italy
G. Brandenburg, K. S. Chaisanguanthum, M. Morii, E. Won, J. Wu
Harvard University, Cambridge, Massachusetts 02138, USA
R. S. Dubitzky, U. Langenegger, J. Marks, S. Schenk, U. Uwer
Universität Heidelberg, Physikalisches Institut, Philosophenweg 12, D-69120 Heidelberg, Germany
W. Bhimji, D. A. Bowerman, P. D. Dauncey, U. Egede, R. L. Flack, J. R. Gaillard, G. W. Morton, J. A. Nash, M. B. Nikolich, G. P. Taylor, W. P. Vazquez
Imperial College London, London, SW7 2AZ, United Kingdom
M. J. Charles, W. F. Mader, U. Mallik, A. K. Mohapatra
University of Iowa, Iowa City, Iowa 52242, USA
J. Cochran, H. B. Crawley, V. Eyges, W. T. Meyer, S. Prell, E. I. Rosenberg, A. E. Rubin, J. Yi
Iowa State University, Ames, Iowa 50011-3160, USA
N. Arnaud, M. Davier, X. Giroux, G. Grosdidier, A. Höcker, F. Le Diberder, V. Lepeltier, A. M. Lutz, A. Oyanguren, T. C. Petersen, M. Pierini, S. Plaszczynski, S. Rodier, P. Roudeau, M. H. Schune, A. Stocchi, G. Wormser
Laboratoire de l’Accélérateur Linéaire, F-91898 Orsay, France
C. H. Cheng, D. J. Lange, M. C. Simani, D. M. Wright
Lawrence Livermore National Laboratory, Livermore, California 94550, USA
A. J. Bevan, C. A. Chavez, J. P. Coleman, I. J. Forster, J. R. Fry, E. Gabathuler, R. Gamet, K. A. George, D. E. Hutchcroft, R. J. Parry, D. J. Payne, K. C. Schofield, C. Touramanis
University of Liverpool, Liverpool L69 72E, United Kingdom
C. M. Cormack, F. Di Lodovico, W. Menges, R. Sacco
Queen Mary, University of London, E1 4NS, United Kingdom
C. L. Brown, G. Cowan, H. U. Flaecher, M. G. Green, D. A. Hopkins, P. S. Jackson, T. R. McMahon, S. Ricciardi, F. Salvatore
University of London, Royal Holloway and Bedford New College, Egham, Surrey TW20 0EX, United Kingdom
D. Brown, C. L. Davis
University of Louisville, Louisville, Kentucky 40292, USA
J. Allison, N. R. Barlow, R. J. Barlow, C. L. Edgar, M. C. Hodgkinson, M. P. Kelly, G. D. Lafferty, M. T. Naisbit, J. C. Williams
University of Manchester, Manchester M13 9PL, United Kingdom
C. Chen, W. D. Hulsbergen, A. Jawahery, D. Kovalskyi, C. K. Lae, D. A. Roberts, G. Simi
University of Maryland, College Park, Maryland 20742, USA
G. Blaylock, C. Dallapiccola, S. S. Hertzbach, R. Kofler, V. B. Koptchev, X. Li, T. B. Moore, S. Saremi, H. Staengle, S. Willocq
University of Massachusetts, Amherst, Massachusetts 01003, USA
R. Cowan, K. Koeneke, G. Sciolla, S. J. Sekula, M. Spitznagel, F. Taylor, R. K. Yamamoto
Massachusetts Institute of Technology, Laboratory for Nuclear Science, Cambridge, Massachusetts 02139, USA
H. Kim, P. M. Patel, S. H. Robertson
McGill University, Montréal, Quebec, Canada H3A 2T8
A. Lazzaro, V. Lombardo, F. Palombo
Università di Milano, Dipartimento di Fisica and INFN, I-20133 Milano, Italy
J. M. Bauer, L. Cremaldi, V. Eschenburg, R. Godang, R. Kroeger, J. Reidy, D. A. Sanders, D. J. Summers, H. W. Zhao
University of Mississippi, University, Mississippi 38677, USA
S. Brunet, D. Côté, P. Taras, B. Viaud
Université de Montréal, Laboratoire René J. A. Lévesque, Montréal, Quebec, Canada H3C 3J7
H. Nicholson
Mount Holyoke College, South Hadley, Massachusetts 01075, USA
N. Cavallo,222Also with Università della Basilicata, Potenza, Italy G. De Nardo, F. Fabozzi,22footnotemark: 2 C. Gatto, L. Lista, D. Monorchio, P. Paolucci, D. Piccolo, C. Sciacca
Università di Napoli Federico II, Dipartimento di Scienze Fisiche and INFN, I-80126, Napoli, Italy
M. Baak, H. Bulten, G. Raven, H. L. Snoek, L. Wilden
NIKHEF, National Institute for Nuclear Physics and High Energy Physics, NL-1009 DB Amsterdam, The Netherlands
C. P. Jessop, J. M. LoSecco
University of Notre Dame, Notre Dame, Indiana 46556, USA
T. Allmendinger, G. Benelli, K. K. Gan, K. Honscheid, D. Hufnagel, P. D. Jackson, H. Kagan, R. Kass, T. Pulliam, A. M. Rahimi, R. Ter-Antonyan, Q. K. Wong
Ohio State University, Columbus, Ohio 43210, USA
J. Brau, R. Frey, O. Igonkina, M. Lu, C. T. Potter, N. B. Sinev, D. Strom, J. Strube, E. Torrence
University of Oregon, Eugene, Oregon 97403, USA
F. Galeazzi, M. Margoni, M. Morandin, M. Posocco, M. Rotondo, F. Simonetto, R. Stroili, C. Voci
Università di Padova, Dipartimento di Fisica and INFN, I-35131 Padova, Italy
M. Benayoun, H. Briand, J. Chauveau, P. David, L. Del Buono, Ch. de la Vaissière, O. Hamon, M. J. J. John, Ph. Leruste, J. Malclès, J. Ocariz, L. Roos, G. Therin
Universités Paris VI et VII, Laboratoire de Physique Nucléaire et de Hautes Energies, F-75252 Paris, France
P. K. Behera, L. Gladney, Q. H. Guo, J. Panetta
University of Pennsylvania, Philadelphia, Pennsylvania 19104, USA
M. Biasini, R. Covarelli, S. Pacetti, M. Pioppi
Università di Perugia, Dipartimento di Fisica and INFN, I-06100 Perugia, Italy
C. Angelini, G. Batignani, S. Bettarini, F. Bucci, G. Calderini, M. Carpinelli, R. Cenci, F. Forti, M. A. Giorgi, A. Lusiani, G. Marchiori, M. Morganti, N. Neri, E. Paoloni, M. Rama, G. Rizzo, J. Walsh
Università di Pisa, Dipartimento di Fisica, Scuola Normale Superiore and INFN, I-56127 Pisa, Italy
M. Haire, D. Judd, D. E. Wagoner
Prairie View A&M University, Prairie View, Texas 77446, USA
J. Biesiada, N. Danielson, P. Elmer, Y. P. Lau, C. Lu, J. Olsen, A. J. S. Smith, A. V. Telnov
Princeton University, Princeton, New Jersey 08544, USA
F. Bellini, G. Cavoto, A. D’Orazio, E. Di Marco, R. Faccini, F. Ferrarotto, F. Ferroni, M. Gaspero, L. Li Gioi, M. A. Mazzoni, S. Morganti, G. Piredda, F. Polci, F. Safai Tehrani, C. Voena
Università di Roma La Sapienza, Dipartimento di Fisica and INFN, I-00185 Roma, Italy
H. Schröder, G. Wagner, R. Waldi
Universität Rostock, D-18051 Rostock, Germany
T. Adye, N. De Groot, B. Franek, G. P. Gopal, E. O. Olaiya, F. F. Wilson
Rutherford Appleton Laboratory, Chilton, Didcot, Oxon, OX11 0QX, United Kingdom
R. Aleksan, S. Emery, A. Gaidot, S. F. Ganzhur, P.-F. Giraud, G. Graziani, G. Hamel de Monchenault, W. Kozanecki, M. Legendre, G. W. London, B. Mayer, G. Vasseur, Ch. Yèche, M. Zito
DSM/Dapnia, CEA/Saclay, F-91191 Gif-sur-Yvette, France
M. V. Purohit, A. W. Weidemann, J. R. Wilson, F. X. Yumiceva
University of South Carolina, Columbia, South Carolina 29208, USA
T. Abe, M. T. Allen, D. Aston, N. Bakel, R. Bartoldus, N. Berger, A. M. Boyarski, O. L. Buchmueller, R. Claus, M. R. Convery, M. Cristinziani, J. C. Dingfelder, D. Dong, J. Dorfan, D. Dujmic, W. Dunwoodie, S. Fan, R. C. Field, T. Glanzman, S. J. Gowdy, T. Hadig, V. Halyo, C. Hast, T. Hryn’ova, W. R. Innes, M. H. Kelsey, P. Kim, M. L. Kocian, D. W. G. S. Leith, J. Libby, S. Luitz, V. Luth, H. L. Lynch, H. Marsiske, R. Messner, D. R. Muller, C. P. O’Grady, V. E. Ozcan, A. Perazzo, M. Perl, B. N. Ratcliff, A. Roodman, A. A. Salnikov, R. H. Schindler, J. Schwiening, A. Snyder, J. Stelzer, D. Su, M. K. Sullivan, K. Suzuki, S. Swain, J. M. Thompson, J. Va’vra, M. Weaver, W. J. Wisniewski, M. Wittgen, D. H. Wright, A. K. Yarritu, K. Yi, C. C. Young
Stanford Linear Accelerator Center, Stanford, California 94309, USA
P. R. Burchat, A. J. Edwards, S. A. Majewski, B. A. Petersen, C. Roat
Stanford University, Stanford, California 94305-4060, USA
M. Ahmed, S. Ahmed, M. S. Alam, J. A. Ernst, M. A. Saeed, F. R. Wappler, S. B. Zain
State University of New York, Albany, New York 12222, USA
W. Bugg, M. Krishnamurthy, S. M. Spanier
University of Tennessee, Knoxville, Tennessee 37996, USA
R. Eckmann, J. L. Ritchie, A. Satpathy, R. F. Schwitters
University of Texas at Austin, Austin, Texas 78712, USA
J. M. Izen, I. Kitayama, X. C. Lou, S. Ye
University of Texas at Dallas, Richardson, Texas 75083, USA
F. Bianchi, M. Bona, F. Gallo, D. Gamba
Università di Torino, Dipartimento di Fisica Sperimentale and INFN, I-10125 Torino, Italy
M. Bomben, L. Bosisio, C. Cartaro, F. Cossutti, G. Della Ricca, S. Dittongo, S. Grancagnolo, L. Lanceri, L. Vitale
Università di Trieste, Dipartimento di Fisica and INFN, I-34127 Trieste, Italy
F. Martinez-Vidal
IFIC, Universitat de Valencia-CSIC, E-46071 Valencia, Spain
R. S. Panvini333Deceased
Vanderbilt University, Nashville, Tennessee 37235, USA
Sw. Banerjee, B. Bhuyan, C. M. Brown, D. Fortin, K. Hamano, R. Kowalewski, J. M. Roney, R. J. Sobie
University of Victoria, Victoria, British Columbia, Canada V8W 3P6
J. J. Back, P. F. Harrison, T. E. Latham, G. B. Mohanty
Department of Physics, University of Warwick, Coventry CV4 7AL, United Kingdom
H. R. Band, X. Chen, B. Cheng, S. Dasu, M. Datta, A. M. Eichenbaum, K. T. Flood, M. Graham, J. J. Hollar, J. R. Johnson, P. E. Kutter, H. Li, R. Liu, B. Mellado, A. Mihalyi, Y. Pan, R. Prepost, P. Tan, J. H. von Wimmersperg-Toeller, S. L. Wu, Z. Yu
University of Wisconsin, Madison, Wisconsin 53706, USA
H. Neal
Yale University, New Haven, Connecticut 06511, USA
1 Introduction
In the Standard Model the radiative decay proceeds via a loop diagram, and is sensitive to possible new physics, with new heavy particles participating in the loop [1]. Next-to-leading-order calculations for the branching fraction give () [2], where is the photon energy in the rest frame; calculations to higher order are currently underway [3]. Measurement of the spectrum from decays, and in particular of its moments above various minimum energies, allows the determination of the heavy quark effective field theory parameters and , related to the -quark mass and momentum within the meson, respectively [4, 5, 6, 7].
This note reports on a fully inclusive analysis of data collected from , where the photon from the decay of one meson is detected, but the system is not reconstructed. Previous fully-inclusive measurements of have been presented by the CLEO [8] and BELLE [9] collaborations. The alternative approach of summing a number of exclusive decays [10] is more dependent on the fragmentation model, and in particular on assumptions made as to the fraction of unmeasured final states. In the fully-inclusive measurement we largely avoid such uncertainties, but at the cost of higher backgrounds, which need to be strongly suppressed. Much of the non- (continuum) background is removed by requiring a high-momentum lepton tag; this selects events in which the non-signal meson decays semileptonically. Continuum background is further suppressed by topological cuts. Remaining continuum background is subtracted using off-resonance data recorded at an center-of-mass (c.m.) energy just below that of the . Backgrounds from events are estimated from a Monte Carlo simulation; for the most important backgrounds the simulation is checked and corrected using data control samples.
We present preliminary results of this analysis, in particular the partial branching fraction and the first and centralized second moments of the photon energy distribution ( and , respectively) for each of four minimum- cuts in the rest frame: 1.9, 2.0, 2.1 and 2.2. Hereafter we refer to the centralized second moment as the “second moment”. These are obtained from the corresponding quantities for reconstructed photon energy in the frame (an asterisk denotes a a quantity) by applying corrections for resolution smearing and the effect of imposing an experimental cut on rather than . The full correlation matrix between the first and second moments is given to facilitate fitting to any parameterized theoretical calculation. The measurement does not distinguish events from events. We assume the ratio of to is , so that it constitutes of the rate [8], and correct for this at the end. This assumption is supported by newer theoretical calculations [11, 12]. We also present a measurement of the asymmetry in the sum of plus , based on the charge of the tagging lepton. Pending a more detailed study of the energy spectrum, we do not yet perform the model-dependent extrapolation to the entire photon spectrum.
The results presented are based on data recorded with the BABAR detector [13] at the PEP-II asymmetric-energy collider located at the Stanford Linear Accelerator Center. The on-resonance data integrated luminosity is 81.5, corresponding to 88.5 million events. Additionally, 9.6 of off-resonance data are used in the continuum background subtraction. The BABAR Monte Carlo simulation program, based on GEANT 4 [14] and JETSET [15], is used to generate samples of signal events, and (excluding signal channels), ( continuum) and . In order to minimize any possible experimenter’s bias, the spectrum of reconstructed photon energy from 1.9 to 2.9 in the on-resonance data was “blinded”, i.e., not looked at until all selection cuts were set and dominant corrections determined.
2 Signal Model and Backgrounds
In order to compute signal () efficiency, we use the spectrum computed by Kagan and Neubert (KN) [4]. This quantity has a one-to-one correspondence with the photon energy in the -meson rest frame via the kinematic relation
| (1) |
The KN spectrum is a smooth function of , i.e., it does not explicitly model strange resonances in the mass spectrum. This assumption is not valid for the decay , so the spectrum needs to be modified to describe it. Higher-mass resonances are broad and spaced closely enough, such that the smooth approximation of the KN treatment is justified. In practice, a relativistic Breit-Wigner distribution modeling the decay is used for and the KN spectrum is used above the cutoff. The part is normalized to the fraction of the KN spectrum below the cutoff. The KN model is parameterized in terms of two quantities, (the -quark mass) and (a measure of the quark’s Fermi momentum inside the meson). We chose a KN480 model, with and GeV2, for studying systematic effects on signal efficiency and for optimizing selection criteria. For the latter purpose, an overall normalization was applied such that the component matches the previous BABAR measurement [16]. In order to assess possible model-dependence of our results we use additional KN models with between 4.55 and 4.80, along with a set of models based on the theory of ref. [5].
Backgrounds arise from continuum (, where , and ) and events. There are additional contributions from QED and hadronic two-photon processes, which are not simulated. In events, the main backgrounds come from decays of and mesons, with a smaller contribution from hadrons (mostly antineutrons) that are misidentified as photons. In continuum events, these backgrounds also contribute, along with initial state radiation (ISR), where a high-energy photon is radiated from one of the colliding .
3 Event Selection
The BABAR detector [13] tracks charged particles with a five-layer double-sided silicon-strip detector and a forty-layer drift chamber placed inside a 1.5 T solenoidal magnet. Electromagnetic showers are detected in a total-absorbtion calorimeter consisting of 6580 CsI(Tl) scintillating crystals arranged hermetically in a projective geometry. Muons are indentified by resistive-plate chambers interleaved in the flux-return yoke of the magnet, outside of the calorimeter
The distinctive feature of the signal decays is an isolated photon with energy from about 1.6 to 2.8. Our starting point is finding in the event at least one isolated photon candidate, i.e., a localized calorimeter energy deposit, with (“photon acceptance”). We then apply several categories of selection cuts, described in the next few paragraphs: hadronic event selection, photon quality criteria, event shape cuts and tagging requirements. Table 1 shows the efficiencies of the different categories of cuts for signal and background event samples. In order to avoid regions where the expected signal would still be overwhelmed by background (especially background at low ), our results will be quoted for several minimum- cuts of 1.9 or above. The table illustrates the efficiencies for one particular choice.
Hadronic events are selected by requiring at least three reconstructed charged tracks and the second Fox-Wolfram moment , calculated in the frame using all detected particles. To reduce QED and two-photon backgrounds, we use a cut on “effective multiplicity,” defined as the number of charged tracks plus half the number of photons with energy above 0.08. We require , a value that has essentially no impact on signal efficiency.
Photon quality cuts are designed to suppress high-energy photon candidates which arise from backgrounds. We require that the polar angle of the photon satisfy , to ensure that the photon shower is well contained in the calorimeter. We suppress hadronic showers and s with merged photon showers by requiring that the shower has a lateral profile consistent with a single photon. Photons that are consistent with originating from an identifiable or decay are explicitly vetoed. The optimal veto requirements are energy-dependent, with a more open selection for . Finally, isolated photons are selected by requiring that no energy (neutral or charged) be within 25 cm (approximately seven times the radius for ) of the photon, as measured at on the calorimeter’s inside surface.
Event shape variables are employed to exploit the difference in topology of events and continuum events. The former tend to be spherical in shape, since the B mesons are produced nearly at rest in the rest frame, while continuum events tend to have a more jet-like structure. We combine 19 different variables into a single Fisher discriminant. Eighteen of the quantities are the sum of charged and neutral energy found in 10-degree cones (from 0 to 180 degrees) centered on the photon candidate direction. The photon energy is not included in any of the cones. The nineteenth variable is the quantity , where is the second Fox-Wolfram moment calculated in the frame recoiling against the photon (which for ISR events is the rest frame), using all particles except the photon. The Fisher coefficients were determined by maximizing the separation power between simulated signal and continuum events. Cuts on the Fisher variable and remove 84% of the remaining continuum background at this stage.
Lepton tagging is used to further reduce the backgrounds from continuum events. About 20% of mesons decay semileptonically to either or , and the large mass of the meson tends to impart large momentum to its lepton daughter. Leptons from fragmentation in continuum events tend to be at lower momentum. Since the tag lepton comes from the recoil meson, it does not compromise the inclusiveness of the selection. Electrons are identified by requiring a well-measured track matched to an energy deposit in the calorimeter consistent with an electromagnetic shower. Muons are identified by matching a well-measured track to hits in the muon detector, with no more than a minimum-ionizing energy deposit in the calorimeter. The tag lepton is required to have momentum greater than 1.25 for electrons and 1.5 for muons. Furthermore, making a cut on the angle between the photon and the lepton, , removes more continuum background, in which the lepton and photon candidates tend to be back-to-back. Finally, we exploit the presence of a relatively high-energy neutrino in semileptonic decays and place a cut on the missing energy in the event in the frame, .
Virtually all of the tagging leptons arise from the decay . We correct the rate of such events in our simulation based on the studies presented in Ref. [17]. The overall rate of is comprised of four decay modes, where the hadronic system is , , (higher mass resonances), and non-resonant , respectively. A scale factor was determined for each mode and we have weighted our simulated semileptonic decays accordingly. We also reweight the simulated form factors of the decay to those measured by BABAR[18].
| Photon acceptance | 0.782 | 0.023 | 0.124 |
|---|---|---|---|
| Hadronic | 0.937 | 0.979 | 0.826 |
| Photon quality | 0.753 | 0.175 | 0.196 |
| 0.910 | 0.114 | 0.326 | |
| Event shape | 0.601 | 0.401 | 0.167 |
| Tagging | 0.052 | 0.041 | |
| Total selection |
The values for many of the cuts described above, along with the Fisher coefficients, were optimized with all other cuts applied, using an iterative technique. In each case, the quantity maximized was , where is the expected signal from the KN480 model described above, is the simulated background, and is the simulated continuum background, each being the number of events expected for the on-resonance data luminosity, and is the ratio of total to off-resonance luminosity. The factor takes into account the fact that we later use off-resonance data to subtract the residual continuum background.
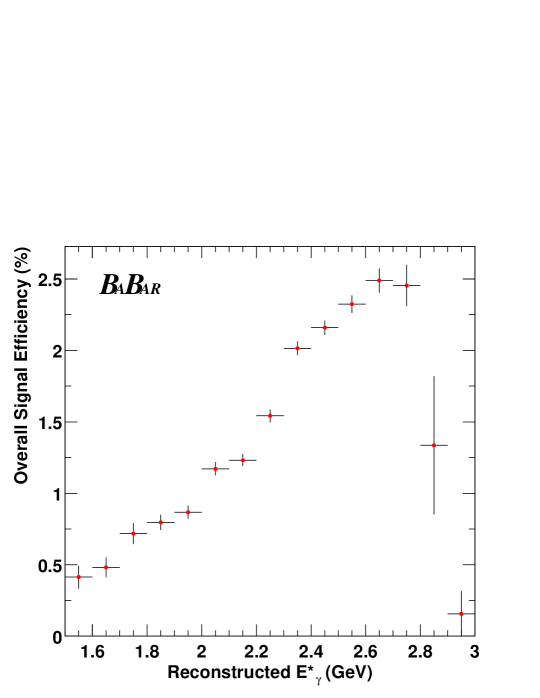
Figure 1 shows the overall signal efficiency in bins of . The dependence is a result of the optimization procedure, in particular the training of the Fisher discriminant. The sum of the 18 energy-flow variables combined in the Fisher discriminant is correlated with the energy of the photon in the rest frame. Without the Fisher selection the continuum background decreases by a factor of two over the 2.0 to 2.7 range of used for optimization, while the expected signal increases rapidly betewen 2.0 and about 2.4. Therefore, the optimization suppresses background more strongly with decreasing , leading to a corresponding reduction of the efficiency. The more stringent vetoes applied in events with also contribute to the energy dependence. The variation of the efficiency with does not introduce a significant dependence on the multiplicity of the system, which would lead to uncertainties related to fragmentation modeling. However, the variation of the efficiency with does lead to a dependence on the modeling of the photon energy spectrum. The dominant effect is that reducing the assumed value of in a particular model leads to reduction in the mean , which in turn yields a smaller selection efficiency. We improve the estimation of the signal efficiency and reduce the model-dependent uncertainty with a bootstrapping procedure described in section 5.1.
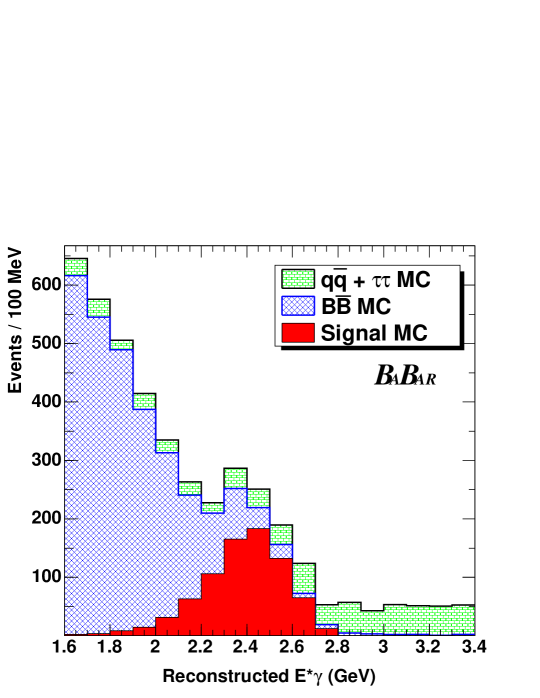
The simulated distribution of signal, continuum and background events after all selection criteria is shown in Fig. 2. Note that the continuum Monte-Carlo does not include QED backgrounds present in the data. The actual continuum background is subtracted using the off-resonance data and is the dominant source of statistical uncertainty on the measurements.
4 Backgrounds
As can be seen in Figure 2, the background dominates for . We present in Table 2 the various sources of background coming from events, as predicted by our Monte Carlo simulation.
| Fraction of background | ||
| Truth-match | Parentage | () |
| Photon | 0.640 | |
| 0.174 | ||
| 0.024 | ||
| 0.011 | ||
| FSR | 0.007 | |
| 0.008 | ||
| Other | 0.001 | |
| Total | 0.865 | |
| (merged) | Any | 0.001 |
| Electron | Any | 0.036 |
| () | Any | 0.077 |
| () | Any | 0.005 |
| Any | 0.001 | |
| or | Any | 0.001 |
| Unidentified | 0.015 |
About 80% of the background comes from photons from decays, for both the nominal signal region () and a control region (). Other significant sources are hadrons in the signal region (%) and electrons in the control region (%). We have performed dedicated studies of data control samples for these sources, to verify and/or correct the Monte Carlo predictions.
The level of the largest background component, decays, has been measured directly from the data. We explicitly measure the yield of and decays in bins of or in on-resonance data, off-resonance data and simulation samples, by fitting the mass distributions. This allows us to derive correction factors versus energy for the rates predicted by the simulation. These corrections are then applied to our simulation when estimating the background passing the selection. The analysis uses the same selection criteria as for the analysis, with three exceptions: 1) the vetoes are not applied, 2) the requirement on the photon energy is reduced to to increase statistics, and 3) the tagging momentum cuts are loosened to 1.0 for electrons and 1.1 for muons, again to increase the available statistics. We apply an additional small correction to account for differences in the performance of the veto in data and simulation.
The background from hadrons faking photons in events consists primarily of s with a small contribution from s. We have corrected the simulation for both the production and response in the calorimeter. First, an inclusive measurement of and production, is used to correct the simulation prediction for both and production. A conservative 50% systematic uncertainty is assigned to account for the fact that we are using a measurement to correct production. Additionally, decays are studied both in real data and simulation to compare the response of the calorimeter to s. We find a significantly smaller number passing the and lateral-shower-profile cuts in the data than that expected from the simulation. The total correction factor, then, is a product of the production correction and the efficiency correction, determined in bins of .
Electrons can cause a background to the photon sample if the charged track is not reconstructed or matched to the electromagnetic shower. (Bremsstrahlung photons are an additional source of background from , which is well modeled in the simulation.) The electron tracking efficiency was measured in data by selecting one track of a Bhabha event and then measuring the probability of reconstructing the other electron track. A further correction is made to account for the fact that the environment of the control sample (Bhabha events) has significantly lower multiplicity on average than the actual data sample (hadronic events).
We have also derived corrections for the very small number of background photons from and decays. The corrections to the modeling of described in section 3 are applied to the simulation. After all corrections, we check our estimate of the background by considering the low energy control region , where we expect few photons from decays. In this region we observe events after continuum subtraction compared to an expection of events, i.e.
| (2) |
The significance of the deviation is . Note that for this check we have not subtracted any signal contribution, which for the KN480 and KN465 models defined above would be approximately 17 and 39 events, respectively. These would reduce the significance of the deviation to and , respectively.
5 Results
5.1 Partial Branching Fractions
| (GeV) | Tagged Signal Yield (events) |
|---|---|
| 1.9 to 2.7 | |
| 2.0 to 2.7 | |
| 2.1 to 2.7 | |
| 2.2 to 2.7 |
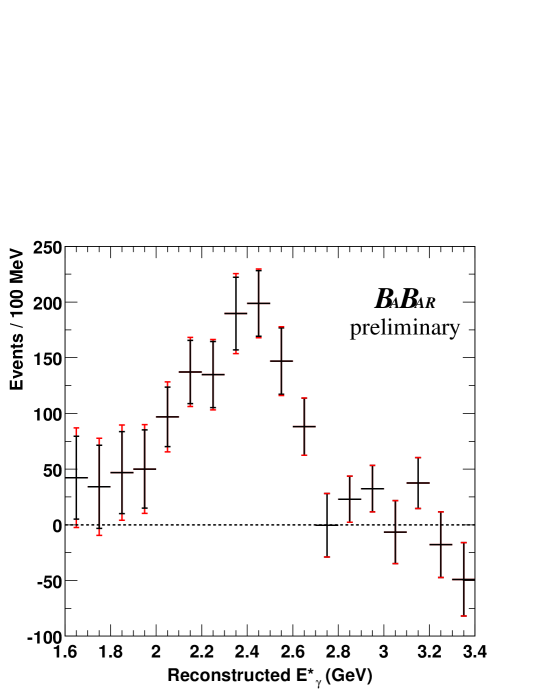
The extracted signal yield, i.e., the on-resonance yield minus the sum of the scaled off-resonance yield and the corrected simulation prediction, is given in Table 3 for each of four different energy ranges. The corresponding raw photon energy spectrum, uncorrected for efficiency, is shown in Figure 3. The region serves as a control region for the continuum subtraction. In this region we observe events compared to an expectation from off-resonance data of events; a difference of events.
The model-dependence of the efficiency can be reduced by a bootstrapping method, whereby we initially assume a model (e.g., KN465) and use it to calculate the mean of the efficiency-corrected energy spectrum between 2.0 and 2.7. This is compared to the corresponding mean predicted by several KN models with different values of . An iterative procedure is used to determine which model best matches the measured mean and to then assign a model-dependent uncertainty to the efficiency corresponding to the uncertainty on the measurement of the mean. The relation between efficiency and mean energy is approximately linear, with a best match close to a KN460 model (with ). We have carried out the same studies for twelve different parameterizations of the Benson, Bigi and Uraltsev (BBU) [5] calculation, using the same prescription to include a component as for KN. We varied between 4.45 and 4.75 and between 0.25 and . (Note that these two parameters are defined differently than their KN counterparts.) We set (the matrix element of the chromomagnetic operator, responsible for the hyperfine splitting between and mesons) to either 0.35 or . All the BBU results for the signal efficiency versus mean energy lie on the same line as for the KN model, confirming the model-independence of the bootstrapping procedure. Thus the KN460 efficiency is used to determine the partial branching fractions (PBFs) according to:
| (3) |
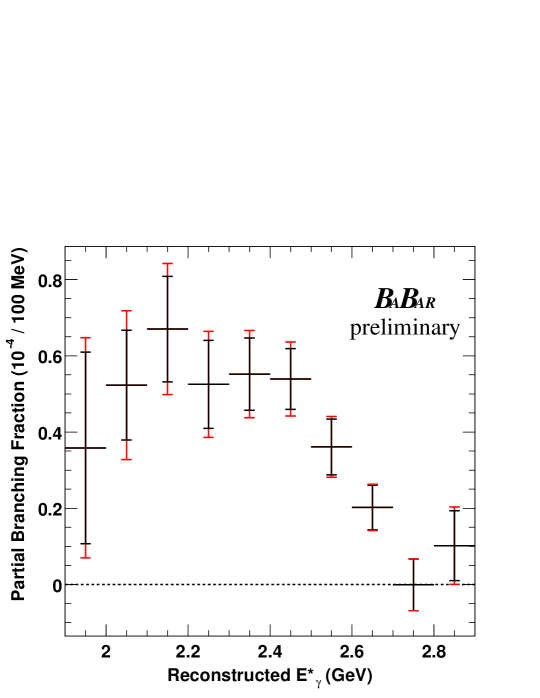
Figure 4 shows the efficiency-corrected spectrum using the KN460 model. We have taken a conservative approach of assigning to each bin a model-dependence uncertainty corresponding to the maximum efficiency deviation, among KN455 to KN480 models and the 12 BBU models, from the KN460 value. Note that these models span a range of mean energy up to away from our mesured value.
To make the results directly comparable to theoretical predictions, we correct for the fact that the cut in photon energy is made on reconstructed in the () frame rather than on true in the rest frame. The latter energy has been smeared by a Doppler shift and by the (asymmetric) calorimeter resolution. (Doppler smearing arises from the Lorentz transformation from the rest frame to the frame, given our ignorance of the direction of the .) We compute the correction factor for the KN and BBU models and find that it has minimal model-dependence. Table 4 shows PBFs with corrections applied, along with the statistical, systematic and model-dependent errors. For the corrected PBFs the latter includes two correlated contributions: the model-dependent efficiency uncertainty noted above, already applied to the measured PBFs, and the uncertainty on .
We studied many sources of systematic uncertainty, and here note the more significant. The uncertainty on the background subtraction is shown in Table 3, and amounts to 5.5% for 2.0 to 2.7. It comes mostly from the statistical uncertainties on the correction factors derived from the control sample. Other systematic effects total 6.4% in quadrature. Of this, 3.3% is the uncertainty on photon selection, dominated by a 2.5% uncertainty on photon efficiency (determined from s in decays) and 2% for the photon isolation cut. It also includes allowance for uncertainties in photon energy scale and resolution, and in the photon lateral shape cut efficiency, derived mainly from data from the BABAR analysis and photons from virtual Compton scattering. The efficiency of the event shape cuts was studied using a control sample to compare distributions of the Fisher discriminant between data and simulation, resulting in an uncertainty of 3.0%. A small sensitivity to details of fragmentation implies, for the adjustments determined in the BABAR semi-inclusive analysis, an additional uncertainty of only 1.4%. A 2.2% uncertainty is assigned for lepton identification, and 3.0% for the uncertainties on the semileptonic corrections.
| E range | Measured PBF () | Corrected PBF () | ||
|---|---|---|---|---|
| GeV | for reco range, frame | for true range, frame | ||
| 1.9 to 2.7 | ||||
| 2.0 to 2.7 | ||||
| 2.1 to 2.7 | ||||
| 2.2 to 2.7 |
5.2 Truncated Moments
As noted above, the truncated moments of the photon energy spectrum are of interest because they can be related to parameters of heavy quark theory. The measured first moment and second moment are computed by averaging over the efficiency-corrected photon energy spectrum in 100 bins. We do this for four different energy ranges, extending from 1.9, 2.0, 2.1 or 2.2 to 2.7. The bin-by-bin efficiencies derived from the KN460 model are used to correct the yields.
The observed moments are derived from the measured spectrum but the moments computed in theoretical calculations involve the true . Thus we need to correct the former for Doppler and calorimeter-resolution smearing. For a spectrum without energy cuts, the total shift of the first (second) moment is the sum of the first (second) moments of the smearing functions, about for Doppler smearing plus ) for the calorimeter. The latter corrections are reduced when the spectrum is truncated by a minimum energy cut, e.g., to for a typical BBU model () with a cut of 2.0. An additional small shift accounts for cutting on the reconstructed in the frame instead of on the true in the rest frame. For a given signal model, Monte Carlo simulation provides the total shift needed to obtain the first moment from the measured first moment for the same numerical cut value; likewise for the second moment.
| range | |||
|---|---|---|---|
| GeV | (with cut on ) | (with cut on ) | |
| 1.9 to 2.7 | |||
| 2.0 to 2.7 | |||
| 2.1 to 2.7 | |||
| 2.2 to 2.7 |
| range | |||
|---|---|---|---|
| GeV | (with cut on ) | (with cut on ) | |
| 1.9 to 2.7 | |||
| 2.0 to 2.7 | |||
| 2.1 to 2.7 | |||
| 2.2 to 2.7 |
Tables 5 and 6 show the observed and corrected first and second moment values for four different minimum photon energy cuts. Using 50 bins instead of 100 bins changes the first moment by less than 0.003 (0.001) and the second moment by less than for the 1.9 cut (other cuts). The dominant systematic uncertainty arises from the background subtraction. In addition the uncertainty in the photon energy scale and the modeling of photon energy resolution cause smaller systematic errors in the first and second moments, respectively. The model-dependent uncertainty on the first moment is based on redoing the computation using the efficiency for each KN or BBU model that matches the nominal first moment within its uncertainties. The second moment is sensitive to the modeling of the low-energy tail of the photon energy resolution but not to the efficiency model or to the uncertainty in the photon energy scale. A systematic uncertainty for the photon energy resolution is determined by comparing the asymmetric photon resolution function measured using a sample of events from virtual Compton scattering (in which the true photon energy can be determined by a kinematic constraint) with the corresponding function for simulated events. The uncertainty varies from for to for and is added in quadrature to the systematic uncertainty arising from the background systematic. We compute the corrections applied to the moments for the full range of KN and BBU models considered, in order to better represent possible model-dependence. The tabulated is the average value of the maximum and minimum corrections for these models, and its uncertainty is taken to be half the value of the difference between the maximum and minimum. The model-dependent uncertainties on and are correlated, and hence added linearly.
Finally Tables 7 through 9 show the full correlation matrices between the eight measured moments for statistical, systematic, and model dependence errors, respectively. Statistical and systematic covariance matrices are computed using standard error propagation, starting from the measured spectrum in energy bins. For systematics, this incorporates the bin-to-bin covariance matrix that arises from the subtraction, with the fully-correlated covariance matrices arising from the energy-scale uncertainty (first moments only) and calorimeter resolution (second moments only) added at the end.
The model correlations take into account the variation of both the efficiency and the corrections among different models. For each of the models (indexed ) and each of the eight measured first and second moments we define as the actual correction for that model. We also define as the computed value of the first or second moment using a particular model minus its value using efficiencies from the nominal KN460 model. Letting
we compute the covariance of between each pair of moments by averaging over the models, and thence derive the correlation matrix. Note that this approach, which treats the predictions of the different models as a statistical distribution, would yield smaller model-dependence errors than the ones we quote in Tables 5 and 6; but we use this result solely for the correlation matrix, not for the errors themselves.
| M | M | M | M | V | V | V | V | ||
|---|---|---|---|---|---|---|---|---|---|
| Quantity | Min. | 1.9 | 2.0 | 2.1 | 2.2 | 1.9 | 2.0 | 2.1 | 2.2 |
| Mean | 1.0000 | 0.5172 | 0.3548 | 0.2265 | -0.6110 | 0.0077 | 0.0821 | 0.1008 | |
| Mean | 1.0000 | 0.6838 | 0.4326 | 0.2285 | -0.0008 | 0.1375 | 0.1645 | ||
| Mean | 1.0000 | 0.6260 | 0.4220 | 0.5660 | 0.1650 | 0.1884 | |||
| Mean | 1.0000 | 0.4528 | 0.7568 | 0.7383 | 0.2113 | ||||
| Variance | 1.0000 | 0.4626 | 0.3486 | 0.2520 | |||||
| Variance | 1.0000 | 0.6966 | 0.4887 | ||||||
| Variance | 1.0000 | 0.6709 | |||||||
| Variance | 1.0000 |
| M | M | M | M | V | V | V | V | ||
|---|---|---|---|---|---|---|---|---|---|
| Quantity | Min. | 1.9 | 2.0 | 2.1 | 2.2 | 1.9 | 2.0 | 2.1 | 2.2 |
| Mean | 1.0000 | 0.7841 | 0.6076 | 0.4622 | -0.7552 | -0.3862 | -0.1723 | -0.0942 | |
| Mean | 1.0000 | 0.8007 | 0.6311 | -0.2515 | -0.4753 | -0.2298 | -0.1451 | ||
| Mean | 1.0000 | 0.7886 | -0.0320 | 0.0202 | -0.2903 | -0.2115 | |||
| Mean | 1.0000 | 0.0489 | 0.1850 | 0.2061 | -0.1001 | ||||
| Variance | 1.0000 | 0.4473 | 0.2219 | 0.1436 | |||||
| Variance | 1.0000 | 0.5003 | 0.3342 | ||||||
| Variance | 1.0000 | 0.6592 | |||||||
| Variance | 1.0000 |
| M | M | M | M | V | V | V | V | ||
|---|---|---|---|---|---|---|---|---|---|
| Quantity | Min. | 1.9 | 2.0 | 2.1 | 2.2 | 1.9 | 2.0 | 2.1 | 2.2 |
| Mean | 1.0000 | 0.9267 | 0.9486 | 0.8252 | -0.9057 | -0.9223 | -0.9234 | -0.7983 | |
| Mean | 1.0000 | 0.9576 | 0.8669 | -0.7452 | -0.8183 | -0.8087 | -0.8960 | ||
| Mean | 1.0000 | 0.9540 | -0.7390 | -0.7889 | -0.7843 | -0.7752 | |||
| Mean | 1.0000 | -0.5378 | -0.5857 | -0.5788 | -0.6023 | ||||
| Variance | 1.0000 | 0.9650 | 0.9824 | 0.6983 | |||||
| Variance | 1.0000 | 0.9810 | 0.8035 | ||||||
| Variance | 1.0000 | 0.8057 | |||||||
| Variance | 1.0000 |
The correlation matrices allow a fit of the moments to any parameterized theoretical calculation. However we note that of the eight moments only five are independent. One way to see this is by considering that there are two moments for the highest energy cut () and all the other moments can be derived by adding the three lower energy bins. Thus in fitting one must choose no more than five of the moments and check that the associated covariance matrices are positive definite.
5.3 Asymmetry
Within the Standard Model the combined direct asymmetry for and decays,
| (4) |
is zero to a very good approximation [19]. New physics models with additional flavour violation can significantly enhance to a few percent [11]. Furthermore, measurements of the combined in and processes complement those of in only [20, 16, 21] to constrain new physics models.
The use of lepton tagging on the non-signal for continuum suppression allows a straightforward determination of . The lepton’s positive (negative) charge tags the signal side to contain a quark. Therefore
| (5) |
where are the positive (negative) tagged signal yields and is the dilution factor due to the mistag rate, .
The systematic uncertainty on the background subtraction only contributes a multiplicative uncertainty to the measured . Therefore, the statistical uncertainty dominates and we find the optimal range for the measurement to be . The tagged signal yields are and where the uncertainties are statistical. We use control samples of and to estimate the bias on from any charge asymmetry in the detector or in the background. The bias is , which is applied to the measured asymmetry. The uncertainty on the measurement of the bias is taken as an additive systematic uncertainty on the measured asymmetry. The measured asymmetry, uncorrected for dilution, is , where the first uncertainty is statistical and the second systematic.
The mistag rate is . It is dominated by mixing in events, which when averaged over and events is equal to half the time-averaged mixing rate [22]. The remaining is estimated from simulation; these mistags are due to leptons from decay, faking , conversions, Dalitz decay, and charmonium decay. The error is dominated by uncertainties in the modeling of decay and fakes. The dilution factor of scales the measured and its additive uncertainties to give
| (6) |
The systematic uncertainty includes a 5.4% multiplicative uncertainty from the background subtraction and 1.0% multiplicative uncertainty from the dilution factor. We have estimated that any model dependent uncertainty, due to differences in the and spectra, is much smaller than the systematic uncertainty.
6 Conclusions
We have performed a lepton-tagged fully-inclusive measurement of decays. We present a reconstructed photon energy spectrum in the frame, and partial branching fractions above minimum reconstructed energies of 1.9, 2.0, 2.1 and 2.2 GeV (Table 4). We also present the partial branching fractions, the first and second moments of the true photon energy distribution in the rest frame and the correlations between the first and second moments, above the same minimum photon energies (tables 4, 5, 6, 7, 8 and 9). Finally, we have used the charge of the tagging leptons to obtain the asymmetry of the sum of plus with reconstructed photon energy above 2.2.
We are grateful for the extraordinary contributions of our PEP-II colleagues in achieving the excellent luminosity and machine conditions that have made this work possible. The success of this project also relies critically on the expertise and dedication of the computing organizations that support BABAR. The collaborating institutions wish to thank SLAC for its support and the kind hospitality extended to them. This work is supported by the US Department of Energy and National Science Foundation, the Natural Sciences and Engineering Research Council (Canada), Institute of High Energy Physics (China), the Commissariat à l’Energie Atomique and Institut National de Physique Nucléaire et de Physique des Particules (France), the Bundesministerium für Bildung und Forschung and Deutsche Forschungsgemeinschaft (Germany), the Istituto Nazionale di Fisica Nucleare (Italy), the Foundation for Fundamental Research on Matter (The Netherlands), the Research Council of Norway, the Ministry of Science and Technology of the Russian Federation, and the Particle Physics and Astronomy Research Council (United Kingdom). Individuals have received support from CONACyT (Mexico), the A. P. Sloan Foundation, the Research Corporation, and the Alexander von Humboldt Foundation.
References
- [1] B. Grinstein and M.B. Wise, Phys. Lett. B 201, 274 (1988); W.S. Hou and R.S. Willey, Phys. Lett. B 202, 591 (1988); J.L. Hewett and J.D. Wells, Phys. Rev. D 55, 5549 (1997); T. Hurth, Rev. Mod. Phys. 75, 1159 (2003).
- [2] P. Gambino and M. Misiak, Nucl. Phys. B 611, 338 (2001); A.J. Buras, A. Czarnecki, M. Misiak and J. Urban, Nucl. Phys. B 631, 219 (2002).
- [3] M. Misiak and M. Steinhauser, Nucl. Phys. B 683, 277 (2004).
- [4] A.L. Kagan and M. Neubert, Eur. Phys. J. C 7, 5 (1999).
- [5] D. Benson, I.I. Bigi and N. Uraltsev, Nucl. Phys. B 710, 371 (2005).
- [6] M. Neubert, Eur. Phys. J. C 40, 165 (2005).
- [7] B. Lange, M. Neubert and G. Paz, hep-ph/0504071.
- [8] CLEO Collaboration, S. Chen et al., Phys. Rev. Lett. 87, 251807 (2001).
- [9] BELLE Collaboration, P. Koppenburg et al., Phys. Rev. Lett. 93, 061803 (2004).
- [10] BABAR Collaboration, B. Aubert et al., contributed to the Intl. Conf. on High Energy Physics, ICHEP-02, hep-ex/0207074.
- [11] T. Hurth, E. Lunghi and W. Porod, Nucl. Phys. B 704, 56 (2005).
- [12] H.M. Asatrian, H.H. Asatryan and A. Hovhannisyan, Phys. Lett. B 585, 263 (2004).
- [13] BABAR Collaboration, B. Aubert et al., Nucl. Instrum. Methods A 479, 1 (2002).
- [14] GEANT4 Collaboration, D. Agostinelli et al., Nucl. Instrum. Methods A 506, 250 (2003).
- [15] ‘PYTHIA 5.7 and JETSET 7.4: Physics and manual’, by Torbjörn Sjöstrand (Lund U.), hep-ph/9508391.
- [16] BABAR Collaboration, B. Aubert et al., Phys. Rev. D 70, 112006 (2004).
- [17] BABAR Collaboration, B. Aubert et al., contributed to the Intl. Conf. on High Energy Physics, ICHEP-04, hep-ex/0408075.
- [18] BABAR Collaboration, B. Aubert et al., contributed to the Intl. Conf. on High Energy Physics, ICHEP-04, hep-ex/0409047.
- [19] J.M. Soares, Nucl. Phys. B 367, 575 (1991), T. Hurth and T. Manuel, Phys. Lett. B 511, 196 (2001).
- [20] BABAR Collaboration, B. Aubert et al., Phys. Rev. Lett. 93, 021804 (2004).
- [21] BELLE collaboration, S. Nishida et al., Phys. Rev. Lett. 93, 031803 (2004).
- [22] Particle Data Group, S. Eidelman et al., Phys. Lett. B 592, 1 (2004).