Physics of Heavy Flavour at CDF
Abstract
Results on physics of heavy flavour at CDF are reported. Selected measurements of Branching Ratios and CP asymmetry in and , lifetime difference of CP eigenstates and a precise measurement of the mass are presented.
1 Introduction
The upgraded Collider Detector at Fermilab (CDF II)[1] has collected around between February 2002 and February 2005 during the Tevatron Run II at Fermilab. At colliders a large amount of and mesons and baryons are produces within a background of hadronic particles. However the presence of heavy flavour particle’s decays can be detected by the presence of a displaced secondary vertex, because of these particles have long decay length (O()). The issue is to be able to extract this information at trigger level. For this purpose CDF uses the Silicon Vertex Trigger (SVT)[2] that reconstruct online the tracks providing the informations needed for the trigger decision. In this way CDF is able to efficiently select events in which the heavy meson decays in either leptonic or fully hadronic modes. The collected data samples allow to perform a wide range of measurements, from the observation of rare decays to lifetime measurement, through BR and asymmetry measurements. In the following we concentrate on some selected topics.
2 Branching ratios and CP asymmetries measurements
Fully hadronic meson decays are very useful to understand the sector of the CKM matrix. CDF is providing interesting measurement both on two body charmless and on pure penguins decays.
2.1 Two body charmless decays ()
These decays are the ones in which a , meson goes into charged Pions and Kaons. The theoretical prediction on their BR and CP asymmetries are strongly affected by uncertainties on hadronic contributes. These unknowns can be removed by combining the informations obtained in the different modes[3, 5].
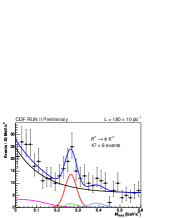
The mass resolution at CDF is not enough to directly observe the different signals, but their yields can be extracted via an unbinned likelihood fit that exploit both kinematic and energy loss information. The overall yield is shown in the left plot in Fig.1. The result of the fit is shown in the right plot of Fig.1. In we observe , and . We measured the ratio: . We set also the limits on the BRs of rare decays as: and both at . We also measure the CP asymmetry in the decay and we obtain .
2.2 Pure penguin decays
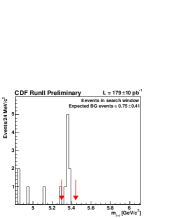
B meson decays involving transitions can provide evidences of deviation from the SM[4]. In particular direct CP asymmetry of mode is expected to be of the order of few percent within the SM[5]. Left plot in Fig. 2 shows the mass distribution containing the signal of this decays obtained at CDF. The number of signal events has been extracted from the background using an unbinned likelihood fit on kinematic the particle’s energy losses. We measured and .
3 Measurement of decay width difference of CP eigenstates
In two vector particles are produced from the decay of a pseudo scalar one. It is indeed possible to distinguish the two CP eigenstates by the relative angular distribution of the decay’s products.
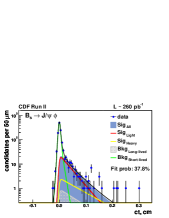
Actually three linear amplitudes are possible corresponding to angular momenta 0,1 and 2. The even/odd values of angular momentum occur for CP even/odd eigenstate. We simultaneously fit the lifetime and the linear amplitudes. The plot in Fig. 3 shows the projections of the fit result on the lifetime. The yellow line is the lifetime of the heavy mass eigenstate while the lifetime of the light one is reported in red. We found [7].
4 Spectroscopy
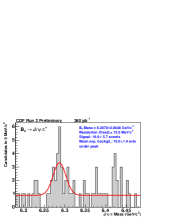
In the field of spectroscopy the measurement of the mass is important to validate the theoretical models that predict this quantity [8]. This meson has been observed at D0[9] and CDF[10] in semileptonic modes. Because in this kind of decays the events are not fully reconstructed the achieved mass resolution was not enough to constrain the theoretical predictions. We look for evidence of the fully reconstructed decay in the mass range between and corresponding to window around the previously measured value.
We optimize the selections following a blind procedure. The plot in Fig. 4 show the mass distribution in the signal region after applying the optimized cut. From the fit we measured a signal of events over a background of . The value of the mass we obtain is where the systematic error is mainly given by the parametrization of the background.
5 Conclusions
We have reported some examples of the wide range of heavy flavour particles that can be detected at CDF and how their characteristics can be investigated. This analysis are still statistically limited. However the systematics are well under control and the results will be easily improved by increasing the data samples.
References
- [1] D. Acosta et al., Phys. Rev. D71, 032001 (2005).
- [2] W. Ashmanskas et al., Nucl. Instrum. and Meth., A518, 532 (2004).
- [3] R. Fleisher, Phys. Lett. B459, 306 (1999); M.Gronau and J.L.Rosner, Phys. Lett. B482, 71 (2000); J.f.Sun, G.H.Zhu and D.S.Du Phys. Rev. D68, 054003 (2003); D.London and J.Matias, Phys. Rev. D70, 031502 (2004); Y.Li, C.D.Lu, Z.J.Xiao and X.Q.Yu, Phys. Rev. D70, 034009 (2004)
- [4] A.Raidal, Phys. Rev. Lett. 80,231803(2002); A.Datta et al., arXiv:hep-ph/0406192; submitted to Phys. Rev. D.
- [5] M.Beneke and M.Neubert, Nucl. Phys. B675, 333 (2003);
- [6] D. Acosta et al., arXiv:hep-ex/0502044; submitted to Phys. Rev. Lett.
- [7] D. Acosta et al., Phys. Rev. Lett. 94, 101803 (2005)
- [8] W.Kwong and J.Rosner, Phys. Rev. D44, 212 (1991); E.Eichten and C.Quigg, Phys. Rev. D49, 5845 (1994); S.Godfrey, Phys. Rev. D70, 054017 (2004); N.Branbilla, Y.Sumino and A.Vairo, Phys. Rev. D65, 034001 (2002); I.F.Allison, C.T.H.Davies, A.Gray, A.S.Kronfeld, P.M.Mackenzie, J.N.Simone, arXiv:hep-lat/0411027 and arXiv:hep-lat/0409090
- [9] D0 Collaboration, D0 note 4539-CONF;
- [10] CDF Collaboration, Phys. Rev. Lett. 81, 2432 (1998) and Phys. Rev. D58, 112004 (1998)