Measurement of the cross section for e+epp¯superscript𝑒superscript𝑒𝑝¯𝑝e^{+}e^{-}\rightarrow p\overline{p} at center-of-mass energies from 2.0 to 3.07 GeV

M. Ablikim1, J. Z. Bai1, Y. Ban11, J. G. Bian1, X. Cai1, H. F. Chen16, H. S. Chen1, H. X. Chen1, J. C. Chen1, Jin Chen1, Y. B. Chen1, S. P. Chi2, Y. P. Chu1, X. Z. Cui1, Y. S. Dai18, Z. Y. Deng1, L. Y. Dong1a, Q. F. Dong14, S. X. Du1, Z. Z. Du1, J. Fang1, S. S. Fang2, C. D. Fu1, C. S. Gao1, Y. N. Gao14, S. D. Gu1, Y. T. Gu4, Y. N. Guo1, Y. Q. Guo1, Z. J. Guo15, F. A. Harris15, K. L. He1, M. He12, Y. K. Heng1, H. M. Hu1, T. Hu1, G. S. Huang1b, X. P. Huang1, X. T. Huang12, X. B. Ji1, X. S. Jiang1, J. B. Jiao12, D. P. Jin1, S. Jin1, Yi Jin1, Y. F. Lai1, G. Li2, H. B. Li1, H. H. Li1, J. Li1, R. Y. Li1, S. M. Li1, W. D. Li1, W. G. Li1, X. L. Li8, X. Q. Li10, Y. L. Li4, Y. F. Liang13, H. B. Liao6, C. X. Liu1, F. Liu6, Fang Liu16, H. H. Liu1, H. M. Liu1, J. Liu11, J. B. Liu1, J. P. Liu17, R. G. Liu1, Z. A. Liu1, F. Lu1, G. R. Lu5, H. J. Lu16, J. G. Lu1, C. L. Luo9, F. C. Ma8, H. L. Ma1, L. L. Ma1, Q. M. Ma1, X. B. Ma5, Z. P. Mao1, X. H. Mo1, J. Nie1, S. L. Olsen15, H. P. Peng16, N. D. Qi1, H. Qin9, J. F. Qiu1, Z. Y. Ren1, G. Rong1, L. Y. Shan1, L. Shang1, D. L. Shen1, X. Y. Shen1, H. Y. Sheng1, F. Shi1, X. Shi11c, H. S. Sun1, J. F. Sun1, S. S. Sun1, Y. Z. Sun1, Z. J. Sun1, Z. Q. Tan4, X. Tang1, Y. R. Tian14, G. L. Tong1, G. S. Varner15, D. Y. Wang1, L. Wang1, L. S. Wang1, M. Wang1, P. Wang1, P. L. Wang1, W. F. Wang1d, Y. F. Wang1, Z. Wang1, Z. Y. Wang1, Zhe Wang1, Zheng Wang2, C. L. Wei1, D. H. Wei1, N. Wu1, X. M. Xia1, X. X. Xie1, B. Xin8b, G. F. Xu1, Y. Xu10, M. L. Yan16, F. Yang10, H. X. Yang1, J. Yang16, Y. X. Yang3, M. H. Ye2, Y. X. Ye16, Z. Y. Yi1, G. W. Yu1, C. Z. Yuan1, J. M. Yuan1, Y. Yuan1, S. L. Zang1, Y. Zeng7, Yu Zeng1, B. X. Zhang1, B. Y. Zhang1, C. C. Zhang1, D. H. Zhang1, H. Y. Zhang1, J. W. Zhang1, J. Y. Zhang1, Q. J. Zhang1, X. M. Zhang1, X. Y. Zhang12, Yiyun Zhang13, Z. P. Zhang16, Z. Q. Zhang5, D. X. Zhao1, J. W. Zhao1, M. G. Zhao10, P. P. Zhao1, W. R. Zhao1, Z. G. Zhao1e, H. Q. Zheng11, J. P. Zheng1, Z. P. Zheng1, L. Zhou1, N. F. Zhou1, K. J. Zhu1, Q. M. Zhu1, Y. C. Zhu1, Y. S. Zhu1, Yingchun Zhu1f, Z. A. Zhu1, B. A. Zhuang1, X. A. Zhuang1, B. S. Zou1 (BES Collaboration) 1 Institute of High Energy Physics, Beijing 100049, People’s Republic of China
2 China Center for Advanced Science and Technology(CCAST), Beijing 100080, People’s Republic of China
3 Guangxi Normal University, Guilin 541004, People’s Republic of China
4 Guangxi University, Nanning 530004, People’s Republic of China
5 Henan Normal University, Xinxiang 453002, People’s Republic of China
6 Huazhong Normal University, Wuhan 430079, People’s Republic of China
7 Hunan University, Changsha 410082, People’s Republic of China
8 Liaoning University, Shenyang 110036, People’s Republic of China
9 Nanjing Normal University, Nanjing 210097, People’s Republic of China
10 Nankai University, Tianjin 300071, People’s Republic of China
11 Peking University, Beijing 100871, People’s Republic of China
12 Shandong University, Jinan 250100, People’s Republic of China
13 Sichuan University, Chengdu 610064, People’s Republic of China
14 Tsinghua University, Beijing 100084, People’s Republic of China
15 University of Hawaii, Honolulu, HI 96822, USA
16 University of Science and Technology of China, Hefei 230026, People’s Republic of China
17 Wuhan University, Wuhan 430072, People’s Republic of China
18 Zhejiang University, Hangzhou 310028, People’s Republic of China
a Current address: Iowa State University, Ames, IA 50011-3160, USA
b Current address: Purdue University, West Lafayette, IN 47907, USA
c Current address: Cornell University, Ithaca, NY 14853, USA
d Current address: Laboratoire de l’Accélératear Linéaire, Orsay, F-91898, France
e Current address: University of Michigan, Ann Arbor, MI 48109, USA
f Current address: DESY, D-22607, Hamburg, Germany
Abstract

Cross sections for e+epp¯superscript𝑒superscript𝑒𝑝¯𝑝e^{+}e^{-}\rightarrow p\overline{p} have been measured at 10 center-of-mass energies from 2.0 to 3.07 GeV by the BESII experiment at the BEPC, and proton electromagnetic form factors in the time-like region have been determined.

1 Introduction

Positron-electron annihilation produces hadronic final states with an amplitude proportional to

Ae2sjμJμ,similar-to𝐴superscript𝑒2𝑠subscript𝑗𝜇superscript𝐽𝜇A\sim\frac{e^{2}}{s}j_{\mu}J^{\mu}, (1)

where e𝑒e is the charge of the electron, s𝑠s is the square of the center-of-mass energy, jμsubscript𝑗𝜇j_{\mu} is the e+esuperscript𝑒superscript𝑒e^{+}e^{-} current, and Jμsuperscript𝐽𝜇J^{\mu} is the hadronic current for the final state. The object of many experiments is to measure the matrix elements of Jμsuperscript𝐽𝜇J^{\mu}. In e+epp¯superscript𝑒superscript𝑒𝑝¯𝑝e^{+}e^{-}\rightarrow p\bar{p}, a pair of spin-1/2 baryons with internal structure are produced, and the current contains two independent form factors, electric and magnetic, GE(q2)subscript𝐺𝐸superscript𝑞2G_{E}(q^{2}) and GM(q2)subscript𝐺𝑀superscript𝑞2G_{M}(q^{2}) [1].

Understanding nucluon structure is one of the central problems of hadronic physics. In the time-like region, two processes, e+epp¯superscript𝑒superscript𝑒𝑝¯𝑝e^{+}e^{-}\rightarrow p\overline{p} and pp¯e+e𝑝¯𝑝superscript𝑒superscript𝑒p\overline{p}\rightarrow e^{+}e^{-}, are used to measure the proton form factors GE(q2)subscript𝐺𝐸superscript𝑞2G_{E}(q^{2}) and GM(q2)subscript𝐺𝑀superscript𝑞2G_{M}(q^{2}) as functions of the four-momentum transfer q2superscript𝑞2q^{2}. Data samples in previous experiments are limited [2]-[7]. For 6<s<86𝑠86<s<8 GeV2, there is no data up till now.

In this letter, we use the data from the upgraded Beijing Spectrometer (BESII) at the Beijing Electron-Positron Collider (BEPC) covering the center-of-mass energy of 2.0-3.0 GeV in 1999 [8] and the data at 2.2, 2.6, and 3.07 GeV in 2004 to measure the cross section of e+epp¯superscript𝑒superscript𝑒𝑝¯𝑝e^{+}e^{-}\rightarrow p\bar{p}, and also determine the proton form factor in this energy range.

2 BES detector

BES is a conventional solenoidal magnet detector that is described in detail in Ref. [9]; BESII is the upgraded version of the detector [10]. A 12-layer vertex chamber (VC) surrounding the beam pipe provides trigger and coordinate information. A forty-layer main drift chamber (MDC), located radially outside the VC, provides trajectory and energy loss (dE/dx𝑑𝐸𝑑𝑥dE/dx) information for charged tracks over 85%percent8585\% of the total solid angle. The momentum resolution is σp/p=0.0171+p2subscript𝜎𝑝𝑝0.0171superscript𝑝2\sigma_{p}/p=0.017\sqrt{1+p^{2}} (p𝑝p in GeV/cGeV𝑐\hbox{\rm GeV}/c), and the dE/dx𝑑𝐸𝑑𝑥dE/dx resolution for hadron tracks is 8%similar-toabsentpercent8\sim 8\%. An array of 48 scintillation counters surrounding the MDC measures the time-of-flight (TOF) of charged tracks with a resolution of 200similar-toabsent200\sim 200 ps for hadrons. Radially outside the TOF system is a 12 radiation length, lead-gas barrel shower counter (BSC). This measures the energies of electrons and photons over 80%similar-toabsentpercent80\sim 80\% of the total solid angle with an energy resolution of σE/E=22%/Esubscript𝜎𝐸𝐸percent22𝐸\sigma_{E}/E=22\%/\sqrt{E} (E𝐸E in GeV). Outside of the solenoidal coil, which provides a 0.4 Tesla magnetic field over the tracking volume, is an iron flux return that is instrumented with three double layers of counters that identify muons of momentum greater than 0.5 GeV/c𝑐c.

3 Event selection

To select e+epp¯superscript𝑒superscript𝑒𝑝¯𝑝e^{+}e^{-}\rightarrow p\overline{p}, the following criteria are used:

  1. 1.

    There must be two oppositely charged tracks in the MDC. Each track should have a good helix fit in the polar angle range |cosθ|<0.8𝜃0.8|\cos\theta|<0.8 in the MDC, and the point of closest approach of the tracks to the beam axis should be within 2 cm in the radial direction and within 15 cm of the interaction point longitudinally.

  2. 2.

    Tracks should be back-to-back. Fig. 1 shows the acollinearity (Acol𝐴𝑐𝑜𝑙Acol) distributions for Monte Carlo (MC) simulated events at s𝑠\sqrt{s} = 2.0, 2.2, 2.6, and 3.0 GeV. Because of energy loss, the Acol𝐴𝑐𝑜𝑙Acol distribution for low energy charged particles is somewhat different from higher energy ones. For 2.0 GeV data, we require that Acol𝐴𝑐𝑜𝑙Acol is less than 10superscript1010^{\circ}, and for other energy points, less than 3superscript33^{\circ}.

  3. 3.

    To remove Bhabha events, Ep/pp<0.6subscript𝐸𝑝subscript𝑝𝑝0.6E_{p}/p_{p}<0.6 is required, where Epsubscript𝐸𝑝E_{p} is the deposited energy in the BSC and ppsubscript𝑝𝑝p_{p} is the momentum of the candidate proton. Fig. 2 shows Ep/ppsubscript𝐸𝑝subscript𝑝𝑝E_{p}/p_{p} distributions for protons and positrons for MC e+epp¯superscript𝑒superscript𝑒𝑝¯𝑝e^{+}e^{-}\rightarrow p\bar{p} events and Bhabha events at s𝑠\sqrt{s} = 2.2, 2.6, and 3.0 GeV. This requirement removes most Bhabha background.
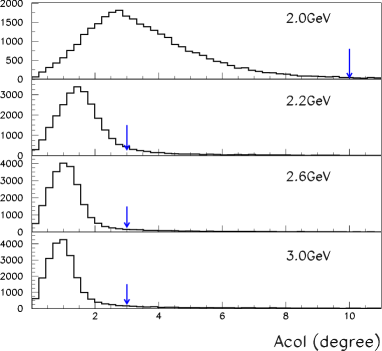
    Refer to caption

    Figure 1: Acol𝐴𝑐𝑜𝑙Acol distributions for MC e+epp¯superscript𝑒superscript𝑒𝑝¯𝑝e^{+}e^{-}\rightarrow p\overline{p} at s𝑠\sqrt{s} = 2.0, 2.2, 2.6, and 3.0 GeV. The arrows show the selection requirement for each case.

    Refer to caption

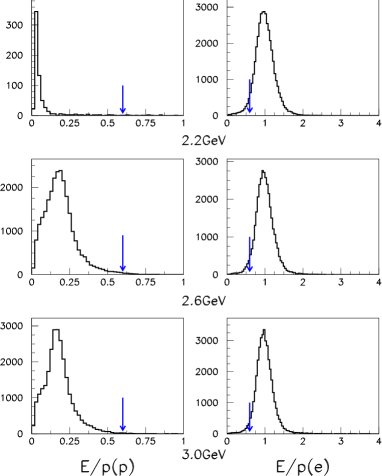
    Figure 2: Distributions of the ratio of the deposited energy in the BSC and the momentum for final state particles of MC e+epp¯superscript𝑒superscript𝑒𝑝¯𝑝e^{+}e^{-}\rightarrow p\bar{p} events and Bhabha events at s𝑠\sqrt{s} = 2.2, 2.6, and 3.0 GeV. Left plots are protons, right are positrons.
  4. 4.

    The momentum is required to be within 3σp3subscript𝜎𝑝3\sigma_{p} of the nominal proton (antiproton) momentum for e+epp¯superscript𝑒superscript𝑒𝑝¯𝑝e^{+}e^{-}\rightarrow p\overline{p} at each energy point, where σpsubscript𝜎𝑝\sigma_{p} is the momentum resolution.

  5. 5.

    Lastly, dE/dx𝑑𝐸𝑑𝑥dE/dx information is used to identify pp¯𝑝¯𝑝p\overline{p} pairs at s𝑠\sqrt{s} = 2.0 and 2.2 GeV, and TOF information is used at all other energy points [11]. Each charged track must satisfy Probp>0.01𝑃𝑟𝑜subscript𝑏𝑝0.01Prob_{p}>0.01, where Probp𝑃𝑟𝑜subscript𝑏𝑝Prob_{p} is the particle identification confidence level for the proton or antiproton hypothesis determined either from dE/dx𝑑𝐸𝑑𝑥dE/dx or TOF information.

The numbers of events passing the selection criteria are listed in Table  1.

Table 1: Summary of results at center-of-mass energies from 2.0 to 3.07 GeV. N is the number of e+epp¯superscript𝑒superscript𝑒𝑝¯𝑝e^{+}e^{-}\rightarrow p\overline{p} events, \cal L is the integrated luminosity, ε𝜀\varepsilon is the detection efficiency, Fεsubscript𝐹𝜀F_{\varepsilon} is the detection efficiency correction factor from the PID efficiency difference between the MC sample and the real data, 1+δ1𝛿1+\delta is the initial state radiation correction factor, Fcsubscript𝐹𝑐F_{c} is the correction factor for the Coulomb effect, Ffsubscript𝐹𝑓F_{f} is the final state radiation correction factor, σ0subscript𝜎0\sigma_{0} is the measured lowest order cross section, and |G|𝐺|G| is the form factor. In the last two columns, the first error is statistical and the second is systematic.
s𝑠\sqrt{s} N \cal L ε𝜀\varepsilon Fεsubscript𝐹𝜀F_{\varepsilon} 1+δ1𝛿1+\delta Fcsubscript𝐹𝑐F_{c} Ffsubscript𝐹𝑓F_{f} σ0subscript𝜎0\sigma_{0} |G|𝐺|G|
(GeV) (nb1)𝑛superscript𝑏1(nb^{-1}) (pb) (×103absentsuperscript103\times 10^{-3})
2.0 31.9+2.3subscriptsuperscript32.31.93^{+2.3}_{-1.9} 45.8±1.4plus-or-minus45.81.445.8\pm 1.4 0.53±0.03plus-or-minus0.530.030.53\pm 0.03 0.41 0.89 1.03 0.99 330209+253±24plus-or-minussubscriptsuperscript33025320924330^{+253}_{-209}\pm 24 17555+67±6plus-or-minussubscriptsuperscript17567556175^{+67}_{-55}\pm 6
2.2 29±5.4plus-or-minus295.429\pm 5.4 123.5±3.7plus-or-minus123.53.7123.5\pm 3.7 0.56±0.02plus-or-minus0.560.020.56\pm 0.02 1.04 0.98 1.02 0.99 408±76±22plus-or-minus4087622408\pm 76\pm 22 179±17±5plus-or-minus179175179\pm 17\pm 5
2.4 21.3+2.2subscriptsuperscript22.21.32^{+2.2}_{-1.3} 61.0±1.6plus-or-minus61.01.661.0\pm 1.6 0.48±0.02plus-or-minus0.480.020.48\pm 0.02 1.03 1.04 1.02 0.98 6441+73±4plus-or-minussubscriptsuperscript647341464^{+73}_{-41}\pm 4 7223+41±2plus-or-minussubscriptsuperscript724123272^{+41}_{-23}\pm 2
2.5 52.2+2.8subscriptsuperscript52.82.25^{+2.8}_{-2.2} 47.0±1.0plus-or-minus47.01.047.0\pm 1.0 0.50±0.02plus-or-minus0.500.020.50\pm 0.02 0.99 1.07 1.02 0.98 20191+113±13plus-or-minussubscriptsuperscript2011139113201^{+113}_{-91}\pm 13 13129+37±4plus-or-minussubscriptsuperscript13137294131^{+37}_{-29}\pm 4
2.6 24±4.9plus-or-minus244.924\pm 4.9 1351±24plus-or-minus1351241351\pm 24 0.51±0.02plus-or-minus0.510.020.51\pm 0.02 0.96 1.10 1.02 0.98 33±7±2plus-or-minus337233\pm 7\pm 2 54±6±2plus-or-minus546254\pm 6\pm 2
2.7 21.3+2.2subscriptsuperscript22.21.32^{+2.2}_{-1.3} 71.6±2.1plus-or-minus71.62.171.6\pm 2.1 0.48±0.02plus-or-minus0.480.020.48\pm 0.02 1.00 1.13 1.02 0.98 5132+58±5plus-or-minussubscriptsuperscript515832551^{+58}_{-32}\pm 5 7022+39±3plus-or-minussubscriptsuperscript703922370^{+39}_{-22}\pm 3
2.8 21.3+2.2subscriptsuperscript22.21.32^{+2.2}_{-1.3} 89.0±1.8plus-or-minus89.01.889.0\pm 1.8 0.50±0.02plus-or-minus0.500.020.50\pm 0.02 0.96 1.17 1.02 0.98 4025+45±4plus-or-minussubscriptsuperscript404525440^{+45}_{-25}\pm 4 6320+36±3plus-or-minussubscriptsuperscript633620363^{+36}_{-20}\pm 3
2.9 0 94.0±2.6plus-or-minus94.02.694.0\pm 2.6 0.49±0.02plus-or-minus0.490.020.49\pm 0.02 0.96 1.20 1.02 0.98 <<51 <<73
3.0 41.7+2.8subscriptsuperscript42.81.74^{+2.8}_{-1.7} 947±22plus-or-minus94722947\pm 22 0.50±0.02plus-or-minus0.500.020.50\pm 0.02 0.96 1.24 1.01 0.98 73+5±1plus-or-minussubscriptsuperscript75317^{+5}_{-3}\pm 1 286+10±1plus-or-minussubscriptsuperscript28106128^{+10}_{-6}\pm 1
3.07 92.7+3.8subscriptsuperscript93.82.79^{+3.8}_{-2.7} 2347±59plus-or-minus2347592347\pm 59 0.49±0.02plus-or-minus0.490.020.49\pm 0.02 0.96 1.27 1.01 0.98 72+3±1plus-or-minussubscriptsuperscript73217^{+3}_{-2}\pm 1 274+6±1plus-or-minussubscriptsuperscript2764127^{+6}_{-4}\pm 1

4 Luminosity

The integrated luminosity is determined from large-angle Bhabha events using [12][13]

=NeeεtrgeeACεσee,subscript𝑁𝑒𝑒subscriptsuperscript𝜀𝑒𝑒𝑡𝑟𝑔𝐴subscript𝐶𝜀subscript𝜎𝑒𝑒{\cal L}=\frac{N_{ee}}{\varepsilon^{ee}_{trg}\cdot A\cdot C_{\varepsilon}\cdot\sigma_{ee}}, (2)

where, Neesubscript𝑁𝑒𝑒N_{ee} is the number of Bhabha events selected using BSC information only, εtrgeesubscriptsuperscript𝜀𝑒𝑒𝑡𝑟𝑔\varepsilon^{ee}_{trg} is the trigger efficiency for Bhabha events, A𝐴A is the acceptance of Bhabha events estimated by MC simulation using the same selection criteria as for the data, Cεsubscript𝐶𝜀C_{\varepsilon} is the efficiency correction factor, which is used to correct for differences between the MC and data angular distributions due to the ribs in the BSC, and σeesubscript𝜎𝑒𝑒\sigma_{ee} is the Bhabha cross section.

5 Efficiency

A MC simulation is used for the determination of the detection efficiency. In the e+epp¯(γ)superscript𝑒superscript𝑒𝑝¯𝑝𝛾e^{+}e^{-}\rightarrow p\overline{p}(\gamma) generator, corrections for initial state radiation [14], the Coulomb effect [15][16], and final state radiation  [17] have been taken into account. The correction factors for these items, 1+δ1𝛿1+\delta, Fcsubscript𝐹𝑐F_{c}, and Ffsubscript𝐹𝑓F_{f}, respectively, are listed in Table 1.

For each energy point, 50,000 MC events are generated. MC events must satisfy the same selection criteria as used for the real data. The detection efficiencies, ε𝜀\varepsilon, are given in Table 1.

6 Systematic errors

Systematic errors come from uncertainties in the detection efficiency, trigger efficiency, luminosity, and background contamination. The detection efficiency uncertainty includes the MC statistical error and the differences in the particle identification (PID) and tracking efficiencies for the MC sample and the real data.

There are few e+epp¯superscript𝑒superscript𝑒𝑝¯𝑝e^{+}e^{-}\rightarrow p\overline{p} events, so p𝑝p and p¯¯𝑝\bar{p} samples from J/ψπ+πpp¯𝐽𝜓superscript𝜋superscript𝜋𝑝¯𝑝J/\psi\rightarrow\pi^{+}\pi^{-}p\bar{p} are used for the PID efficiency study. The momenta of the candidate p𝑝p and p¯¯𝑝\bar{p} tracks are required to be within 30 MeV/c of the expected values for each energy point. The samples are obtained without using PID. The PID efficiency for each energy point is then detemined by the fraction of p and p¯¯𝑝\bar{p} tracks that pass PID selection criteria. The same method is used for MC J/ψπ+πpp¯𝐽𝜓superscript𝜋superscript𝜋𝑝¯𝑝J/\psi\rightarrow\pi^{+}\pi^{-}p\bar{p} events to determine the PID efficiency for the MC data. At 2.0 GeV, there is a large difference in PID efficiency between the MC sample and the data, so for all energy points detection efficiencies (Fεsubscript𝐹𝜀F_{\varepsilon}) are corrected for this difference, and the errors in the PID efficiency difference are taken as a source of systematic error.

For e+epp¯superscript𝑒superscript𝑒𝑝¯𝑝e^{+}e^{-}\rightarrow p\overline{p}, possible backgrounds are from e+ee+e(γ)superscript𝑒superscript𝑒superscript𝑒superscript𝑒𝛾e^{+}e^{-}\rightarrow e^{+}e^{-}(\gamma), μ+μ(γ)superscript𝜇superscript𝜇𝛾\mu^{+}\mu^{-}(\gamma), π+πsuperscript𝜋superscript𝜋\pi^{+}\pi^{-}, K+Ksuperscript𝐾superscript𝐾K^{+}K^{-}, and pp¯π0𝑝¯𝑝superscript𝜋0p\bar{p}\pi^{0}. MC events are generated for these five decays at s=𝑠absent\sqrt{s}= 2.2, 2.6 and 3.0 GeV to estimate the amount of background contamination, which is included as a systematic error: 1.5%percent1.51.5\% for 2.0 and 2.2 GeV, 4.4%percent4.44.4\% for 2.4, 2.5, and 2.6 GeV, and 7.8%percent7.87.8\% for other energy points.

Systematic errors are listed in Table 2. An uncertainty of 1.0%percent\% is taken for the initial state radiation correction.

Table 2: The relative systematic error (%percent\%): Δε/εΔ𝜀𝜀\Delta\varepsilon/\varepsilon is the contribution from detection efficiency, including the MC statistical error (errN𝑒𝑟subscript𝑟𝑁err_{N}), the PID difference (errPID𝑒𝑟subscript𝑟𝑃𝐼𝐷err_{PID}) and tracking efficiency difference (errtrack𝑒𝑟subscript𝑟𝑡𝑟𝑎𝑐𝑘err_{track}) between MC and real data; Δεtrig/εtrigΔsubscript𝜀𝑡𝑟𝑖𝑔subscript𝜀𝑡𝑟𝑖𝑔\Delta\varepsilon_{trig}/\varepsilon_{trig} is the contribution from the trigger efficiency; Δ/Δ\Delta{\cal L}/{\cal L} is the contribution from luminosity; and BG is the contribution from the background contamination.
s𝑠\sqrt{s} Δε/εΔ𝜀𝜀\Delta\varepsilon/\varepsilon Δεtrig/εtrigΔsubscript𝜀𝑡𝑟𝑖𝑔subscript𝜀𝑡𝑟𝑖𝑔\Delta\varepsilon_{trig}/\varepsilon_{trig} Δ/Δ\Delta{\cal L}/{\cal L} BG total
(GeV) errN𝑒𝑟subscript𝑟𝑁err_{N} errPID𝑒𝑟subscript𝑟𝑃𝐼𝐷err_{PID} errtrack𝑒𝑟subscript𝑟𝑡𝑟𝑎𝑐𝑘err_{track} total
2.0 0.4 5.0 4.0 6.4 0.5 3.0 1.5 7.3
2.2 0.4 0.6 4.0 4.1 0.5 3.0 1.5 5.3
2.4 0.5 0.9 4.0 4.1 0.5 2.7 4.4 6.6
2.5 0.4 1.0 4.0 4.1 0.5 2.2 4.4 6.4
2.6 0.4 1.0 4.0 4.1 0.5 1.8 4.4 6.3
2.7 0.5 1.0 4.0 4.2 0.5 2.9 7.8 9.3
2.8 0.4 1.9 4.0 4.4 0.5 2.0 7.8 9.2
2.9 0.5 1.9 4.0 4.4 0.5 2.8 7.8 9.4
3.0 0.4 1.9 4.0 4.4 0.5 2.3 7.8 9.3
3.07 0.5 1.9 4.0 4.4 0.5 2.5 7.8 9.3

7 Results and summary

The total cross section is determined from

σT=Nεεtrig,subscript𝜎𝑇𝑁𝜀subscript𝜀𝑡𝑟𝑖𝑔\sigma_{T}=\frac{N}{{\cal L}\cdot\varepsilon\cdot\varepsilon_{trig}}, (3)

where N is the number of e+epp¯superscript𝑒superscript𝑒𝑝¯𝑝e^{+}e^{-}\rightarrow p\overline{p} events, \cal L is the integrated luminosity, ε𝜀\varepsilon is the detection efficiency, and εtrigsubscript𝜀𝑡𝑟𝑖𝑔\varepsilon_{trig} is the trigger efficiency. The lowest order cross section is determined from

σ0=σT(1+δ)FcFf,subscript𝜎0subscript𝜎𝑇1𝛿subscript𝐹𝑐subscript𝐹𝑓\sigma_{0}=\frac{\sigma_{T}}{(1+\delta)\cdot F_{c}\cdot F_{f}}, (4)

where 1+δ1𝛿1+\delta, Fcsubscript𝐹𝑐F_{c}, and Ffsubscript𝐹𝑓F_{f} are correction factors for initial state radiation, the Coulomb effect, and final state radiation, respectively.

The form factor can be calculated from the theoretical lowest order cross section [5]

σ0=4πα2ν3s(1+2mp2s)|G(s)|2,subscript𝜎04𝜋superscript𝛼2𝜈3𝑠12subscriptsuperscript𝑚2𝑝𝑠superscript𝐺𝑠2\sigma_{0}=\frac{4\pi\alpha^{2}\nu}{3s}(1+\frac{2m^{2}_{p}}{s})|G(s)|^{2}, (5)

in which α𝛼\alpha is the fine structure constant, ν𝜈\nu is the proton velocity, mpsubscript𝑚𝑝m_{p} is the proton mass, and |G|𝐺|G| is the form factor assuming |GE|=|GM|subscript𝐺𝐸subscript𝐺𝑀|G_{E}|=|G_{M}|.

The trigger efficiency εtrigsubscript𝜀𝑡𝑟𝑖𝑔\varepsilon_{trig} for the hadron is about 100%percent\%, and the error is estimated to be 0.5%percent\% [18].

The cross section of e+epp¯superscript𝑒superscript𝑒𝑝¯𝑝e^{+}e^{-}\rightarrow p\overline{p} and proton form factor have been measured for 10 center-of-mass energies between 2.0 and 3.07 GeV. The measured values are listed in Table 1. There is no signal found at s=2.9𝑠2.9\sqrt{s}=2.9 GeV, but upper limits on the cross section and the form factor at the 90%percent9090\% C.L. are given, using the method from Ref. [19].

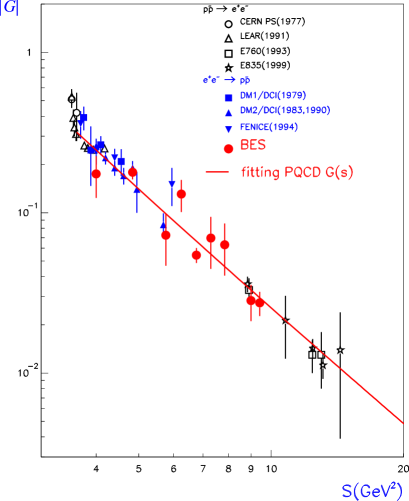
For large momentum transfers pQCD predicts [20] that q4Gsuperscript𝑞4𝐺q^{4}G should be nearly proportional to the square of the running coupling constant for strong interactions, αs2(q2)superscriptsubscript𝛼𝑠2superscript𝑞2\alpha_{s}^{2}(q^{2}), yielding the relation

|G|=Cs2ln2(s/Λ2),𝐺𝐶superscript𝑠2𝑙superscript𝑛2𝑠superscriptΛ2|G|=\frac{C}{s^{2}ln^{2}(s/\Lambda^{2})}, (6)

where Λ=0.3Λ0.3\Lambda=0.3 GeV is the QCD scale parameter and C is a free parameter. In Fig. 3, BES results are compared with other experimental proton form factor results. The line is the |G(s)|𝐺𝑠|G(s)| energy dependence obtained by fitting all measurements with Eq. 6, and the result is consistent with the pQCD prediction.

Refer to caption

Figure 3: Form factors measured by BES and other experiments. The line shows the energy dependence of |G(s)|𝐺𝑠|G(s)| by fitting all measurements.

Acknowledgments

The BES collaboration thanks the staff of BEPC for their hard efforts. This work is supported in part by the National Natural Science Foundation of China under contracts Nos. 10491300, 10225524, 10225525, 10425523, the Chinese Academy of Sciences under contract No. KJ 95T-03, the 100 Talents Program of CAS under Contract Nos. U-11, U-24, U-25, and the Knowledge Innovation Project of CAS under Contract Nos. U-602, U-34 (IHEP), the National Natural Science Foundation of China under Contract No. 10225522 (Tsinghua University), and the Department of Energy under Contract No.DE-FG02-04ER41291 (U Hawaii).

References

  • [1] Donald H. Perkins, Introduction to High Engergy Physics, Third Edition (1987) 194.
  • [2] G. Bardin, et al., Nucl. Phys. B411 (1994) 3.
  • [3] B. Delcourt, et al., Phys. Lett. B86 (1979) 395.
  • [4] D. Bisello, et al., Nucl. Phys. B224 (1983) 379.
  • [5] A. Antonelli, et al., Phys. Lett. B334 (1994) 431.
  • [6] T. A. Armstrong, et al., Phys. Rev. Lett. 70 (1993) 1212.
  • [7] M. Ambrogiani, et al., Phys. Rev. D60 (1999) 032002.
  • [8] BES Collab., J. Z. Bai, et al., Phys. Rev. Lett. 88 (2002) 101802.
  • [9] BES Collab., J. Z. Bai, et al., Nucl. Instr. Meth. A344 (1994) 319.
  • [10] BES Collab., J. Z. Bai, et al., Nucl. Instr. Meth. A458 (2001) 627.
  • [11] H. H. Li, et al., HEP&\&NP27 (2003) 659 (in Chinese).
  • [12] G. S. Huang, et al., HEP&\&NP24 (2000) 373 (in Chinese).
  • [13] Z. Y. Wang, et al., HEP&\&NP25 (2001) 89 (in Chinese).
  • [14] É. A. Kureav and V. S. Fadin, Sov. J. Nucl. Phys. 41 (1985) 466.
  • [15] L. D. Landau and E. M. Lifshitz, Quantum Mechanics 3rd., Pergammon Press (1977) 123.
  • [16] J. M. Wu, P. Y. Zhao, HEP&\&NP17 (1993) 379 (in Chinese).
  • [17] J. Schwinger, Particles, Sources, and Fields III, Addison-Wesley (1989) 109.
  • [18] G. S. Huang, et al., HEP&\&NP25 (2001) 889 (in Chinese).
  • [19] G. J. Feldman and R. D. Cousins, Phys. Rev. D57 (1998) 3873.
  • [20] G. P. Lepage and S. J. Brodsky, Phys. Rev. Lett. 43 (1979) 545; Phys. Rev. D22 (1980) 2157.