We present results related to determination
of the Unitarity Triangle angle .
1 Introduction
Determinations of the Cabibbo-Kobayashi-Maskawa
(CKM) matrix elements provide important checks on
the consistency of the Standard Model and ways to search
for new physics. Various methods using violation in
decays have been proposed to
measure the Unitarity Triangle
angle . These methods are based on two key observations:
neutral and
mesons can decay to a common final state, and the decay
can produce neutral mesons of both flavors
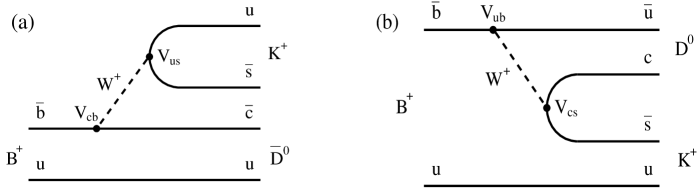
via (Fig. 1a)
and (Fig. 1b) transitions,
with a relative phase between the two interfering
amplitudes that is the sum, , of strong and weak
interaction phases. For the charge conjugate mode, the relative phase
is .
Figure 1: Feynman diagrams of (a) dominant and
(b) suppressed decays
The results are based on a data sample containing 275 million
pairs,
collected with the Belle detector at the KEKB asymmetric energy
collider operating at the resonance.
2 and
Recent theoretical studies on meson dynamics have
demonstrated a method to access using the process . When a is reconstructed as a eigenstate, the
and processes interfere.
This interference leads to direct violation.
To extract
and assuming no mixing, some necessary
observables sensitive to violation are:
where the ratios and are defined as
where and are -even and
-odd eigenstates respectively. The asymmetries and
have opposite signs. The ratio is defined as
and is the ratio of
the two tree diagrams shown in Fig. 1 where
is their strong-phase difference.
The size of the ratio governs the magnitude of the maximum possible
CP asymmetry; this ratio is suppressed by both CKM and color
factors.
The asymmetries and double ratios can be
calculated for in a similar manner.
The analysis is described in detail elsewhere .
Fig. 2 shows the distributions for events.
Table 1 summarizes the yields from fit
and the corresponding asymmetries with statistical errors.
In the control samples, no large deviation from 0 is seen. The modes of
interest are and where the and events are
used to calculate asymmetries and double ratios.
Table 1: Yields and asymmetries obtained for modes.
19283 150
9690 104
9521 103
-0.01 0.01
2183 55
1051 36
1132 37
0.04 0.02
2413 93
1178 43
1226 43
0.02 0.03
1031 39
484 27
549 28
0.06 0.04
114 21
49 15
63 14
0.07 0.14
167 21
94 17
75 16
-0.11 0.14
The final asymmetries for and are
found do be
=
0.07 0.14 (stat) 0.06 (sys)
=
-0.11 0.14 (stat) 0.05 (sys)
agreeing with theoretical expectations where they should have
opposite signs. The double ratios:
=
0.98 0.18 (stat) 0.10 (sys)
=
1.29 0.16 (stat) 0.08 (sys)
Fig. 3 shows the distributions for events.
Table 2 contains the yields of the
distributions with statistical errors and asymmetries.
The statistical significance of and signals
are 5.6 and 4.5 respectively.
Figure 3: distributions for (left) , (right) .
Table 2: Yields and asymmetries obtained for modes.
5762 101
2681 74
2594 74
-0.02 0.02
795 41
399 24
397 23
0.00 0.04
715 37
415 35
301 33
-0.16 0.07
284 23
158 16
127 16
-0.11 0.08
56 11
33 8
19 8
-0.27 0.25
33 10
13 6
22 7
0.26 0.26
Asymmetries were found to be:
=
-0.27 0.25 (stat) 0.04 (sys)
=
0.26 0.26 (stat) 0.03 (sys)
where the systematic errors were calculated in a similar way to the
case. Double ratios found are:
=
1.43 0.28 (stat) 0.06 (sys)
=
0.94 0.28 (stat) 0.06 (sys)
In summary, the partial rate asymmetries are
measured for the decays
and are consistent with zero.
A first observation is seen for and .
3 Measurement of with Dalitz Plot
Analysis of Decay
Recently, three body final states common to and
, such as , were suggested as
promising modes for the extraction of .
This method is based on two key observations: neutral and
mesons can decay to a common final state such as ,
and the decay
can produce neutral mesons of both flavors
via and
transitions, where the relative phase between the two interfering
amplitudes is the sum, , of strong and weak interaction
phases. In the charge conjugate mode, the relative phase
, so both phases can be extracted
from the measurements of such decays and their charge conjugate modes.
The phase measurement is based
on the analysis of Dalitz distribution of the three body final state of the
meson.
The analysis is described in detail
elsewhere .
The Dalitz plots of decaying to ,
which contain information about CP violation in
decays, are fitted for and data sets.
A combined unbinned maximum likelihood fit to the
and samples with
, and as free parameters yields the following values:
, ,
for the sample and
, ,
for the sample.
The errors quoted here are obtained from the likelihood fit.
These errors are a good representation of the statistical uncertainties for
a Gaussian likelihood distribution, however in our case
the distributions are highly non-Gaussian. In addition, the errors
for the strong and weak phases depend on the values of the
amplitude ratio (e.g. for there is
no sensitivity to the phases). A more reliable estimate of the
statistical uncertainties is obtained using a large number
of MC pseudo-experiments as discussed below.
We use a frequentist technique to evaluate the
statistical significance of the measurements.
To obtain the probability density function (PDF) of the fitted
parameters as a function of the true parameters, which is needed for this
method, we employ a “toy” MC technique that uses a
simplified MC simulation of the experiment which incorporates
the same efficiencies, resolution and backgrounds as
used in the data fit. This MC is used
to generate several hundred experiments for a given set of
, and values. For each simulated
experiment, Dalitz plot distributions are generated
with equal numbers of events as in the data, 137 and 139 events
for and decays, correspondingly, for mode and
34 and 35 events for and for
mode. The simulated Dalitz plot distributions
are subjected to the same fitting procedure that is applied
to the data. This is repeated for different values of ,
producing distributions of the fitted parameters that
are used to produce a functional form of the PDFs of the
reconstructed values for any set of input parameters.
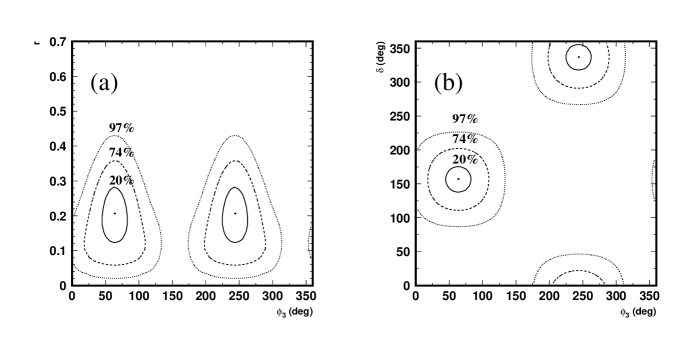
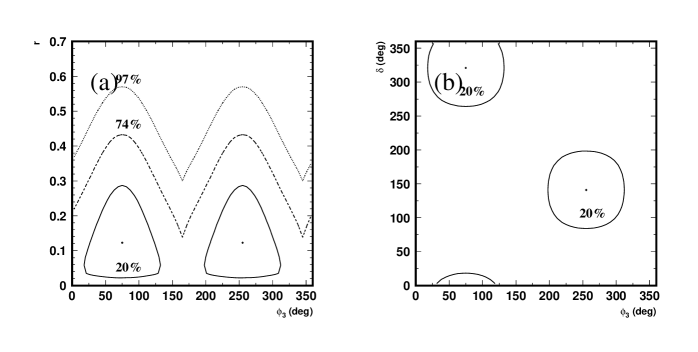
The confidence regions for the pairs of parameters
and are shown in Fig. 4
( mode) and Fig. 5 ( mode).
They are the projections of the corresponding
confidence regions in the three-dimensional parameter space.
We show the 20%, 74% and 97% confidence level regions,
which correspond to
one, two, and three standard deviations for a three-dimensional Gaussian
distribution.
For the final results, we use the central values that are obtained by
maximizing the PDF and the statistical errors corresponding to the 20%
confidence region (one standard deviation). Of the two possible
solutions (, and , )
we choose the one with . The final results are
(2)
for the mode and
(3)
for the mode. The first, second, and third errors are
statistical, systematic, and model dependent errors.
The significance of violation is 94% for the sample
and 38% for .
Figure 4: Confidence regions for the pairs of parameters (a) (, )
and (b) () for the sample.Figure 5: Confidence regions for the pairs of parameters (a) (, )
and (b) () for the sample.
The two events samples, and , are combined
in order to obtain a more accurate measurement of .
The result from the combined analysis is
(4)
where the first error is statistical, the second is experimental systematics, and
the third is model uncertainty.
The two standard deviation interval including the
systematic and model uncertainties is .
The statistical significance of violation for the combined measurement
is 98%.
4 Study of the Suppressed Decays
and
As noted by Atwood, Dunietz and Soni (ADS) ,
violation effects are enhanced if the final state is chosen so
that the interfering amplitudes have comparable magnitudes;
the archetype uses ,
where indicates that the pair
originates from a neutral meson.
The analysis is described in detail elsewhere .
Table 3:
Summary of the results.
For the signal yield,
the peaking background contribution has been subtracted.
The first two errors on the measured production branching fractions
are statistical and systematic, respectively,
and the third is due to the uncertainty in the
product branching fraction used for normalization.
Mode
Signal Yield
Statistical
Measured product
Upper limit
significance
branching fraction
(C.L.)
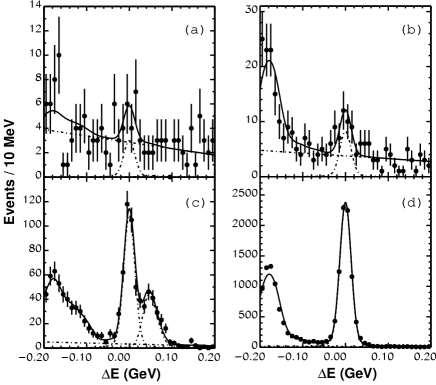
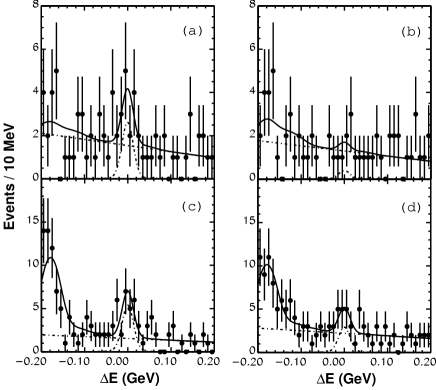
Figure 6:
fit results for
(a) ,
(b) ,
(c) , and
(d) .
Charge conjugate modes are included in these plots.
The ratio of branching fractions is defined as
where () and ()
are the number of signal events and the reconstruction efficiency for the decay
(),
and are given in Table 3.
The ratios are calculated to be
Since the signal for is not significant,
we set an upper limit at the confidence level (C.L.) of
.
The product branching fractions for are determined as
and are given in Table 3.
A third uncertainty arises due to the error in the branching fraction
of , which is taken from .
The uncertainties are statistics-dominated.
For the branching fraction,
we set an upper limit at the C.L. of
.
For ,
our measured branching fraction is consistent with expectation
neglecting the contribution from .
The ratio is related to by
where
and and are the strong phase differences
between the two and decay amplitudes, respectively.
Using the above result, we obtain a limit on .
The least restrictive limit is obtained
allowing variation on and assuming maximal interference
( or )
and is found to be .
Figure 7:
fit results for
(a) ,
(b) ,
(c) , and
(d) .
Table 4:
Signal yields and partial rate asymmetries.
Mode
We search for partial rate asymmetries
in decay,
fitting the and yields separately for each mode,
where is determined as
The peaking background for
is subtracted assuming no asymmetry.
The fit results are shown in Fig. 7 and Table 4.
We find
In summary, we observe for the first time,
with a significance of .
The size of the signal is consistent with
expectation based on measured branching fractions .
The significance for is
and we set an upper limit on the ratio of decay amplitudes
at confidence level.
Acknowledgments
We thank the KEKB group for the excellent operation of the
accelerator, the KEK cryogenics group for the efficient
operation of the solenoid, and the KEK computer group and
the NII for valuable computing and Super-SINET network
support. We acknowledge support from MEXT and JSPS (Japan);
ARC and DEST (Australia); NSFC (contract No. 10175071,
China); DST (India); the BK21 program of MOEHRD and the CHEP
SRC program of KOSEF (Korea); KBN (contract No. 2P03B 01324,
Poland); MIST (Russia); MHEST (Slovenia); SNSF (Switzerland); NSC and MOE
(Taiwan); and DOE (USA).
References
References
[1]
M. Kobayashi and T. Maskawa, Prog. Theor. Phys. 49, 652 (1973);
N. Cabibbo, Phys. Rev. Lett. 10, 531 (1963).
[2]
M. Gronau and D. London, Phys. Lett. B253, 483 (1991);
M. Gronau and D. Wyler, Phys. Lett. B265, 172 (1991).
[3]
I. Dunietz, Phys. Lett. B270, 75 (1991).
[4]
D. Atwood, G. Eilam, M. Gronau and A. Soni,
Phys. Lett. B341, 372 (1995).
[5]
D. Atwood, I. Dunietz and A. Soni, Phys. Rev. Lett. 78, 3257 (1997);
D. Atwood, I. Dunietz and A. Soni, Phys. Rev. D 63, 036005 (2001).
[6]
A. Giri, Yu. Grossman, A. Soffer, J. Zupan, Phys. Rev. D 68,
054018 (2003).
This technique was proposed independently in the Belle Collaboration, and
the analysis of experimental data was under way before the
A. Giri et al. publication appeared
(Proceedings of BINP Special Analysis Meeting on Dalitz Analysis,
24-26 Sep. 2002, unpublished).
[7]Belle Collaboration, A. Abashian et al.,
Nucl. Inst. and Meth. A 479, 117 (2002).
[8]Belle Collaboration, K. Abe et al.,
Belle-Conf 0443, contribution to the ICHEP 04.
[9]Belle Collaboration, A.Poluektov et al.,
Phys. Rev. D 70, 072003 (2004).
[10]Belle Collaboration, M. Saigo et al.,
Phys. Rev. Lett. 94, 091601 (2005).
[11]
S. Eidelman et al. (Particle Data Group),
Phys. Lett. B592, 1 (2004).