Measurements of muon flux in the Pyhäsalmi underground laboratory
Abstract
The cosmic-ray induced muon flux was measured at several depths in the Pyhäsalmi mine (Finland) using a plastic scintillator telescope mounted on a trailer. The flux was determined at four different depths underground at 400 m (980 m.w.e), at 660 m (1900 m.w.e), at 990 m (2810 m.w.e) and at 1390 m (3960 m.w.e) with the trailer, and also at the ground surface. In addition, previously measured fluxes from depths of 90 m (210 m.w.e) and 210 m (420 m.w.e) are shown. A relation was obtained for the underground muon flux as a function of the depth. The measured flux follows well the general behaviour and is consistent with results determined in other underground laboratories.
keywords:
underground laboratory, measured muon flux, muon background, cosmic-ray induced muon, plastic scintillation detectorPACS:
96.40.Tv, 95.55.Vj, 95.85.Ry, 29.40.Mc, , , , , , , , , , , ,
1 Introduction
Existing and future experiments on searching for proton decay or dark matter, or on low-energy neutrino detection need a deep underground location and low-background environment. The cosmic-ray muon flux can be reduced several order of magnitudes by shielding experiments with rock overburden.
Muons, however, are usually not the dominant background in underground experiments as they can be identified and distinguished by relatively simple way. Much more problematic contribution on the background comes from high-energy neutrons generated by muons in the interactions with the surrounding rock or with the detector material. The energy of these neutrons may even extend up to the GeV region. This is, for example, the factor limiting the current experiments on dark matter searches.
Precise knowledge of the muon flux is thus important in order to estimate, or calculate by Monte Carlo codes, the absolute underground neutron flux. In the present work, the underground cosmic-ray muon flux was systematically investigated by measuring it at several depths in the Pyhäsalmi mine.
The Pyhäsalmi mine (owned by Inmet Mining Corporation, Canada) is an active zinc, copper and pyrite mine in central Finland. It is the oldest and the deepest operational base-metal mine in Europe, extending down to about 1440 metres (corresponding about 4100 m.w.e). The site provides excellent opportunities for the research of underground physics by offering very stable bedrock, modern infrastructure, and good traffic conditions all around a year. CUPP (Centre for Underground Physics in Pyhäsalmi) is establishing an international underground laboratory into the connection with the mine.
2 Experimental details
The experimental setup consisted in total of 12 plastic scintillation counters of type NE102A, having maximum light output at wavelength of 423 nm. The size of a scintillation plate is 50 cm 50 cm 5 cm. Each counter was attached with Hamamatsu head-on type R329-02 photomultiplier tube (PMT) using fishtail-shaped acrylic light quide and BC-630 as an optical connector. The sensitivity range of the PMT is 300 – 600 nm.
Each scintillation plate and PMT was mounted on a water- and light-tight stainless-steel box with size of 1.55 m 0.65 m 0.15 m, and the total weight of about 60 kg. The boxes were arranged in a geometry covering a sensitive area of 1.5 m2, and were installed on a movable trailer together with the data acquisition system (DAQ). The vertical distance (of the mid-planes) of two scintillation plates was 15 cm.
Two boxes were overlaid, in order to get a coincidence signals and reduce noise signals. The DAQ consisted of two separate and identical systems, each one connected into six scintillators. Standard NIM electronics with discriminators and coincidence units were used together with 8-bit ADC & Scaler units. UPS system was used to ensure secure data collection in the case of (probable) electrical break-down.
The scintillators were tested before the installation on the trailer. The efficiency measurement was done by piling-up three detectors (stainless-steel boxes), and the one to be tested was placed in the middle. The trigger was taken from a coincidence unit which verified that muon had passed all the counters. The efficiency of (97 3)% was obtained for each single detector.
| Depth | Duration | Coordinates | Counts | Flux Density |
|---|---|---|---|---|
| m] ([m.w.e]) | [hours] | (x,y) | [m-2s-1] | |
| 0 | 12 | (8308,2680) | 7600000 | 180 20 |
| 400 (980) | 192 | (8535,2635) | 13232 | |
| 400 (980) | 132 | (8580,2657) | 10510 | (2.1 0.2) 10-2 |
| 660 (1900) | 325 | (8390,2425) | 3850 | (3.2 0.3) 10-3 |
| 990 (2810) | 1368 | (8400,2392) | 3282 | (6.2 0.6) 10-4 |
| 1390 (3960) | 2748 | (8225,2460) | 1206 | (1.1 0.1) 10-4 |
3 Measurements
The muon-flux measurements were performed with the trailer at the ground surface and at 4 different depths underground, which were two positions at 400 metres (corresponding 980 m.w.e), 660 metres (1900 m.w.e), 990 metres (2810 m.w.e), and 1390 metres (3960 m.w.e). In addition, data are shown for the depths of 90 and 210 metres which have been measured earlier with similar (but stationary) detector telescope. Their corresponding depths are 210 m.w.e and 420 m.w.e, respectively.
The measurement durations were chosen such that the statistical uncertainty would be small (about 2% or less). The measurement took about two weeks in 400 and 660 levels each, about two months at 990 levels, and about four months at 1390 level. Details of the measurements are shown in Table 1.

4 Data analysis and results
The composition of the rock in the mine is well known, and the average rock density of 2.85 g/cm3 was used to convert the depths in the m.w.e-units (metre water equivalent). The muon flux was obtained by dividing the measured counts by the measurement time (see Table 1) and the detector area (1.5 m2). In the analysis vertical muons were not distinguished from non-vertical muons.
The measurement positions of underground levels of 210 and 400 metres situate directly under the open pit mine which is nearly 100 metres depth, and contains also some loose rocks and sand. The metre-water-equivalent values of these two depth were taken as effective depth determined by simulation [1]. Their depth (as m.w.e) corresponds to flat surface geometry giving the same reduction in the flux.
The open pit mine has no (significant) effect on other measurement positions since they are not directly below it, and mostly lie deeper. For these levels the metre-water-equivalent depth was determined from the vertical distance to the surface, taking into account possible underground caverns.
The number of muons were obtained from the energy-loss spectrum by counting the events. The statistical uncertainty was taken as square root of the number of events. Fig. 1 shows, as an example, the total muon energy-loss spectrum measured at 660 metres underground.
The collected number of muons were corrected for the detector efficiencies (being about (97%)2), and by the amount of muon events below the energy threshold which was estimated in the test measurement to be (5 2)% [5]. Signals from neutrons induced by the rock activity or muons were not corrected for.
The geometrical uncertainty, i.e. that the two scintillation plates were not fully overlapping, was estimated as 4%. The uncertainty in the depth was taken as about 5 metres corresponding to about 20 m.w.e including also the variation in the average rock density.
The detector acceptance was taken into account by determining the effective area of the scintillation pair at each depth using two different zenith angle distribution (Miyake model and Intermediate-depth model) of cosmic-ray muons. The distributions were taken from Ref. [6], and they resulted the same effective area for 210-level and deeper. For the surface and 90-level the Miyake distribution was used. The acceptance correction decreases for deeper depths; for the surface the acceptance was corrected by a factor of 1.42 and for the 1390-level by a factor of 1.23. The uncertainty of the correction was assumed to be better than 10%.
The results of the muon fluxes measured in the present work are shown in Fig. 2 as full circles. The flux at 400 level is an average of the two measurement. In addition, Fig. 2 shows fluxes from 90- and 210-levels, which have been measured earlier with similar but stationary detector system [5], as full squares. The reduction factor of the muon flux compared with the surface flux is shown in parentheses for each level. Open symbols show the results of other muon-flux measurements in some underground laboratories for comparison.
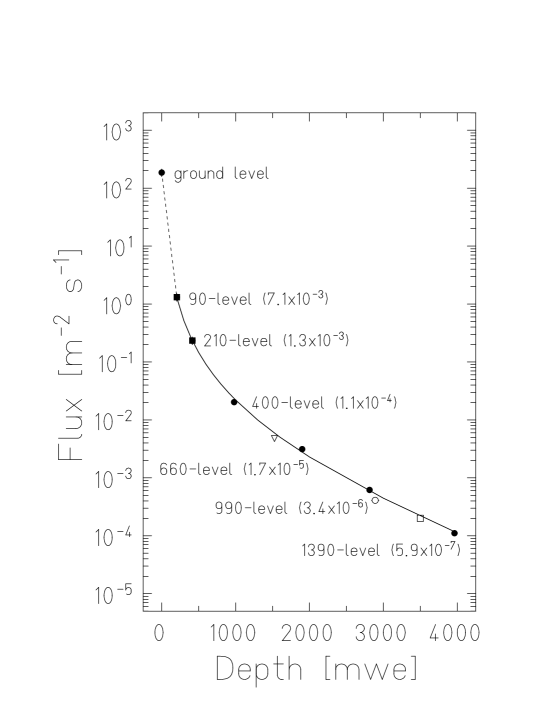
The behaviour of the total muon flux underground as a function of the depth was extracted from the data using six data points (full symbols in Fig. 2 except the surface flux) by fitting a function of the form [7]
| (1) |
where is the flux as m-2s-1 and the depth as m.w.e. The following values were obtained for the fit parameters (with ):
The fit function (Eq. 1) is plotted in Fig. 2 with the above parametres as the solid line.
5 Discussion
The flux measured in the present work is consistent with results obtained in other underground laboratories at specific depths (Fig. 2). The data agrees very well with the measurements done at Gran Sasso and WIPP (Refs. [3, 4]), and reasonably well also with the result measured at Boulby [2]. The deviation with the Boulby value at this specific depth is some 30%.
The best fit plotted in Fig. 2 as the solid line describes well the decrease of the flux as a function of the depth, and it can be used to estimate the muon flux at an arbitrary depth with a good accuracy. The values of and are also relatively close to the values of other similar fit-results obtained for the behaviour of the vertical muon intensity as a function of the depth ( m.w.e) [7].
6 Conclusion
Cosmic-ray induced muon flux has been systematically measured at several depths in the Pyhäsalmi mine. The data appear to be the most comprehensive one of this type, and at specific points consistent with results determined in other underground laboratories. A relation obtained for the underground muon flux as a function on the depth is also consistent with previous investigations. However, since the measurements were done with the same detector at the different depths, the systematical uncertainty between the depths should be negligible. The muon-flux measurements will continue.
The fast neutron background is going to be measured in the Pyhäsalmi underground laboratory during the next two years. The measured muon flux of the present work offers already a good way to estimate the magnitude of the muon-produced neutron flux. The results of the present work are also valuable in evaluating the suitability of the Pyhäsalmi site as a underground laboratory hosting future experiments requiring effective cosmic-ray shielding.
Acknowledgements
The authors want to acknowledge the support and help of the local staff of the Pyhäsalmi mine. The Department of Physics of the University of Jyväskylä is also acknowledged by their contribution. The Pyhäsalmi underground laboratory is funded by the European Union Regional Development Fund (ERDF).
References
- [1] T. Kulju, J. Peltoniemi, J. Sarkamo, CUPP Report 01/2004 (2004) (unpublished).
- [2] M. Robinson, V.A. Kudryavtsev, R. Lüscher, J.E. McMillan, P.K. Lightfoot, N.J.C. Spooner, N.J.T. Smith, I. Liubarsky, Nucl. Instrum. Methods A511 (2003) 347.
- [3] C. Arnaboldi, F.T. Avignone III, J. Beeman, M. Barucci, M. Balata, C. Brofferio, C. Bucci, S. Cebrian, R.J. Creswick, S. Capelli, L. Carbone, O. Cremonesi, A. de Ward, E. Fiorini, H.A. Farach, G. Frossati, A. Giuliani, P. Gorla, E.E. Haller, I.G. Irastorza, R.J. McDonald, A. Morales, E.B. Norman, A. Nucciotti, M. Pedretti, C. Pobes, V. Palmieri, M. Pavan, G. Pessina, S. Pirro, E. Previtali, C. Rosenfeld, S. Scopel, A.R. Smith, M. Sisti, G. Ventura, M. Vanzini, Astroparticle Physics 20 (2003) 91.
- [4] E.-I. Esch, T.J. Bowles, A. Hime, A. Pichlmaier, R. Reifarth, H. Wollnik, Nucl. Instrum. Methods A538 (2005) 516.
- [5] Teppo Jämsén, Master’s Thesis, 2005 (unpublished, in finnish).
- [6] Peter K.F. Grieder, Cosmic Rays at Earth – Researcher’s Reference Manual and Data Book, 1st edition (Elsevier Science, 2001), pp. 498-499.
- [7] J.A. Formaggio and C.J. Martoff, Annu. Rev. Nucl. Part. Sci 54 (2004) 361.