CLEO Collaboration
Searches for Violation and -wave in the Dalitz-Plot Analysis of
Abstract
In collisions recorded using the CLEO II.V detector we have studied the Cabibbo suppressed decay of with the initial flavor of the tagged by the decay . We use the Dalitz-plot analysis technique to measure the resonant substructure in this final state and observe and non-resonant contributions by fitting for their amplitudes and relative phases. We describe the -wave with a -matrix formalism and limit this contribution to the rate to be @ 95% confidence level, in contrast to the large rate observed in decay. Using the amplitudes and phases from this analysis, we calculate an integrated asymmetry of .
pacs:
13.25.FtThe light scalar meson sector is an enduring puzzle in QCD pdgscalar . Specifically the isospin zero, mesons are complex both theoretically and experimentally. The singly-Cabibbo suppressed decays of mesons are an excellent laboratory to test this sector. The final state consists of only and quarks and antiquarks so there is sufficient energy to cover most of the range of interest to light quark binding, and the initial state is simple with little impact on the final state. A better understanding of final state interactions in exclusive weak decays is needed in order to model rates, explain interesting phenomena such as mixing ref:hepph9802291 and elucidate the origin of violation in the sector Giri:2003ty .
Weak decays of mesons are expected to be dominated by resonant two body decays ref:bsw ; ref:bedaque ; ref:chau ; ref:terasaki ; Buccella . The well established Dalitz-plot analysis technique can be used to explore the resonant substructure which should be rich in isospin zero mesons. Recently the FOCUS collaboration studied the Dalitz plot focus3pi and observed a large -wave contribution using a -matrix formulation to describe to resonance structures. This letter describes a similar Dalitz-plot analysis of at CLEO in which -wave contributions are also expected. We have searched for such contributions using the -matrix formulation following what has been done by FOCUS and alternatively for resonance contributions from the scalar and mesons. We see no evidence for any -wave contribution in , and fully describe the Dalitz plot with contributions from resonances.
Standard Model (SM) predictions for the rate of violation in almost all charm meson decay modes is . However, for some singly Cabibbo suppressed decays of mesons such as , the SM predictions for the rate of violation are as large as 0.1% Buccella ; Santorelli , due to interference between tree and penguin processes.
Previous investigations MarkIII of this decay were limited by statistics and did not search for violation nor study the resonant substructure.
This analysis uses an integrated luminosity of 9.0 fb-1 of collisions at GeV provided by the Cornell Electron Storage Ring (CESR). The data were taken with the CLEO II.V detector cleoii ; cleoiiv .
We reconstruct candidates for the decay sequence , . Charge conjugation is implied throughout this Letter. The charge of the slow pion ( or ) identifies the charm state at as either or . To reduce background, we require the momentum to exceed 70% of its maximum value . The candidates are reconstructed from all pairs of electromagnetic showers that are not associated with charged tracks. To reduce the number of fake from random shower combinations we require that each shower has energy greater than 100 MeV and be in the barrel region of our detector. The two photon invariant mass is required to be MeV. To improve the mass resolution, the invariant mass is constrained to the known mass and we require the of this fit to be . We exploit the precision tracking of the silicon vertex detector cleoiiv by refitting the tracks with a requirement that they form a common vertex in three dimensions. We use the trajectory of the system and the position of the CESR luminous region to obtain the production point. We then refit the track with a requirement that the trajectory intersect the production point.
We reconstruct the energy released in the decay as , where is the reconstructed mass of the system, is the reconstructed mass of the system, and is the charged pion mass. The addition of the production point to the trajectory improves the resolution on by a factor of two. The distributions of and for our data are shown in Fig. 1. We fit the and distributions separately to a double Gaussian plus a background shape and find an average background fraction of %. We select 1917 candidates within 650 keV of the nominal value of , denoted as , and within 44 MeV/ of the nominal value of , both as measured in this analysis.
The efficiency for the selection described above is not uniform across the Dalitz-plot distribution (, ). We study the efficiency with a GEANT GEANT based simulation of the detector with a luminosity corresponding to more than twenty times our data sample. To measure the variation in efficiency over the Dalitz plot, we generate signal Monte Carlo uniformly populating the allowed phase space. We observe deviations from the uniform distribution due to momentum dependent reconstruction efficiency and inefficiencies near the edge of phase space. The average reconstruction efficiency is 3.7% but increases (decreases) to 4.5% (0.5%) for decays with high (low) momentum mesons. We fit the efficiency to a two dimensional cubic polynomial in (, ).
Figure 1 shows that the background is significant. To construct a model of the background shape, we consider events in the data in sidebands MeV and MeV within the signal region defined above. There are 2711 events in this selection, about eight times the amount of background we estimate from the signal region. The background is dominated by random combinations of unrelated tracks and showers. Although the background includes and mesons combined with random tracks and/or showers, these events will not interfere with each other or with resonances in the signal as they are not from a true . Additionally, events populate a narrow region on the Dalitz plot in both signal and background. The corresponding amplitudes do not interfere with the other amplitudes that contribute to due to the long lifetime of the . Therefore, the normalization of the contribution component floats in the fit, but has no further role. The background shape is parameterized by a two dimensional cubic polynomial in (, ) with terms representing and mesons.
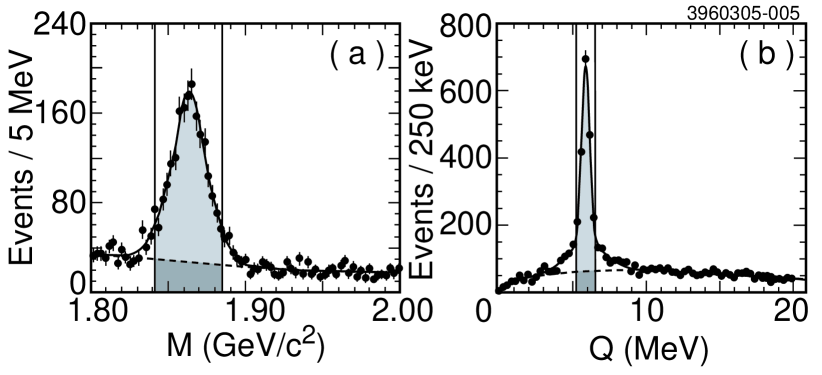
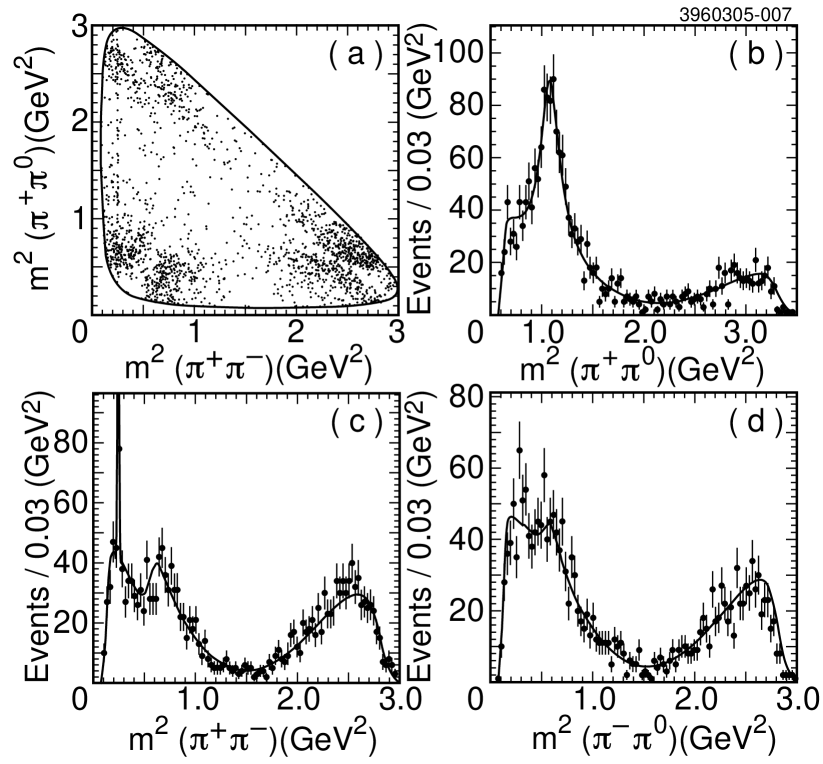
Figure 2 shows the Dalitz-plot distribution for the candidates. Only contributions from , and are readily apparent. Modeling the background shape and correcting for efficiency as described above, we then parameterize the Dalitz-plot distribution following the Breit-Wigner formalism using the unbinned likelihood method as described in Ref. tjb ; cleokspipi . In a separate fit, we also parameterize the S-wave with the -matrix formalism as described in Ref. focus3pi for the analysis of . We allow the normalization of the background contribution to float unconstrained in our fits. We consider seventeen resonant components, , , , , , , , , , , , , , , as well as a non-resonant contribution. All interfere coherently and we fit for a complex coefficient (amplitude and relative phase) for each resonance as well as for the non-resonant contribution. We describe the resonances with the standard parameters pdg . Lacking theoretical guidance, the non-resonant contribution is modeled as a uniform distribution across the allowed phase space.
This study is sensitive only to relative phases and amplitudes. The largest mode, , is assigned a zero phase and an amplitude of one. Since the choice of normalization, phase convention, and amplitude formalism may not always be identical for different experiments, fit fractions are reported in addition to amplitudes. The fit fraction is defined as the integral of a single component (resonant or non-resonant) over the Dalitz plot divided by the integral of the coherent sum of all components over the Dalitz plot tjb . The sum of the fit fractions for all components will in general not be unity because of interference.
We use the full covariance matrix from the fits to determine the statistical errors on fit fractions to properly include the correlated components of the uncertainty on the amplitudes and phases. After each fit, the covariance matrix and final parameter values are used to generate sample parameter sets. The distributions of fit fractions from these parameter sets are then used to determine the Gaussian width and 95% confidence level (C.L.) upper limits.
The results of our fits are presented in Table 1. Fit A includes the three resonances and an interfering non-resonant component. The non-resonant contribution is small and we do not find strong evidence for any other contributing resonances.
We fit the and samples separately in Fit B1 and Fit B2, respectively. The violation of could manifest as distinct amplitudes and phases for and Dalitz plots. Since Fits B1 and B2 are consistent, there is no indication of violation.
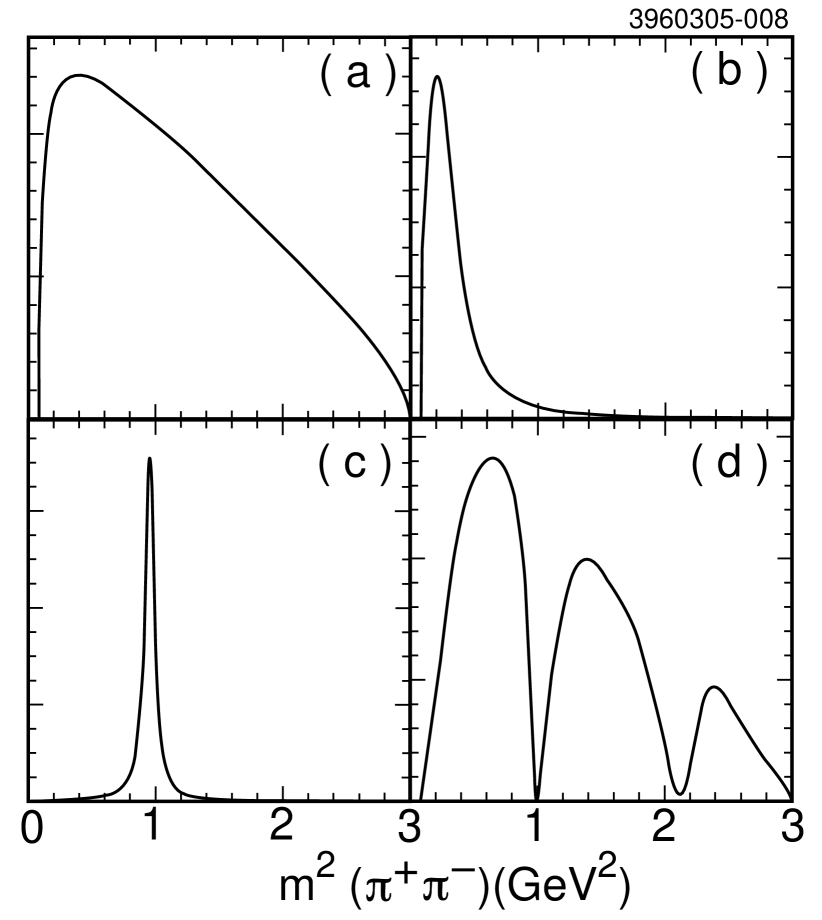
There has been significant interest in the properties of the -wave due to the possibility of a low mass meson and glueball of mass 1.5 GeV/, each of which are beyond the quark model qqbarmodel . A recent paper Oller highlights decay as a preferred way to focus on these states because of the preponderance of -waves in the initial and final state. Charged mesons are observed to decay preferentially to the -wave in the decay studied by FOCUS focus3pi and E791 e791 . We considered several possible contributions of a -wave component shown in Fig. 3. In Fit C1 we replace the flat non-resonant amplitude with a pdg contribution parameterized as a Breit-Wigner resonance. The contribution of is very small in our fit.
In Fit C2, we replace the with the where we use the mass and width determined from the single Breit-Wigner parameterization of E791 e791f0 . There are predictions Buccella for (BF=2.8%) and (BF=0.06%). The prediction for the latter decay is extremely small because of the non- nature of and strong final state interactions. We find a fit fraction of % for . Although statistical errors limit the precision of our result, it is clear that this decay is highly suppressed in agreement with the model.
The -wave has contributions from a number of overlapping resonances and there are several models which parameterize this wave from other reactions aumope ; sarantsev ; focus3pi . The complicated structure is much more amenable to a coupled channel formulation than Breit-Wigner models. In Fit D we consider a -wave contribution following the -matrix formalism of Au, Morgan, and Pennington aumope in addition to the resonant components of Fit A. As in Fit C1 and Fit C2, we exclude the non-resonant amplitude. Figure 2b-d shows the three projections of the Fit D. These fits are very similar to those of FOCUS focus3pi for . The fit fraction of the -wave component in Fit C1 is much less than that of E791 for the analogous fit to . For Fit D, our fit fraction, %, was very small when compared to the FOCUS value for decay, %. The observed ratio of -wave fit fractions in relative to is or C.L. - somewhat larger than the tree-level estimate of . The factors in the relative amplitudes of 3 and are due to color suppression and isospin, respectively.
The lack of evidence for a -wave in this analysis is interesting. The measured rates for the comparable reactions , %, and , %, are both given qualitatively by model calculations Buccella which provide values of 0.19% and 0.11%. A quark model with final state interactions is used to fit parameters to a few charm decays and then predict many others. The same model predicts a ratio of branching fractions (BF) for and of 46.7. Comparing the results from Ref. e791f0 and our Fit C2 we measure this ratio to be or @ 95% C.L.. Although the quantities measured in the experiments are not the same as what is calculated in the model, there is a strong likelihood that three-body decay data can provide interesting tests of the microscopic nature of the scalar states.
| Amplitude | Phase(∘) | Fit fraction(%) | |
| Fit A | |||
| (fixed) | (fixed) | ||
| NR | |||
| @ 95% C.L. | |||
| Fit B1 | |||
| (fixed) | (fixed) | ||
| NR | |||
| Fit B2 | |||
| (fixed) | (fixed) | ||
| NR | |||
| Fit C1 | |||
| (fixed) | (fixed) | ||
| @ 95% C.L. | |||
| Fit C2 | |||
| (fixed) | (fixed) | ||
| @ 95% C.L. | |||
| Fit D | |||
| (fixed) | (fixed) | ||
| -matrix | |||
| @ 95% C.L. | |||
We calculate an integrated asymmetry across the Dalitz plot as described in Ref. cpvkspipi as the difference between the integral of the coherent sum of all amplitudes across the Dalitz plot for and , respectively, divided by the sum of the integral of the coherent sum of all amplitudes across the Dalitz plot for and , respectively, divided by the area of the Dalitz plot. We obtain , where the errors are statistical and systematic, respectively.
We consider systematic uncertainties from experimental sources and from the decay model separately. Contributions to the experimental systematic uncertainties arise from our model of the background, the efficiency, the signal fraction and the event selection. Our general procedure is to change some aspect of Fit A or Fit D and interpret the change in the values of the amplitudes, phases, and fit fractions as an estimate of the systematic uncertainty. In Fit A and Fit D, we fix the coefficients of the background determined from a sideband region. To estimate the systematic uncertainty on this background shape we perform a fit with the coefficients allowed to float constrained by the covariance matrix of the background fit. We use the covariance matrix of the efficiency fit to estimate the systematic uncertainty due to the efficiency parameterization. We generate samples of efficiency parameters based on the covariance matrix and re-run the Dalitz-plot fit for each sample. We change selection criteria in the analysis to test whether our simulation properly models the efficiency. We vary the minimum daughter energy criteria, the cuts on and , and the minimum momentum fraction. We take the square root of the sample variance of the amplitudes, phases and fit fractions from the nominal result compared to the results in this series of fits as a measure of the experimental systematic uncertainty.
We consider the uncertainty arising from the choice of the -wave model included in the fit. We interpret the variation in the amplitudes, phases, and fit fractions in Fit A, C1, C2 and D as a modeling systematic uncertainty. We add the experimental and model systematic uncertainty in quadrature to obtain the total systematic uncertainty reported in Table 1.
In conclusion, we have analyzed the resonant substructure of the decay using the Dalitz-plot analysis technique. We observe the three resonant and a small non-resonant contribution. We find no evidence for a -wave contribution with either the Breit-Wigner or -matrix parameterization. We find which is the asymmetry between the and distributions integrated over the entire Dalitz plot to be .
We gratefully acknowledge the effort of the CESR staff in providing us with excellent luminosity and running conditions. This work was supported by the National Science Foundation and the U.S. Department of Energy.
References
- (1) See review on page 506-508 of S. Eidelman et al. [Particle Data Group Collab.], Phys. Lett. B 592, 1 (2004).
- (2) E. Golowich and A. Petrov, Phys. Lett. B 427, 172 (1998).
- (3) A. Giri, Y. Grossman, A. Soffer and J. Zupan, Phys. Rev. D 68, 054018 (2003).
- (4) M. Bauer, B. Stech, and M. Wirbel, Z. Phys. C 34, 103 (1987).
- (5) P. F. Bedaque, A. K. Das and V. S. Mathur, Phys. Rev. D 49, 269 (1994).
- (6) L.-L. Chau and H.-Y. Cheng, Phys. Rev. D 36, 137 (1987).
- (7) K. Terasaki, Int. J. Mod. Phys. A 10, 3207 (1995).
- (8) F. Buccella et al., Phys. Lett. B 379, 249 (1996).
- (9) P. Santorelli, arXiv:hep-ph/9608236.
- (10) R. M. Baltrusaitis et al. [MARK-III Collab.], Phys. Rev. Lett. 55, 150 (1985) [Erratum-ibid. 55, 639 (1985)].
- (11) J. M. Link et al. [FOCUS Collab.], Phys. Lett. B 585, 200 (2004).
- (12) Y. Kubota et al., [CLEO Collab.], Nucl. Instrum. Methods Phys. Res., Sect. A 320, 66 (1992).
- (13) T.S. Hill, Nucl. Instrum. Methods Phys. Res., Sect. A 418, 32 (1998).
- (14) GEANT manual, CERN Program Library Long Writeup W5013, Copyright CERN, Geneva, 1993.
- (15) S. Kopp et al. [CLEO Collab.], Phys. Rev. D 63, 092001 (2001).
- (16) H. Muramatsu et al. [CLEO Collab.], Phys. Rev. Lett. 89, 251802 (2002) [Erratum-ibid. 90, 059901 (2003)].
- (17) K. Hagiwara et al. [Particle Data Group Collab.], Phys. Rev. D 66, 010001 (2002).
- (18) See reviews on page 154 and 848 of S. Eidelman et al. [Particle Data Group Collab.], Phys. Lett. B 592, 1 (2004).
- (19) J. Oller, ePrint Archive: hep-ph/0411105.
- (20) E. M. Aitala et al. [E791 Collab.], Phys. Rev. Lett. 86, 770 (2001).
- (21) E. M. Aitala et al. [E791 Collab.], Phys. Rev. Lett. 86, 765 (2001).
- (22) K. L. Au, D. Morgan, and M. R. Pennington, Phys. Rev. D35, 1633 (1987).
- (23) V. V. Anisovich and A. V. Sarantsev, Eur. Phys. A 16, 229 (2003).
- (24) D. M. Asner et al. [CLEO Collab.], Phys. Rev. D 70, 091101 (2004).