physics at the DØ Experiment at Fermilab
Vivek Jain
Department of Physics, State University of New York,
Albany, NY
Abstract
We discuss recent physics results from the DØ experiment at Fermilab111Invited review article to appear in Modern Physics Letters A.. The results presented here use data sets with integrated luminosities ranging from pb-1, collected at the Tevatron, between April 2002 and August 2004, at a center of mass energy of collisions of 1.96 TeV.
PACS Nos.: 13.20.He, 13.25.Hw, 14.20.Mr, 14.40.Nd, 14.40.Gx
1 Introduction
An understanding of flavour dynamics is crucial since any unified theory will have to account for the presence of three left-handed families, measured mixing angles and masses of various quarks and hadrons, etc. The study of bottom hadrons provides unique insights into the nature of the weak as well as the strong interaction, and also provides a window into beyond-Standard Model (BSM) effects[1].
The study of bottom hadrons at the Fermilab Tevatron ( collisions at a center of mass energy of 1.96 TeV) has many advantages over that at the currently operating “-factories” at SLAC and KEK, viz., the production cross-section of quarks is about 150,000 times larger, and all species of bottom hadrons are produced.222Although all -hadron species were also produced at LEP, at the Tevatron is about 20,000 times larger. However, experimental conditions are not as clean; for instance, the total cross-section is more than two orders of magnitude larger than that for production. This implies that experiments at the Tevatron are crucially dependent on designing appropriate triggers; the collision rate at DØ is about 2.5 MHz, whereas the experiment can only write out data at about 50-100 Hz.
The physics program at DØ is designed to be complementary to the program at the -factories at SLAC and KEK and includes studies of oscillations, searches for rare decays such as , spectroscopy, e.g., , lifetimes of hadrons, search for the lifetime difference in the CP eigenstates, study of beauty baryons, mesons, quarkonia (, , ), b production cross-section, etc.
One of the more important topics in physics is the search for mixing. Global fits, assuming that the CKM matrix is unitary and the Standard Model (SM) is correct, indicate that the 95% CL interval[2] for the mixing frequency, , is [14.2-28.1] ps-1. The current limit333The limit is derived by combining limits from 13 different measurements. is at the 95% CL[2]. A measured value of much larger than the upper limits given here could imply new physics contributing to the box diagrams, e.g., extra Higgs bosons or squarks and/or gluinos[3].
2 DØ detector
For the current run of the Tevatron (Run II), the DØ detector went through a major upgrade[4]. The inner tracking system was completely revamped. The detector now includes a Silicon tracker, surrounded by a Scintillating Fiber tracker, both of which are immersed in a 2 Tesla solenoidal magnetic field. Pre-shower counters, to aid in electron and photon identification are located before the calorimeter. The muon system has also been improved, e.g. more shielding was added to reduce beam background. New trigger and data acquisition systems were also installed.
The DØ detector has excellent tracking and lepton acceptance. Tracks with pseudo-rapidity () as large as 2.5 () and transverse momentum () as low as 180 MeV/c are reconstructed.
The muon system can identify muons within . The minimum pT of the reconstructed muons varies as a function of . In most of the results presented here, we required muons to have GeV/c. Low pT electron identification is being worked on, currently we are limited to GeV/c and ; however, we are working to improve both the momentum and coverage.
DØ employs a three level trigger. Triggers at Level 1, which are formed by individual detector sub-systems, and Level 2, where they are further refined, are constructed using custom hardware. At Level 3, the entire event is read out by a farm of computers which perform a simplified event reconstruction to further refine the selection criteria for interesting events. Currently, the input rate to Level 1 is 2.5 MHz and the output is 1600 Hz; the output rates for Level 2 and 3 are 800 Hz and 60 Hz respectively. Improvements are foreseen that could improve the output rates to 2-2.5 kHz, 1.2 kHz and 100 Hz for Levels 1, 2 and 3, respectively.
3 Data Sample
The results presented here are based on data collected between April 2002 and August 2004. The data correspond to an integrated luminosity of about 440 pb-1, however the analyses presented here used anywhere from 200-440 pb-1. Events enriched in hadrons were collected with a dimuon and single muon triggers. To reduce the data rate, a luminosity dependent prescale was applied to the single muon trigger (the prescale was 1 for instantaneous ). Both triggers require that muons have hits in all layers of the muon system which implies that they have total momentum GeV.
Many of these results have been accepted for publication. Details on the other analyses can be found on the DØ physics group web page[5].
4 New Particles
We first review results dealing with particles which either have never been seen before or have been recently observed, viz., and .
4.1 X(3872)
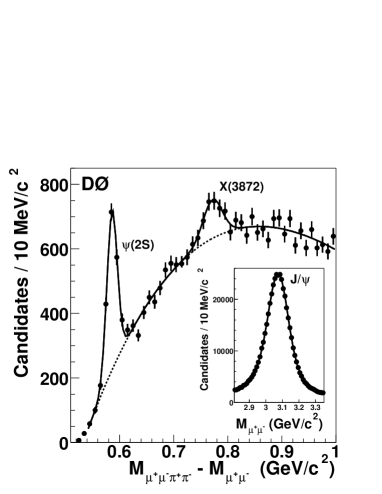
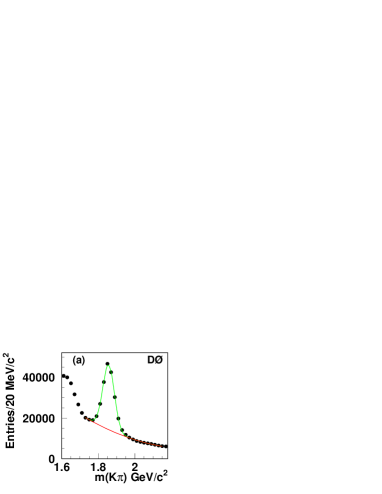
X(3872) was first observed by the Belle collaboration[6] via , and was subsequently observed (inclusively) by the CDF collaboration[6] in collisions (in the same final state). In Fig. 1(a), we present evidence for , observed by the DØ collaboration[7]; the inset shows the mass distribution of candidates. To improve resolution, the mass difference is used. We observe candidates and measure MeV/c2; this value is consistent with other measurements of and is based on an integrated luminosity of 230 pb-1.
(a)
(b)
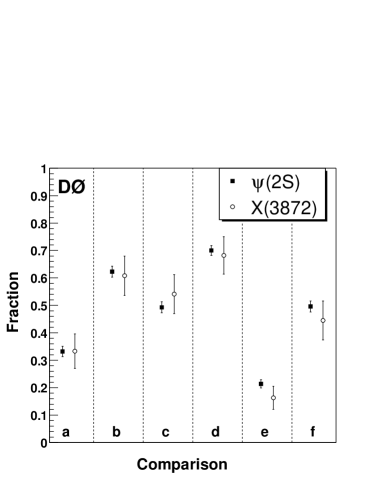
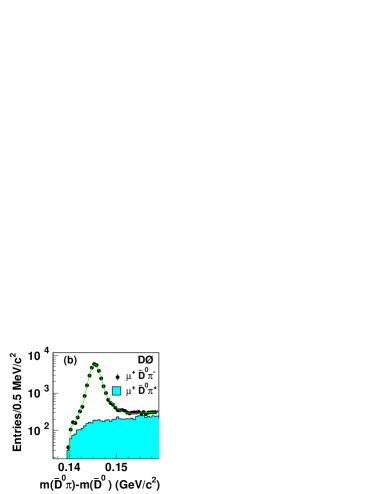
It is not known whether the X(3872) is a normal charmonium state or something more exotic, e.g., molecule or hybrid[8]. To understand its nature we compare some of its production and decay properties with the well-known charmonium state [9], which can also be seen in Fig 1(a). In Fig. 1(b), we present the fraction of X(3872) () candidates which satisfy certain criteria, (a) GeV/c, (b) rapidity, , (c) helicity of the system, , (d) effective proper decay length cm, (e) Isolation444Isolation is defined as the ratio of the of the to that of the and all other particles within a cone of 0.7 = 1 and (f) helicity of the system, . In all these variables, the X(3872) appears to behave like the .
Other studies include searching for the charged partner, e.g., or for radiative decays like ; a signal for the former would rule out the charmonium hypothesis whereas a signal for the latter would confirm it as a charmonium state.
4.2 P-wave mesons:
Hadrons which contain one heavy quark, , are subject to additional QCD symmetries. As , the heavy quark decouples and the properties of the hadron are given by light degrees of freedom(Ldof), i.e., light quark(s) and gluons; this is known as Heavy Quark Symmetry (HQS)[10]. In this limit, mesons belong to degenerate doublets given by , where are the total angular momenta of the meson and the Ldof, and are their respective parities; also, , where is the spin of the Ldof and is the angular momentum between the Ldof and the heavy quark. Degeneracy is broken due to finite and so the effect is larger for charm mesons than bottom mesons.
gives one doublet with and which corresponds to the well-measured mesons[9]. For , we get two doublets denoted as and ; collectively, these four mesons are referred to as mesons. Angular momentum and parity conservation constrains the strong decays of the mesons, with the state expected to decay to , states to and state to and ; decay via S-wave and are expected to be broad while states decay via D-wave and are expected to be narrow.
In the case of (non-strange) charm mesons all four states have been observed, and their behaviour agrees with expectations[9, 11]. On the other hand, the case of charm-strange mesons states is more interesting. The doublet decays to the favoured final states[9], whereas the states were lighter than expected and could only decay to final states[12]; this also causes them to be narrower than expected[13].
(a)
(b)
In the case of , an excess of events has been observed with an average mass of MeV/c2, although the four states have not been individually observed[9]; in addition, only one of the experiments exclusively reconstructed the meson.
We use our large sample of fully reconstructed mesons, (a) (Fig 2(a)), (b) and (c) to search for the narrow mesons; in pb-1 of data, we have the following yields, (a) , (b) and (c) . Since the mass difference between and is expected to be small, we add all three modes and perform a combined search. In addition, to reduce resolution effects, we plot the mass difference, , where the is required to be consistent with coming from the primary vertex.
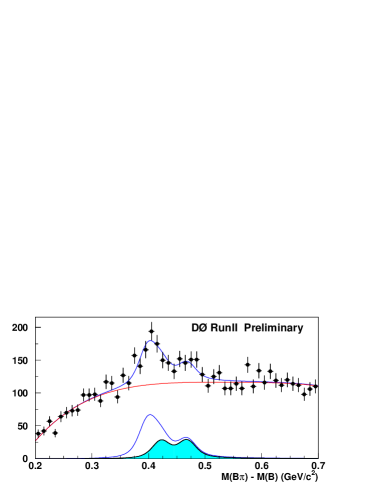
The mass difference plot, as shown in Fig. 2(b) has a structure consistent with three components which correspond to the two states, and (which make up the doublet), (a) , (b) and (c) . The decays to a final state and the soft photon (in the c.m. MeV) is not observed. This causes from the (a) and (b) to be shifted down by 46 MeV while it is in the correct place for (c). Allowing for all three of these sources in the final fit, we observe a total of events. Using input from HQS, we assign to (a) and events each to (b) and (c). In addition, we measure MeV/c2, MeV/c2, and assuming that we obtain MeV for the natural widths, in agreement with theoretical expectations[14]. This is the first observation of the narrow states.
Future studies will include separate fits for and , measuring the production rate of mesons relative to mesons, measurement of the spin-parity of these states, and a search for .
4.3 meson
The meson consisting of a and a quark is the heaviest of the flavoured ground state mesons that can exist; the top quark decays before it can hadronize into a meson. Since it consists of two heavy quarks, theoretical tools used to describe and mesons can be employed in its study[15]. The meson has non-zero flavour and thus it only has weak decays. It has been observed by the CDF collaboration[16]; the yield was events in pb-1 of collisions. The lifetime is expected to be closer to charm hadron lifetimes ( ps) than to those of other beauty hadrons ().
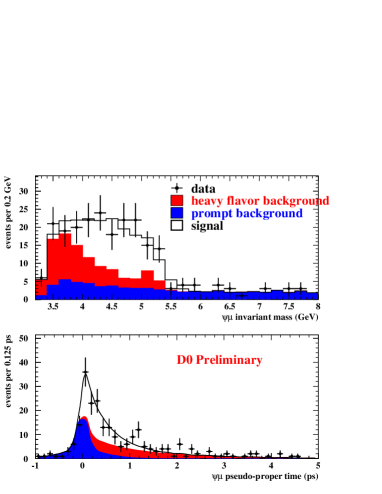
A particularly attractive mode for its observation at DØ is the semileptonic decay, ; the presence of three muons in the final state makes it easy to trigger on. In addition, backgrounds (branching fraction) are expected to be lower (higher) than for the exclusive mode, . However, due to missing particles in the final state, e.g., neutrino (and maybe pions), the determination of the mass and lifetime has to rely on Monte Carlo simulations based on the ISGW model[17]. Systematic effects are studied by using different decay models, e.g., V-A, etc.
(a)
(b)
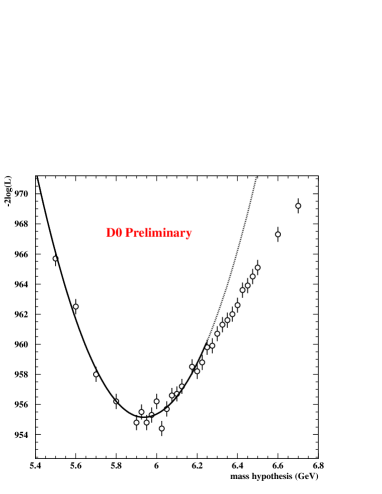
We use pb-1 of data to study this particle[18]. We combine a and a muon to form candidates; a background sample consisting of a and one track (which is not a muon) is also formed. The latter sample is used to study the heavy flavour background. Since there are missing particles in the final state, the momentum of the system must be corrected to account for them. A simultaneous fit to the mass and pseudo-proper decay time555This is converted to the true proper decay time by the application of a correction factor to account for missing particles. of the system is performed and the results are shown in Fig. 3(a). In Fig. 3(b), we show the distribution of -2log(likelihood) from the combined fit at a variety of mass hypotheses. A clear minimum is observed at 5.95 GeV/c2.
5 Beyond Standard Model studies
Purely leptonic decays of the B meson, e.g., , are examples of Flavour Changing Neutral Currents (FCNC). In the SM, such decays are forbidden at tree level and proceed through the higher order box diagrams, and consequently have very low rates. For instance, is expected[19] to be , whereas the previous best experimental limit[20] is at the 90% C.L.
Such modes are very interesting because in many BSM models, e.g. 2-Higgs Doublet, Super Symmetry, mSUGRA models, Grand Unified theories based on SO(10) etc., the rate can be enhanced by as much as much as three orders of magnitude[21].
(a)
(b)
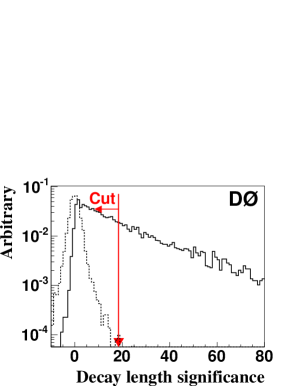
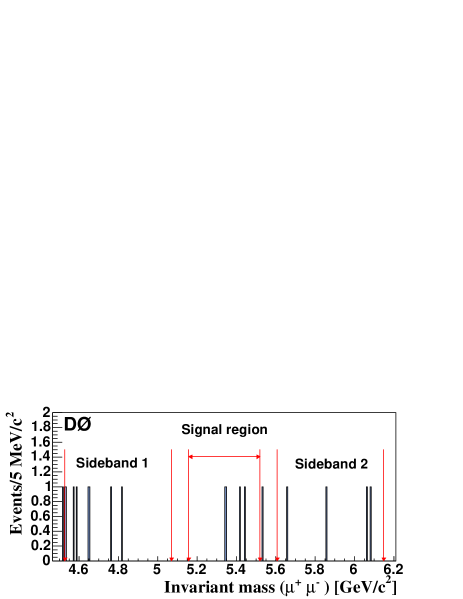
We use 240 pb-1 of data to search for this decay mode[22]. After the initial (pre)selection criteria e.g. muon quality, vertex consistency, , etc., we use three additional variables to discriminate signal-like events from background, (a) Decay Length significance () of the vertex, (b) Isolation of the pair, and (c) Angle between the momentum and decay vector. These three variables were optimized using a Monte Carlo for the signal and mass sidebands in data for estimating the background. In Fig. 4(a), we show the results for one of these variables, the optimal cut value is , as indicated by the arrow. After all (optimized) selection criteria, the prediction is that in the () mass region around the , there should be background events. With these selection criteria, we observe 4 events, as shown in Fig. 4(b).
To determine an upper limit, we use as a normalizing mode; the relative fragmentation of the b quark into and has to be taken into account. We set an upper limit, at the 90% C.L., which is currently the most stringent limit.
6 Lifetimes
An understanding of the pattern of lifetimes of heavy hadrons provides insight into non-perturbative QCD. In the last few years, theoretical tools using a rigorous approach based on the heavy quark expansion (in inverse powers of the heavy quark mass) have been developed[23]. Predictions for bottom hadrons are on a much firmer footing than for charm hadrons. Theoretical errors are further reduced on predictions for ratios of lifetimes[24]; for instance, .
6.1 Measurement of
Using a large sample of B semi-leptonic decays in 440 pb-1 of data, DØ has made a precision measurement of [25]. B mesons were detected via the mode (which had events), and categorized as the “” or the “” sample; the former contains identified events and is dominated by candidates while the latter contains the remaining events and is dominated by events. The ratio of events in the two samples as a function of proper time is primarily a function of the lifetime difference between the and the .
(a)
(b)
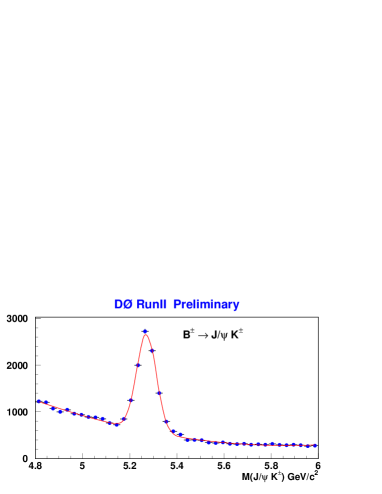
In Fig. 5, we show the invariant mass distributions for and candidates, where they have been combined with a muon of the correct charge, e.g., . Fig. 5(b) also shows the wrong-sign spectrum; as expected there is no peak.
Candidate events are classified as and right (and wrong) sign . From these categories, we determine the number of true and events in eight bins of visible proper decay length (VPDL), where , and calculate the ratio, . is the transverse decay length of the vertex relative to the primary vertex, and is the transverse momentum. To avoid any biases, for both and samples, the soft pion is not used for determining VPDL or .
Next we determine the expected ratio of events in each VPDL bin and minimize, , where the lifetime ratio, , and the efficiency of the slow pion are free parameters. The ’s are determined ab initio using semi-leptonic branching fractions, detector resolution, a Monte Carlo simulation to account for missing particles, reconstruction efficiencies, and the world average for the lifetime; lifetime, , is expressed as .
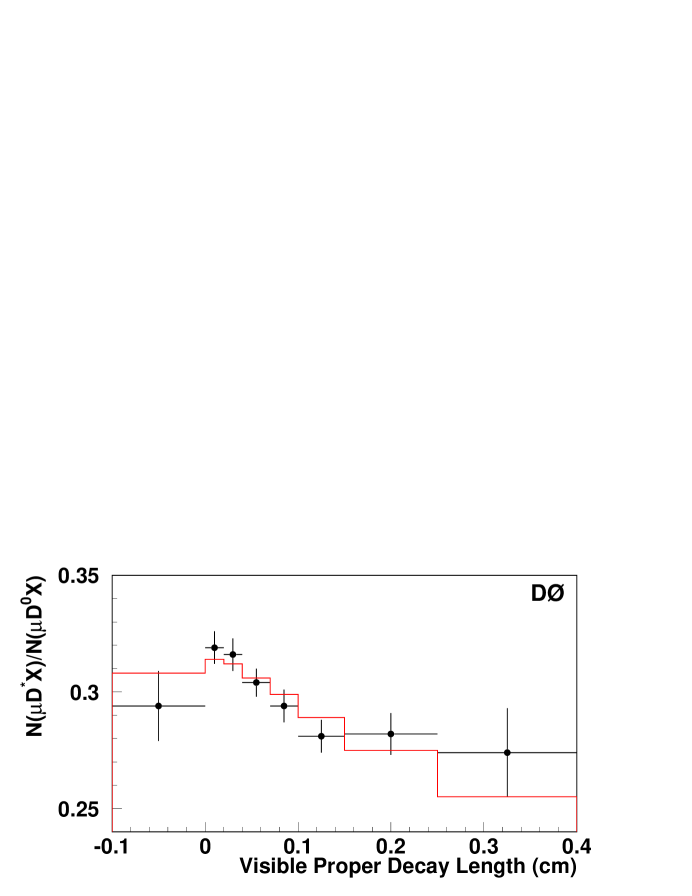
Minimization of the distribution gives, . In Fig. 6, we show as a function of VPDL; the fit results are overlaid. The systematic uncertainty includes uncertainties on branching fractions, reconstruction efficiencies, detector resolutions, etc.
6.2 Measurement of
Theoretical predictions for the ratio, ( with errors )[26], have always been somewhat higher than experimental results[9], (). One possible source for the discrepancy could be that all previous measurements used partially reconstructed , which required one to use Monte Carlo simulations to correct for missing particles, e.g., etc.. Since decays have not been studied in detail, this correction process makes the result model dependent.
We measure , via the fully reconstructed decay, , with , using pb-1 of integrated luminosity. For comparison, is measured using the mode (); the two modes have similar topology. We reconstruct and events, respectively[27].
(a)
(b)
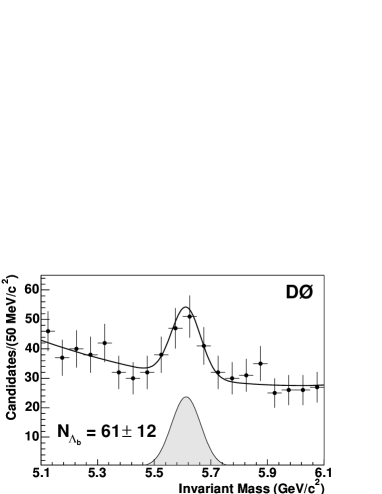
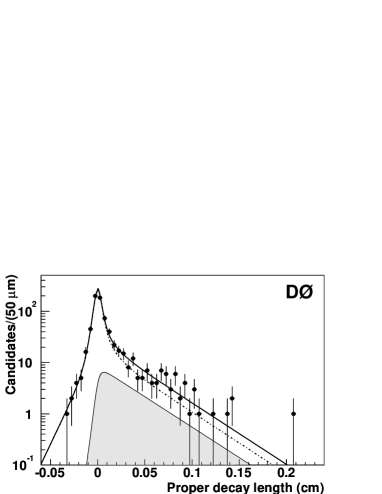
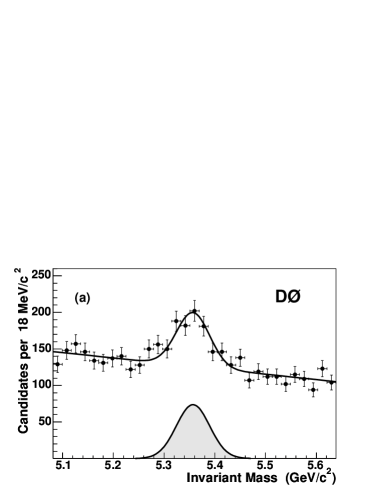
In Fig. 7(a), we show the mass distribution of the candidate events, and in Fig. 7(b) their proper decay lengths are presented.
The lifetime was obtained by performing a unbinned likelihood fit using both the mass and the lifetime of candidate events. We used all events in the mass range 5.1-6.1 GeV/c2 for (4.9-5.7 GeV/c2 for ). Different functions were used to model the lifetime (and mass) of signal and background events.
We obtain, and . This is the first time that the lifetime has been measured in an exclusive channel; our result agrees with previous measurements[9]. We also obtain, . The current statistical error on the ratio is too large to draw any conclusions, however this error will decrease as more data is processed. The systematic uncertainty includes contributions from Silicon alignment uncertainties, models used for signal and background and cross-feed between the and modes.
6.3 Measurement of
Theoretical calculations predict [23, 24]. The CP eigenstates of the system are expected to have different lifetimes[28]; predictions for are . This difference can be probed by comparing the lifetime measured using the semi-leptonic final state (which has equal mixtures of the two CP states) and using a decay like (which is expected to be dominantly CP even). Alternatively, one could directly measure the lifetime difference using the mode; this analysis has recently been performed by the CDF collaboration and they find [29].
Using pb-1 of integrated luminosity, DØ has measured the lifetime reconstructed in the final state[30]. In this analysis, we fit the lifetime with a single exponential, i.e., under the assumption . For comparison, we also measure lifetime using the final state , which has similar topology; the two modes have 337 and 1370 signal events, respectively.
(a)
(b)
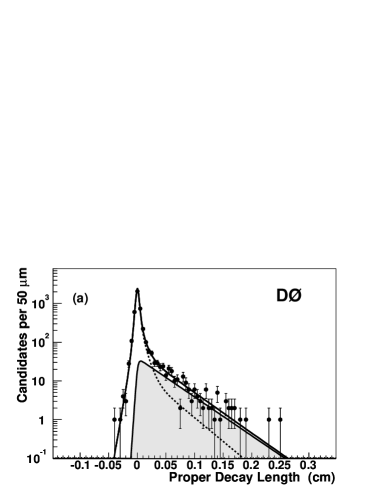
In Fig. 8(a), we show the mass distribution of the candidate events, and in Fig. 8(b) their proper decay lengths are presented. The measurement technique is the same as the one used in the lifetime analysis.
We find and Both results are consistent with world averages.666Since the average ()[9] is dominated by measurements made using semi-leptonic final states, our result appears to prefer a low value for . In addition, we also measure, , which is in agreement with theoretical predictions.
7 Mixing
The phenomenon of particle-antiparticle mixing has yielded many unexpected results and has provided the impetus for significant progress in the field. For instance, the large rate of mixing in implied that the top quark was much heavier than previously expected and mixing taught us about CP violation. Quark mixing occurs at the one-loop level via “box” diagrams and heavy particles (in the loop) tend to have enormous influence[31].
The study of mixing has a twofold purpose. Given the previous successes of mixing induced processes, one could hope for a surprise. Failing an unexpected result, the measurement of the rate of mixing will aid in reducing the error on the measurement of the CKM element [9]. If our current understanding of the Standard Model and the CKM matrix are correct[2], then oscillations should occur with a frequency, , in the (95% CL) interval (14.2-28.1) ps-1. A deviation could be a sign of new physics. Additionally, if the mixing parameter, is very large then the difference in the widths of the CP eigenstates of the may be detectable.777This analysis is in progress.
B oscillations are observed by comparing the proper time evolution of events where a neutral B-hadron decays as a particle of the opposite flavor from that with which it was produced (mixed B) to those where the B-hadron’s production and decay flavors are the same (unmixed B). To study oscillations we therefore need three ingredients, (a) final state reconstruction, (b) ability to measure decay lengths, and (c) flavour tagging of the both at production and decay.
The significance of a mixing measurement can be expressed as,
| (1) |
where is the number of reconstructed events, is a measure of how well we know the flavour of the at production; is the efficiency of the tag, and , the dilution is defined as , where is the probability of mis-identifying the flavour of the B-hadron at production. is the proper time resolution, and expresses signal purity. It is clear that as gets larger, the importance of good proper time resolution increases.
At D0, B-mixing is studied mainly using semileptonic and decays, although a fully hadronic Bs decay mode analysis is in progress. The advantage of using semi-leptonic events vis-a-vis (fully reconstructed) hadronic events is that the branching fraction for the former is much larger than for the latter; the total rate for is , whereas the rate for is . The disadvantage of using semi-leptonic is that due to missing particles, the proper time resolution is worse.
(a)
(b)
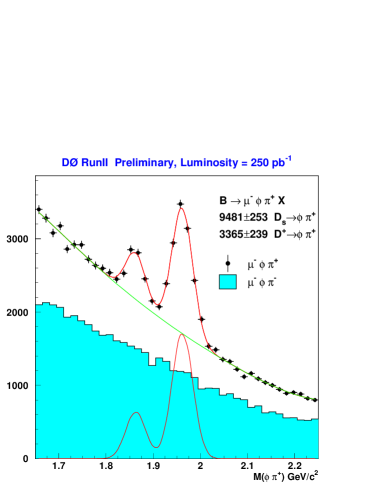
In Fig. 9, we present the inclusive signal for (a) using 250 and (b) using 200 . The peaks at the mass are dominated by decays.
The next component needed for a mixing measurement is knowledge of the flavour of the hadron at the time of production and decay. By using flavour-specific decays, one can easily tag the flavour at the time of decay. To tag the flavour at production we use the following techniques,
-
•
Soft Lepton Tagging: The sign of the lepton produced in the semi-leptonic decay of the other in the event is used to tag the flavour of the signal . We then make the assumption that (at production) the flavour of the signal is opposite to that of the tag . This method has low efficiency, but very high tagging power. We are also using electrons, although those results are not final as yet.
-
•
Jet Charge Tagging: We take all tracks opposite to the signal and form a track jet, and measure its charge. The assumption is that these tracks are produced in the fragmentation of the other b-quark, as well as in the decay of the tag hadron. This method has high efficiency, but has poorer tagging power.
-
•
Same Side Tagging: In this technique, we identify particles produced in the fragmentation of the b-quark which gives rise to the signal . In addition, the signal B can come from a resonance, e.g., B, and the charge of such pions is correlated with the flavour of the signal B at the time of production. This method has high efficiency, but has poorer tagging power.
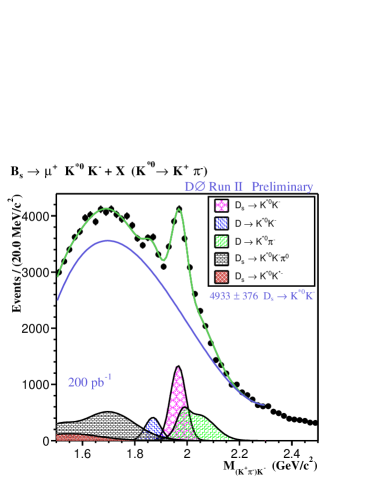
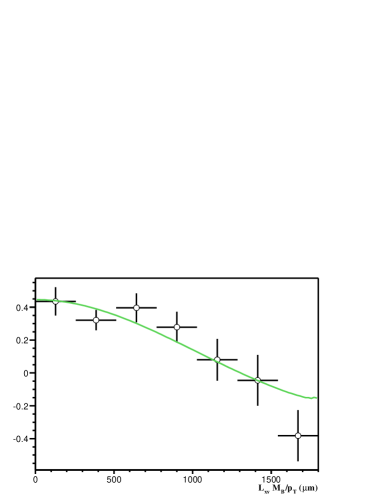
We have tested our analysis by measuring the mixing parameter for , i.e., ; we use pb-1 for this study. In Fig. 10, we show the asymmetry as a function of visible proper decay length, where the asymmetry, , is defined as ; are the numbers of unmixed (mixed) events in the various time bins. In this analysis, we use the decay mode events. In (a), we show the asymmetry for events tagged with a soft muon, whereas in (b) we show the asymmetry for events tagged with a combination of Jet Charge and Same Side taggers. A simultaneous fit to the two distributions in Fig. 10 yields , which is in agreement with the world average[9]. We also get the efficiency and dilution for the two tags to be, (a) and , (b) and , respectively.
Since is much larger than , it is clear from Eq. (1) that the critical element is the proper time resolution. Work is underway to improve the resolution for semi-leptonic final states.
We also have other improvements in the pipeline that will have significant impact on the analysis: (a) A new layer of silicon sensors will be installed at a radius of 2.5 cm. This is expected to improve the proper time resolution by about 25%, (b) An increase in the trigger bandwidth will enable us to increase the yield of “B-rich” events many-fold, and (c) Improved triggers will enrich the data with hadronic decays.
(a)

(b)
8 Conclusions
The D0 detector has started to produce very competitive results in the field of physics. We have already recorded pb-1 of data and hope to collect by the end of 2005 and by the end of 2007 (2009).
As a stepping stone to mixing, we have measured to benchmark our analyses techniques. In addition, we are pursuing a vigorous program which includes measurement of lifetimes, rare decays, studies of quarkonia[32], beauty baryons and .
Acknowledgments
I would like to thank Hal Evans, Brad Abbott and Jesse Ernst for stimulating discussions.
References
- [1] Excellent reviews of B physics can be found in (a) BaBar Physics Handbook at http://www.slac.stanford.edu/pubs/slacreports/slac-r-504.html; (b) B Physics at the Tevatron: Run II and beyond, http://xxx.lanl.gov/ - hep-ph/0201071; (c) A.G. Akeroyd et al., “Physics at Super B factory”, http://xxx.lanl.gov/ - hep-ex/0406071 and in references therein.
- [2] M. Battaglia, et al., “The CKM matrix and the unitarity triangle”, Tech. rep., hep-ph/0304132 (2003).
- [3] Private communication with Ulrich Nierste.
- [4] V. Abazov, et al., DØ Collab., “The Upgraded DØ Detector”, in preparation for submission to Nucl. Instrum. Meth. Phys. Res. A; T. LeCompte and H.T. Diehl, “The CDF and DØ upgrades for Run II”,Ann. Rev. Nucl. Part. Sci. 50, 71 (2000).
- [5] http://www-d0.fnal.gov/Run2Physics/ckm/Approved_results/index2.html
-
[6]
Belle Collaboration, S.K. Choi et al., Phys. Rev. Lett. 91, 262001 (2003);
CDF Collaboration, D. Acosta et al., Phys. Rev. Lett. 93 072001 (2004) - [7] DØ Collaboration, V.M. Abazov et al., Phys. Rev. Lett. 93 162002 (2004)
- [8] E. J. Eichten, K. Lane and C. Quigg, Phys. Rev. D 69, 094019 (2004) and references therein.
- [9] S. Eidelman et al., Phys. Lett B 592, 1 (2004)
- [10] A recent review can be found in N. Isgur, Phys. Rev. D 57, 4041 (1998). More details can be found in the references therein.
- [11] Belle Collaboration, K. Abe et al., Phys. Rev. D 69, 112002 (2004)
-
[12]
BaBar Collaboration, B. Aubert et al.,
Phys. Rev. Lett 90, 242001 (2003);
CLEO Collaboration, D. Besson et al., Phys. Rev. D68, 032002 (2003) - [13] For instance, see E. Eichten’s talk at the International Conference on Hyperons, Charm and Bottom Hadrons, Illinois Institute of Technology, Chicago, USA, June 27-July 3, 2004.
- [14] For instance, see predictions in E.J. Eichten, C.T. Hill and C. Quigg, Phys. Rev. Lett. 71, 4116 (1993)
-
[15]
Recent reviews can be found in D. Ebert et
al., Phys. Rev D 68, 094020 (2003);
M. Beneke, et al., Phys. Rev. D 53, 4991 (1996);
I.I. Bigi Nucl. Instrum. Meth. A 351 240-247 (1994) and in references therein. - [16] CDF Collaboration, F. Abe et al., Phys. Rev. D 58, 112004 (1998).
- [17] D. Scora et al., Phys. Rev. D 52, 2783 (1995)
-
[18]
D0 Collaboration, D0Note 4539-CONF, Aug. 16, 2004. Available at
http://www-d0.fnal.gov/Run2Physics/WWW/results/prelim/B/B12/B12.pdf - [19] A.J. Buras, Phys. Lett. B 566, 115 (2003)
- [20] CDF Collaboration, D. Acosta et al., Phys. Rev. Lett. 93, 032001 (2004)
- [21] Please see references [5]-[11] in V.M. Abazov et al., FERMILAB-Pub-04/215-E, hep-ex/0410039 (2004)
- [22] DØ Collaboration, V.M. Abazov et al., FERMILAB-Pub-04/215-E (hep-ex/0410039). Accepted in Phys. Rev. Lett.
- [23] N. Uraltsev, in At the Frontier of Particle Physics: Handbook of QCD, edited by M. Shifman (World Scientific, Singapore, 2001), hep-ph/0010328 (2001); G. Bellini, I.I. Bigi, P.J. Dornan, Phys. Rep. 289, 1 (1997)
-
[24]
C. Tarantino et al., Eur. Phys. J. C33
(2004) S895-S899, hep-ph/0310241 (2003);
Other estimates can be found in Gabbiani et al., Phys. Rev. D70, 094031 (2004) - [25] DØ Collaboration, V.M. Abazov et al., FERMILAB-Pub-04/284-E (hep-ex/0410052). Submitted to Phys. Rev. Lett.
-
[26]
Please see references [3], [5] and [6] in V.M. Abazov et al., Phys. Rev. Lett. 94, 102001 (2005);
P. Colangelo and F. De Fazio, Phys. Lett. B 387, 371 (1996) - [27] V.M. Abazov et al., Phys. Rev. Lett. 94, 102001(2005)
- [28] I. Bigi et al. in “B Decays”, 2nd edition, edited by S. Stone (World Scientific, Singapore 1994) p. 13 ; I. Dunietz, Phys. Rev. D 52, 3048 (1995); M. Beneke, G. Buchalla, I. Dunietz, Phys. Rev. D 54, 4419 (1996)
- [29] CDF Collaboration, D. Acosta et al., hep-ex/0412057
- [30] V.M. Abazov et al., Phys. Rev. Lett. 94 042001, (2005)
- [31] See A. J. Buras and R. Fleischer, hep-ph/9704376 for a comprehensive exposition of quark mixing and other related topics
-
[32]
D0 Collaboration, D0Note 4523-CONF, Aug. 2,
2004. Submitted to Phys. Rev. Lett. Available at
http://www-d0.fnal.gov/Run2Physics/WWW/results/prelim/B/B09/B09.pdf;
A comprehensive review of latest theory and experimental results on Quarkonia can be found in the CERN Yellow report by the Quarkonium Working Group - hep-ph/0412158