The Design and Performance of the MINERA Detector
Abstract
The MINERA experiment is designed to make precision measurements of various neutrino cross sections in the low energy regime. We describe the detector and give the performance of some of the measured quantities.
1 The Goals of the MINERA Detector
The MINERA detector [1] is a fine-grain neutrino detector, which sits in the NuMI beam line. The MINERA detector must be able to reconstruct exclusive final states. This requires high granularity for charged particle tracking, particle ID, and low momentum thresholds. The detector must contain both electromagnetic and hadronic showers and measure muon momentum. Hence, the fiducial volume of the detector should be fine grained, fully active, and surrounded by calorimeters. To measure nuclear effects, the detector should contain targets of different nuclei.
2 The MINERA Detector
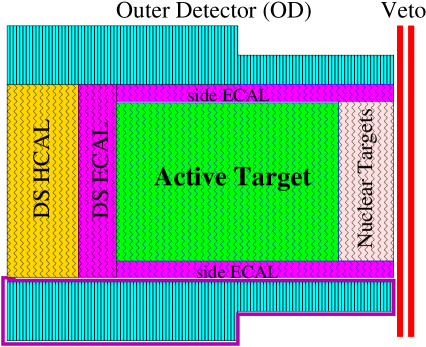
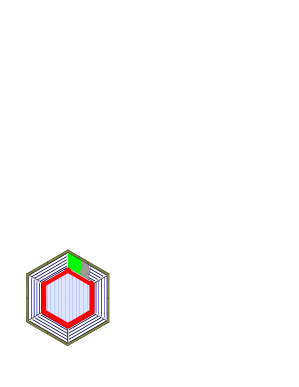
Figure 1 shows a schematic view of the MINERA detector. The various sub-detectors include the active target, the nuclear targets, the downstream and side ECAL, the downstream and side HCAL, and the veto. The detector is 3.88 m across, 4.48 m high, and 4.7 m long.
The inner active target consists of fully active scintillating strips read out by wave length shifting (WLS) fibers. The active target has 6 tons of plastic with 3-5 tons of fiducial volume, depending upon the physics process. The scintillating strips are extruded triangular strips with a 3.3 cm base and 1.7 cm height. The strips are triangular to improve the coordinate resolution by using light sharing between adjacent strips. The active target strips are organized in modules which have 4 planes. Each plane is shaped as a hexagon with 128 strips. The hexagon shape enables the planes to have orientations which differ by 60∘. The orientation of the planes for a module is X, U, X, V. The X layers seed the track reconstruction, and the U V stereo layers identity and reconstruct the three dimensional tracks.
The downstream and side calorimeters yield the calorimetic energy of the events. These sampling detectors use the same scintillating strips as the active target. The side ECAL has 2 mm lead plates mounted on the frames and extend 15 cm into the central scintillator region, see Figure 1. The side HCAL acts as a frame for the active target. The side HCAL has 6 scintillator layers with 50 cm of steel between the active target and the outer most scintillator strip. The upstream parts of the side HCAL has 4 active elements with a total of 30 cm of steel between the active target and the outer most scintillator strip. The downstream ECAL calorimeter has 20 planes of scintillator with 5/16” lead plates attached in front of each plane. The downstream HCAL consists of 20 planes of scintillator with 1” thick steel plates in front of each plane. The bottom of the right side of Figure 1 shows holes for the magnetic coil. The coils provide a field of 1.6 Tesla in the side HCAL.
The upstream nuclear targets has 3 plates each of graphite, steel, and lead, for a total of 9 plates of nuclear targets. The nuclear targets have 1/2, 1, and 1 fiducial tons of graphite, steel, and lead, respectively. The graphite target (pure carbon) provides consistency check for the scintillator target (carbon and hydrogen). Between each plate are 4 planes of scintillator. The nuclear targets section also serves as the upstream calorimeters.
Hamamatsu R7600U-00-M64 PMTs (64 channel multi-anode photo multiplier tubes) collect the scintillation light from the optical fibers. These tubes are very similar to the PMTs used by the MINOS Near Detector. The PMTs provide both ADC and TDC information and sit in optical boxes on top of the detector.
MINERA uses the D0 TRiP ASIC [2] to readout the PMTs. The TRiP chip is a redesign of the readout ASIC for the D0 fiber tracker and preshower. The analogue portion of TRiP chip is based on the SVX4 chip and can store 4 analogue buffers to be readout. Each PMT channel is connected to 2 TRiP channels providing both a low gain and high gain ADC. Since a TRiP chip has 32 channels, each chip can service 16 PMT channels with both ADC and TDC information. The TDC information comes from a latch in the TRiP chip which is fed into a FPGA. The timing information has an accuracy of a few ns. When this latch fires, the FPGA tells the TRiP chip to store the analogue charge. This enables a TRiP chip to store as many as 4 events throughout the 8 sec spill. At the end of the spill, the VME readout collects all the TRiP chip information from the FPGAs.
The TRiP electronics has been tested with a vertical slice test. We have built a readout board which plugs on the MINOS CalDet box [3]. The CalDet box contains a 64 channel PMT and optical fibers to bring the light to the PMT. (These boxes were used for the MINOS CERN test beam). The pedestal RMS is about 2 fc, much less than the 30 fc photo electron peak we expect from the least gain PMT channel. We have verified the self-triggering mode for storing charge. We have determined that 2 TRiP channels per PMT channel gives the dynamic range we need.
The MINERA detector sits just upstream of the MINOS detector in the MINOS near detector hall. The MINOS detector serves to measure the charge and momentum of the higher energy muons exiting the MINERA detector.
3 The Performance of the MINERA detector
\epsfigfigure=tracking.eps,width=0.47bbllx=50,bblly=150,bburx=555,bbury=669 \epsfigfigure=dEdxId.eps,width=0.52bbllx=0,bblly=13,bburx=567,bbury=540
The simulation of events in the MINERA detector is carried out using a GEANT-based Monte Carlo program with the NuMI beam flux. The Monte Carlo program includes the photostatistical effects of light collection, a Kalman filter reconstruction package for track and vertex fitting, and particle identification. Some of the results of the simulation are shown in Figure 2. Fitted tracks from such muons have typical impact parameter of mm and angular resolution of mrad (Figure 2). Using the (typically short) reconstructed proton track and the muon track from quasi-elastic events, RMS vertex uncertainties of mm and mm are measured in the coordinates transverse and parallel to the beam direction, respectively.
Specific energy loss () will be an important tool for particle identification in MINERA. For tracks which stop in the inner detector, the charge deposited near the end of the track (corrected for sample length) can be compared with expected curves for the , and proton hypotheses. Figure 2 illustrates the probability of misidentification by plotting the difference between the correct (for the particle’s true type) and the smallest of the two (incorrect) other particle hypotheses. With this naive analysis, we correctly identify 85% of stopping kaons, 90% of stopping pions, and of stopping protons.


The energy of muons from charged-current interactions will be measured using range and/or curvature in the magnetized regions of MINERA and the MINOS spectrometer. For muons stopping in the detector, the momentum resolution will be . If the MINOS detector is used, the momentum resolution will be 13%[4].
Figure 3 shows the reconstructed vs the true for Monte Carlo events where all of the hadronic fragments are contained within the MINERA detector. The relative deviation of the reconstructed energy from the true , , multiplied by is shown in Figure 3, giving an average resolution for reconstruction of of . This resolution has some energy dependence and is best represented by .
References
- [1] MINERA Collaboration, Proposal for Fermilab Experiment E938, hep-ex[0405002]
- [2] J. Estrada, C. Garcia, B. Hoeneisen and P. Rubinov, Aug 2002, FERMILAB-TM-2226.
- [3] N. Tagg et al., submitted to Nucl. Instr. and Meth., physics[0408055]
- [4] MINOS Collab., “MINOS Technical Design Report” NuMI-NOTE-GEN-0337 (1998).