Affiliated with: ]Univ. of Victoria, Victoria, BC.
Affiliated with: ]Kurchatov Institute, Moscow, Russia.
Deceased.]
Affiliated with: ]Univ. of Victoria, Victoria, BC.
Present address: ]Univ. of Manitoba, Winnipeg, MB.
Deceased.]
Affiliated with: ]Univ. of Saskatchewan, Saskatoon, SK.
Present address: ]Stanford Linear Accelerator Center, Stanford, CA.
TWIST Collaboration
Measurement of the Muon Decay Parameter
Abstract
The muon decay parameter has been measured by the TWIST collaboration. We find = 0.74964 0.00066(stat.) 0.00112(syst.), consistent with the Standard Model value of 3/4. This result implies that the product of the muon polarization in pion decay, , and the muon decay parameter falls within the 90% confidence interval . It also has implications for left-right-symmetric and other extensions of the Standard Model.
pacs:
13.35.Bv, 14.60.Ef, 12.60.CnThe TWIST spectrometer Henderson was designed to measure a broad range of the normal muon decay spectrum, , allowing the simultaneous extraction of the spectrum shape parameters. Assuming the weak interaction is local and invariant under the Lorentz group, the effective four fermion muon decay matrix element can be written in terms of helicity-preserving amplitudes:
| (1) |
where the specify the scalar, vector, and tensor couplings between -handed muons and -handed electrons Fetscher . In this form, the Standard Model implies = 1 and all other coupling constants are zero.
The differential decay spectrum Michel of the emitted in the decay of polarized is provided in terms of four parameters, , , , and , commonly referred to as the Michel parameters, which are bilinear combinations of the coupling constants. In the limit where the electron and neutrino masses as well as radiative corrections are neglected, this spectrum is given by:
| (2) | |||||
where is the angle between the muon polarization and the outgoing electron direction, , and is the muon polarization. The fourth parameter, , appears in the isotropic term when the electron mass is included in the analysis. In the Standard Model, the Michel parameters take on precise values.
The parameter expresses the level of parity violation in muon decay, while parametrizes its momentum dependence. Recently, TWIST reported a new measurement of Musser . In this paper we report a new measurement of . The currently accepted value of = Balke agrees with the Standard Model expectation of 3/4. Some Standard Model extensions require deviations from pure coupling that can alter . Some of these models involve right-handed interactions. The positive definite quantity,
| (3) | |||||
can serve to set a model independent limit on any muon right-handed couplings Fetscher ; PDG . A recent review of muon decay is presented in Kuno .
Highly polarized surface muons Pifer are delivered to the TWIST spectrometer Henderson from the M13 channel at TRIUMF. The spectrometer consists of a detector made up of 56 very thin high precision chamber planes, all mounted perpendicularly to a solenoidal 2 T magnetic field. The muons enter this array of chambers through a m scintillator that acts as the event trigger. More than 80% of the muons come to rest in the central stopping target, which also acts as the cathode plane for the Multi Wire Proportional Chambers (MWPC) on either side. The decay positrons spiral through the chambers producing hits on the wires that are recorded by time to digital converters. These helical tracks are later analyzed to determine precisely the positron energy and angle. The observed momentum resolution is 100 keV/c Musser . The resolution derived from Monte Carlo (MC) is about 0.005. The reconstruction is similar to Musser , except for some details discussed below.
TWIST determines the Michel parameters by fitting two-dimensional histograms of reconstructed experimental decay positron momenta and angles with histograms of reconstructed Monte Carlo data. This approach has several advantages. First, spectrum distortions introduced by the event reconstruction largely cancel because MC and experimental data are analyzed identically. Second, because the MC simulates the detector response well, no explicit corrections of the result are required. Third, a blind analysis of the result is straightforward. It is implemented by utilizing hidden Michel parameters , and to generate the theoretical decays. The decay rate can be written as
since the decay spectrum is linear in the shape parameters. The sum of MC spectra is fit to the data spectrum by adjusting the . is extracted as . Since the hidden parameters were allowed to only deviate from their Standard model values by no more than 0.03 it was sufficient for the extraction of systematic uncertainties to assume that they had their Standard model values during the blind stage of the analysis. The MC spectra were generated including full radiative corrections with exact electron mass dependence, leading and next-to-leading logarithmic terms of , leading logarithmic terms of , corrections for soft pairs, virtual pairs, and an ad-hoc exponentiation Arbuzov . Because TWIST at the present stage could not provide an improved measurement of eta, we set it, for MC spectra production, to its current highest precision value of PDG in order to constrain other parameters better. The uncertainty of on the accepted value of gives a negligible uncertainty on the final value of .
The TWIST simulation model is based on GEANT 3.21 Brun with the chamber response based on GARFIELD garfield . It contains virtually all the components of the spectrometer with which a muon or a decay positron could interact. The output exactly mimics the binary files generated by the data acquisition system.
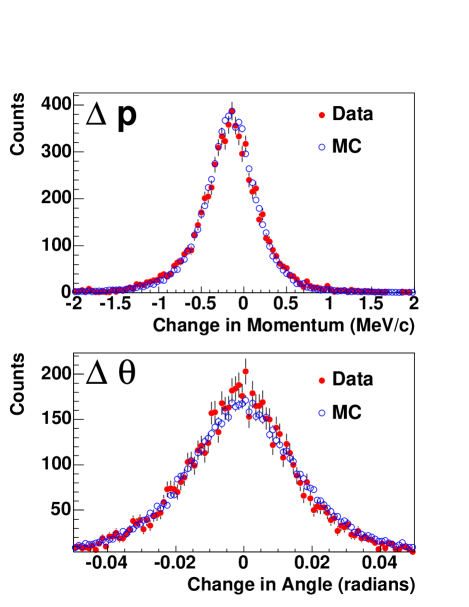
Factors that influence the momentum and angle determination must be well simulated in the MC, so special runs were taken specifically to address the accuracy of the simulation of energy loss and multiple scattering. Muons were stopped in the extreme upstream wire chambers in both the experiment and in the MC simulation. The decay positrons were tracked through the upstream half and separately through the downstream half of the spectrometer. Differences in momentum and angle were histogrammed on a track by track basis. Figure 1 presents, for both data and MC, the changes in momentum and angle that occur primarily at the central stopping target. The widths of the peaks in this figure do not represent the experimental resolution for a number of reasons. First, because the same track is being reconstructed twice with finite resolution the differences in the measured values can be either positive or negative. Second, the particle sees approximately twice the thickness of materials. As well, the tracking in the upstream region is in the opposite direction for which the code is optimized and in this region the track does not see as many planes due to the distribution of the muon stops in the upstream planes. The MC nonetheless reproduces the data very well. The distribution mean(RMS) for the data and MC are -0.17(0.41) MeV/c and -0.17(0.39) MeV/c, respectively. The mean(RMS) for the data and MC are -0.95(17.0) and -0.37(18.0) milliradians respectively. The small differences are within the uncertainties associated with positron interactions and target thickness.
The result for presented here employed a sample consisting of events recorded in Fall, 2002. This data sample is comprised of the same 16 data sets used for our extraction of Musser . Many of these data sets were taken under conditions chosen to establish the sensitivity of the detector to systematic effects. Four of the data sets, sets A and B taken at 2.00 T six weeks apart and two other sets, one taken at 1.96 T and one at 2.04 T, were analyzed and fit to their corresponding MC samples to derive the value of . Our determination also utilized a cloud muon sample Musser . The low polarization of that data set leads to low sensitivity and the potential for substantially increased systematic effects in the extraction of . Rather than perform a complete additional systematics study for a data set that would contribute little weight, we chose to use the cloud muon sample only as a consistency check on our final result for .
There are several differences between our previous analyses for Musser and for the result presented here. After the first analysis was completed and the hidden parameters were disclosed, an a priori defined consistency check was carried out. Muon decay parameters determined from set B were used to generate a new Monte Carlo spectrum, which was used to perform another fit to that set. This fit was expected to yield deviations of all parameters consistent with zero, but it failed for . It was determined then that there was a flaw in the way the polarization-dependent radiative corrections were implemented in the Monte Carlo event generator. Since is essentially decoupled from the asymmetry parameters this flaw had no impact on the value of . After the first analysis, we were no longer “blind” to the value of . However the flaw did introduce a systematic uncertainty in the value of inferred from the data. This systematic uncertainty depended on the difference in absolute polarization (not ) between the actual muon decay data and the Monte Carlo decay events. Estimates indicated that the systematic effect was 0.001. Unfortunately, a precise value was impossible to determine a priori, as only the product is measurable from the data, rather than alone.
A new analysis with a corrected event generator was therefore undertaken for through the generation, with a new set of hidden Michel parameters, of a completely new set of Monte Carlo events. The four data sets described above were also reanalyzed with improved alignment calibrations. Finally, the track-selection algorithm was improved by merging those used for the analysis. Thus the fits employed for the extraction are completely distinct from those in Musser .
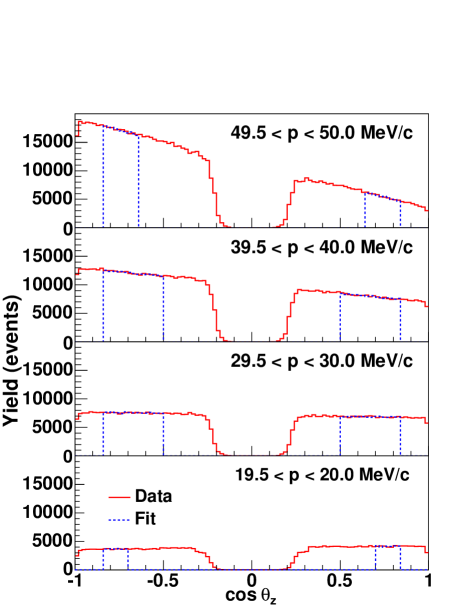
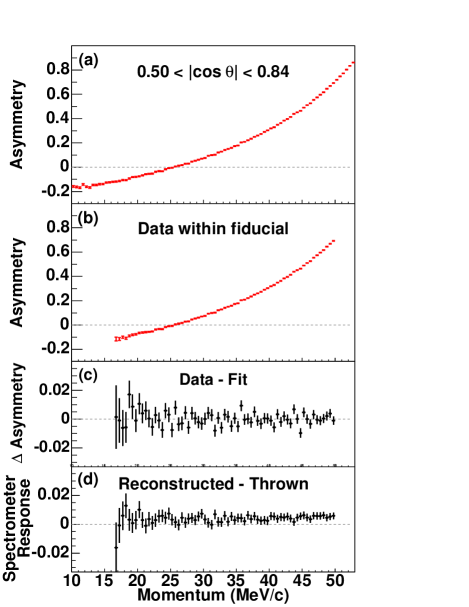
Figure 2 shows the decay positron angular distributions for representative momentum bins. Equation (2) indicates the angular distributions follow a shape, where by convention the asymmetry, , is positive when positrons are emitted preferentially along the muon polarization axis. Figure 3(a) shows the observed muon decay asymmetry as a function of momentum for set B. The asymmetry provides a compact representation of the angular distributions. However, extracting from involves a significant correlation between and Balke . In contrast, we extract from a simultaneous fit of the full experimental momentum-angle distribution illustrated in Fig. 2, as described above, which leads to a negligible correlation between and . Fits to upstream minus downstream distributions, which are essentially independent of and , gave nearly identical results for .
The fiducial region adopted for this analysis requires MeV/c, MeV/c, MeV/c, and . The fiducial cuts, while intentionally chosen to be conservative, are related to physical limitations of the TWIST detector. The 50 MeV momentum cut rejects events that are near the region utilized in the end point fits Musser . It is also important to avoid the region very close to the end point to minimize the sensitivity of the Michel parameter fits to the momentum resolution. The longitudinal momentum constraint eliminates events with wavelengths that match a 12.4 cm periodicity in the wire chamber construction. The transverse momentum constraint insures that all decays are well confined within the wire chamber volume. The angular constraint removes events at large that have worse resolution and events at small that experience larger energy loss and multiple scattering. These limits were frozen early in the analysis. Prior to opening the “black box” a study of how the results changed as each of the fiducial boundaries was moved found the sensitivities to be very weak.
Figure 2 shows the results of the best fit to set B within the fiducial region for the selected momentum bins. Set B is one of the statistically larger sets and is typical of all the sets. Figure 3 shows the measured muon decay asymmetry in panels (a) and (b) while panel (c) presents the difference between the measured asymmetry and the asymmetry calculated from the best fit MC spectrum for events within the fiducial region. Panel (d) shows the difference between the asymmetry within the fiducial as reconstructed and as thrown for the MC, illustrating that the distortion of the asymmetry by the TWIST detector is small and essentially momentum independent.
The graphite coated Mylar stopping target resulted in a time dependence of the muon polarization, , which prevented the simultaneous determination of a value for from this data sample. at the time of decay for the data sets analyzed here. The graphite coating on the Mylar target was necessary since the target, also serving as a cathode foil for the two central MWPC chambers, required a conductive surface. Details regarding the target can be found in Henderson . Knowing the precise polarization is not important for extraction of , thus the Mylar target was considered adequate for the current measurement despite the possibility of depolarizing interactions.
Systematics were studied by employing the fitting technique described above to fit experimental data samples taken with a systematic parameter set at an exaggerated level to data taken under ideal conditions. This expresses the changes in the spectrum shape caused by the systematic effect in terms of changes in the Michel parameters. Other systematic sensitivities were determined by analyzing a data or MC sample with a systematic parameter offset from its nominal value and fitting to the same sample analyzed with this parameter at its nominal value. For the current analysis the largest uncertainties are for the detector alignment, for the simulation of positron interactions, and for the chamber response, in particular the time dependent effects due to gas density changes and to the variability of the cathode foil positions Henderson . The latter parameters were monitored throughout the data accumulation periods and average values were used in the analysis. Uncertainties due to the detector alignment were established by analysis of data and generation of MC with purposely misaligned chambers. Upper limits for the positron interaction uncertainties were derived from studies of the data for muons stopped far upstream and from MC histograms that demonstrated the distortion of the momentum spectrum due to hard interactions. Other important systematic uncertainties for are the stopping target thickness and the momentum calibration. The target thickness issue was studied by varying the thickness of the graphite coating in MC. The results of these studies for the parameter are presented in Tables 1 and 2. The value of for the cloud muon sample is (stat.), consistent with the results in Table I. The average value of from the present fits is 0.75044, consistent with the blind analysis result in Ref. Musser .
The effects of chamber response, momentum calibration and muon beam stability, which have time dependent components, are treated as data set-dependent effects with the average(ave) over the four sets used in the evaluation appearing in Table 2.
| Data Set | ||
|---|---|---|
| Set A | 1924 | |
| Set B | 1880 | |
| 1.96 T | 1987 | |
| 2.04 T | 1947 |
| Effect | Uncertainty |
|---|---|
| Spectrometer alignment | 0.00061 |
| Chamber response(ave) | 0.00056 |
| Positron interactions | 0.00055 |
| Stopping target thickness | 0.00037 |
| Momentum calibration(ave) | 0.00029 |
| Muon beam stability(ave) | 0.00010 |
| Theoretical radiative correctionsArbuzov | 0.00010 |
| Upstream/Downstream efficiencies | 0.00004 |
We find = 0.74964 0.00066(stat.) 0.00112(syst.), consistent with the Standard Model expectation of 3/4. The central value for was calculated as a weighted average using a quadratic sum of the statistical and set-dependent uncertainties for the weights. The final systematic uncertainty is a quadratic sum of set independent and average values of the set-dependent systematics. Using this result, our new value for Musser , the previous measurement of Jodidio , and the constraint , it is possible to establish new 90% confidence interval limits, , consistent with the Standard Model value of 1. This result is more restrictive than the current best measurements for muons from pion and kaon decays Beltrami ; Imazato . In addition, from these same results one finds that with 90% confidence. This may be combined with Eq. (3) to find new 90% confidence limits on interactions that couple right-handed muons to left-handed electrons: , , and . The lower limit, can be used to determine a new limit on the mass of the possible right-handed boson, , improving the existing lower limit of 406 GeV/c2 (402 GeV/c2 with modern M GeV/c2) from Jodidio to 420 GeV/c2 under the assumption of pseudo manifest left-right symmetry. For nonmanifest left-right symmetric models the limit is GeV/c2, where and are the coupling constants Herczeg . The value of is sensitive to a proposed nonlocal interaction Chizhov that would be represented by a new parameter . A limit for may be estimated from our 90% confidence lower limit for using the relation . This results in , which compares with Chizhov hinted at by decay experiments.
Acknowledgements.
We thank P.A. Amaudruz, C.A. Ballard, M.J. Barnes, S. Chan, B. Evans, M. Goyette, K.W. Hoyle, D. Maas, J. Schaapman, J. Soukup, C. Stevens, G. Stinson, H.-C. Walter, and the many undergraduate students who contributed to the construction and operation of TWIST. We also acknowledge many contributions by other professional and technical staff members from TRIUMF and collaborating institutions. Computing resources for the analysis were provided by WestGrid. This work was supported in part by the Natural Sciences and Engineering Research Council and the National Research Council of Canada, the Russian Ministry of Science, and the U.S. Department of Energy.References
- (1) R.S. Henderson et al., hep-ex/0409066.
- (2) W. Fetscher, H.-J. Gerber and K.F. Johnson, Phys. Lett. B173, 102 (1986).
- (3) L. Michel, Proc. Phys. Soc. A63, 514 (1950); C. Bouchiat and L. Michel, Phys. Rev. 106, 170 (1957); T. Kinoshita and A. Sirlin, Phys. Rev. 108, 844 (1957).
- (4) J.R. Musser et al. (TWIST Collaboration), hep-ex/0409063.
- (5) B. Balke et al., Phys. Rev. D 37, 587 (1988).
- (6) S. Eidelman et al., Phys. Lett. B592, 1 (2004).
- (7) Y. Kuno and Y. Okada, Rev. Mod. Phys. 73, 151 (2001).
- (8) A.E. Pifer, T. Bowen, and K.R. Kendall, Nucl. Instr. and Meth. 135, 39 (1976).
- (9) A.B. Arbuzov, Phys. Lett. B524, 99 (2002); JHEP 03, 063 (2003); JETP Lett. 78, 179 (2003); A. Arbuzov, A. Czarnecki and A. Gaponenko, Phys. Rev. D 65, 113006 (2002); A. Arbuzov, and K. Melnikov, Phys. Rev. D 66, 093003 (2002).
- (10) R. Brun et al., GEANT3 Users Guide, CERN Program Library W5013 (1994).
- (11) R. Veenhof, GARFIELD, Version 7.10.
- (12) A. Jodidio et al., Phys. Rev. D 34, 1967 (1986); 37, 237(E) (1988).
- (13) I. Beltrami et al., Phys. Lett. B194, 326 (1987).
- (14) J. Imazato et al., Phys. Rev. Lett. 69, 877 (1992).
- (15) P. Herczeg, Phys. Rev. D34, 3449 (1986).
- (16) M.V. Chizhov, hep-ph/0405073.