EUROPEAN ORGANIZATION FOR NUCLEAR RESEARCH
CERN-PH-EP/2004-051
13 September 2004
Measurements of in Collisions at 182 – 209 GeV
The OPAL Collaboration
Abstract
Measurements of , the ratio of the cross-section to the
cross-section in collisions, are presented. The data were
collected by the OPAL experiment at LEP at centre-of-mass energies
between 182 GeV and 209 GeV. Lepton, lifetime and event-shape
information is used to tag events containing b quarks with high
efficiency. The data are compatible with the Standard Model expectation.
The mean ratio of the eight measurements reported here
to the Standard Model prediction is
, where the first error is
statistical and the second systematic.
(To be Submitted to Physics Letters B)
The OPAL Collaboration
G. Abbiendi2, C. Ainsley5, P.F. Åkesson3,y, G. Alexander22, J. Allison16, P. Amaral9, G. Anagnostou1, K.J. Anderson9, S. Asai23, D. Axen27, I. Bailey26, E. Barberio8,p, T. Barillari32, R.J. Barlow16, R.J. Batley5, P. Bechtle25, T. Behnke25, K.W. Bell20, P.J. Bell1, G. Bella22, A. Bellerive6, G. Benelli4, S. Bethke32, O. Biebel31, O. Boeriu10, P. Bock11, M. Boutemeur31, S. Braibant2, R.M. Brown20, H.J. Burckhart8, S. Campana4, R.K. Carnegie6, A.A. Carter13, J.R. Carter5, C.Y. Chang17, D.G. Charlton1, C. Ciocca2, A. Csilling29, M. Cuffiani2, S. Dado21, A. De Roeck8, E.A. De Wolf8,s, K. Desch25, B. Dienes30, M. Donkers6, J. Dubbert31, E. Duchovni24, G. Duckeck31, I.P. Duerdoth16, E. Etzion22, F. Fabbri2, A. Fanfani2, P. Ferrari8, F. Fiedler31, I. Fleck10, M. Ford16, A. Frey8, P. Gagnon12, J.W. Gary4, C. Geich-Gimbel3, G. Giacomelli2, P. Giacomelli2, M. Giunta4, J. Goldberg21, E. Gross24, J. Grunhaus22, M. Gruwé8, P.O. Günther3, A. Gupta9, C. Hajdu29, M. Hamann25, G.G. Hanson4, A. Harel21, M. Hauschild8, C.M. Hawkes1, R. Hawkings8, R.J. Hemingway6, G. Herten10, R.D. Heuer25, J.C. Hill5, K. Hoffman9, D. Horváth29,c, P. Igo-Kemenes11, K. Ishii23, H. Jeremie18, P. Jovanovic1, T.R. Junk6,i, J. Kanzaki23,u, D. Karlen26, K. Kawagoe23, T. Kawamoto23, R.K. Keeler26, R.G. Kellogg17, B.W. Kennedy20, S. Kluth32, T. Kobayashi23, M. Kobel3, S. Komamiya23, T. Krämer25, P. Krieger6,l, J. von Krogh11, T. Kuhl25, M. Kupper24, G.D. Lafferty16, H. Landsman21, D. Lanske14, D. Lellouch24, J. Lettso, L. Levinson24, J. Lillich10, S.L. Lloyd13, F.K. Loebinger16, J. Lu27,w, A. Ludwig3, J. Ludwig10, W. Mader3,b, S. Marcellini2, A.J. Martin13, G. Masetti2, T. Mashimo23, P. Mättigm, J. McKenna27, R.A. McPherson26, F. Meijers8, W. Menges25, F.S. Merritt9, H. Mes6,a, N. Meyer25, A. Michelini2, S. Mihara23, G. Mikenberg24, D.J. Miller15, W. Mohr10, A. Montanari2, T. Mori23, A. Mutter10, K. Nagai13, I. Nakamura23,v, H. Nanjo23, H.A. Neal33, R. Nisius32, S.W. O’Neale1,∗, A. Oh8, M.J. Oreglia9, S. Orito23,∗, C. Pahl32, G. Pásztor4,g, J.R. Pater16, J.E. Pilcher9, J. Pinfold28, D.E. Plane8, O. Pooth14, M. Przybycień8,n, A. Quadt3, K. Rabbertz8,r, C. Rembser8, P. Renkel24, J.M. Roney26, Y. Rozen21, K. Runge10, K. Sachs6, T. Saeki23, E.K.G. Sarkisyan8,j, A.D. Schaile31, O. Schaile31, P. Scharff-Hansen8, J. Schieck32, T. Schörner-Sadenius8,z, M. Schröder8, M. Schumacher3, R. Seuster14,f, T.G. Shears8,h, B.C. Shen4, P. Sherwood15, A. Skuja17, A.M. Smith8, R. Sobie26, S. Söldner-Rembold16, F. Spano9, A. Stahl3,x, D. Strom19, R. Ströhmer31, S. Tarem21, M. Tasevsky8,s, R. Teuscher9, M.A. Thomson5, E. Torrence19, D. Toya23, P. Tran4, I. Trigger8, Z. Trócsányi30,e, E. Tsur22, M.F. Turner-Watson1, I. Ueda23, B. Ujvári30,e, C.F. Vollmer31, P. Vannerem10, R. Vértesi30,e, M. Verzocchi17, H. Voss8,q, J. Vossebeld8,h, C.P. Ward5, D.R. Ward5, P.M. Watkins1, A.T. Watson1, N.K. Watson1, P.S. Wells8, T. Wengler8, N. Wermes3, G.W. Wilson16,k, J.A. Wilson1, G. Wolf24, T.R. Wyatt16, S. Yamashita23, D. Zer-Zion4, L. Zivkovic24
1School of Physics and Astronomy, University of Birmingham,
Birmingham B15 2TT, UK
2Dipartimento di Fisica dell’ Università di Bologna and INFN,
I-40126 Bologna, Italy
3Physikalisches Institut, Universität Bonn,
D-53115 Bonn, Germany
4Department of Physics, University of California,
Riverside CA 92521, USA
5Cavendish Laboratory, Cambridge CB3 0HE, UK
6Ottawa-Carleton Institute for Physics,
Department of Physics, Carleton University,
Ottawa, Ontario K1S 5B6, Canada
8CERN, European Organisation for Nuclear Research,
CH-1211 Geneva 23, Switzerland
9Enrico Fermi Institute and Department of Physics,
University of Chicago, Chicago IL 60637, USA
10Fakultät für Physik, Albert-Ludwigs-Universität
Freiburg, D-79104 Freiburg, Germany
11Physikalisches Institut, Universität
Heidelberg, D-69120 Heidelberg, Germany
12Indiana University, Department of Physics,
Bloomington IN 47405, USA
13Queen Mary and Westfield College, University of London,
London E1 4NS, UK
14Technische Hochschule Aachen, III Physikalisches Institut,
Sommerfeldstrasse 26-28, D-52056 Aachen, Germany
15University College London, London WC1E 6BT, UK
16Department of Physics, Schuster Laboratory, The University,
Manchester M13 9PL, UK
17Department of Physics, University of Maryland,
College Park, MD 20742, USA
18Laboratoire de Physique Nucléaire, Université de Montréal,
Montréal, Québec H3C 3J7, Canada
19University of Oregon, Department of Physics, Eugene
OR 97403, USA
20CCLRC Rutherford Appleton Laboratory, Chilton,
Didcot, Oxfordshire OX11 0QX, UK
21Department of Physics, Technion-Israel Institute of
Technology, Haifa 32000, Israel
22Department of Physics and Astronomy, Tel Aviv University,
Tel Aviv 69978, Israel
23International Centre for Elementary Particle Physics and
Department of Physics, University of Tokyo, Tokyo 113-0033, and
Kobe University, Kobe 657-8501, Japan
24Particle Physics Department, Weizmann Institute of Science,
Rehovot 76100, Israel
25Universität Hamburg/DESY, Institut für Experimentalphysik,
Notkestrasse 85, D-22607 Hamburg, Germany
26University of Victoria, Department of Physics, P O Box 3055,
Victoria BC V8W 3P6, Canada
27University of British Columbia, Department of Physics,
Vancouver BC V6T 1Z1, Canada
28University of Alberta, Department of Physics,
Edmonton AB T6G 2J1, Canada
29Research Institute for Particle and Nuclear Physics,
H-1525 Budapest, P O Box 49, Hungary
30Institute of Nuclear Research,
H-4001 Debrecen, P O Box 51, Hungary
31Ludwig-Maximilians-Universität München,
Sektion Physik, Am Coulombwall 1, D-85748 Garching, Germany
32Max-Planck-Institute für Physik, Föhringer Ring 6,
D-80805 München, Germany
33Yale University, Department of Physics, New Haven,
CT 06520, USA
a and at TRIUMF, Vancouver, Canada V6T 2A3
b now at University of Iowa, Dept of Physics and Astronomy, Iowa, U.S.A.
c and Institute of Nuclear Research, Debrecen, Hungary
e and Department of Experimental Physics, University of Debrecen,
Hungary
f and MPI München
g and Research Institute for Particle and Nuclear Physics,
Budapest, Hungary
h now at University of Liverpool, Dept of Physics,
Liverpool L69 3BX, U.K.
i now at Dept. Physics, University of Illinois at Urbana-Champaign,
U.S.A.
j and Manchester University
k now at University of Kansas, Dept of Physics and Astronomy,
Lawrence, KS 66045, U.S.A.
l now at University of Toronto, Dept of Physics, Toronto, Canada
m current address Bergische Universität, Wuppertal, Germany
n now at University of Mining and Metallurgy, Cracow, Poland
o now at University of California, San Diego, U.S.A.
p now at The University of Melbourne, Victoria, Australia
q now at IPHE Université de Lausanne, CH-1015 Lausanne, Switzerland
r now at IEKP Universität Karlsruhe, Germany
s now at University of Antwerpen, Physics Department,B-2610 Antwerpen,
Belgium; supported by Interuniversity Attraction Poles Programme – Belgian
Science Policy
u and High Energy Accelerator Research Organisation (KEK), Tsukuba,
Ibaraki, Japan
v now at University of Pennsylvania, Philadelphia, Pennsylvania, USA
w now at TRIUMF, Vancouver, Canada
x now at DESY Zeuthen
y now at CERN
z now at DESY
∗ Deceased
1 Introduction
The cross-section for bottom-quark pair production in annihilation relative to the hadronic cross-section,
is a sensitive probe of the Standard Model [1]. Measurements of have been made at the peak and at higher energies [2]. At the resonance, where fermion-pair production is dominated by decays, measurements of provide a precise determination of the ratio of the partial width to the hadronic width111 is the partial width ratio for decays and not the cross-section ratio measured in this paper. It is smaller than the cross-section ratio at the peak of the resonance by 0.0002. . This quantity is of particular interest because of its unique sensitivity to electroweak radiative corrections; while sensitive to the top-quark mass, its dependence on other parameters, for example the Higgs boson mass and the strong coupling constant, is negligible [2]. Above the peak, the pure cross-section decreases and the contributions of photon exchange and –Z interference become important. Possible new physics at a high energy scale might manifest itself as a deviation from the Standard Model prediction.
In this paper, measurements of at energies above the resonance are presented. The data were taken by the OPAL detector at the LEP collider, at centre-of-mass energies, , ranging from 182 GeV to 209 GeV, during the LEP2 programme.
Above the peak a significant fraction of the observed fermion-pair events comes from radiative return to the through initial-state photon radiation. Only non-radiative events are considered here, according to the definition used by OPAL in the analysis of fermion-pair production at LEP2 [3]:
-
•
An effective centre-of-mass energy , where is defined as the square of the mass of the propagator.
-
•
The predicted contribution of interference between initial- and final-state photon radiation is removed.
At high energies, additional background sources also arise, mainly from and decaying to four-fermion final states.
Because of the limited statistics due to the low cross-section at LEP2, the double-tag technique as used at the resonance [4] is not optimal. Instead the measurement reported here relies on a single-tag method, and uses a sophisticated tagging algorithm based on lepton, lifetime and event-shape information to identify events. This algorithm is more efficient and has a higher purity than the one used in our previous measurement [5], where was measured up to 189 GeV. Hence the 183 GeV and 189 GeV results reported here supersede the previous values, while the measurements at higher energy are reported here by OPAL for the first time.
2 The OPAL detector, data sample and simulation
A detailed description of the OPAL detector can be found elsewhere [6]. For this analysis, the most relevant parts of the detector are the silicon micro-vertex detector, the tracking chambers, the electromagnetic and hadronic calorimeters, and the muon chambers. The micro-vertex detector is essential for the reconstruction of secondary vertices. The central detector provides precise measurements of the momenta of charged particles from the curvature of their trajectories in a magnetic field of T. In addition, it allows the identification of charged particles through a combination of the measurement of the specific energy loss and the momentum. The electromagnetic calorimeter consists of 11 704 lead glass blocks, which completely cover the azimuthal222The OPAL coordinate system is defined as a right-handed Cartesian coordinate system, with the axis pointing in the plane of the LEP collider toward the centre of the ring, the axis in the direction of the electron beam, and and defined as the usual spherical polar coordinates. range up to polar angles of . Almost the entire detector is surrounded with four layers of muon chambers, after approximately one metre of iron from the magnet return yoke, which is instrumented as a hadron calorimeter. Luminosity is determined using small-angle Bhabha scattering in the forward calorimeter [3].
2.1 Data sample
The data used in this analysis were collected by the OPAL detector at LEP during 1997-2000, at centre-of-mass energies between 182 GeV and 209 GeV. They are grouped into eight energy points. The centre-of-mass energies and integrated luminosities of the data samples are summarized in Table 1.
| Nominal Energy | Energy Range (GeV) | (GeV) | Integrated Luminosity () |
|---|---|---|---|
| 183 | 181.7 - 184.0 | 182.7 | 56 |
| 189 | 188.5 - 189.1 | 188.6 | 185 |
| 192 | 191.4 - 191.7 | 191.6 | 29 |
| 196 | 195.4 - 195.8 | 195.5 | 77 |
| 200 | 199.3 - 199.9 | 199.5 | 78 |
| 202 | 201.5 - 202.0 | 201.6 | 36 |
| 205 | 204.5 - 205.5 | 205.3 | 74 |
| 207 | 205.5 - 208.6 | 206.8 | 137 |
2.2 Simulation
Monte Carlo (MC) simulation is used to estimate the selection efficiency for events and to evaluate backgrounds. MC samples are generated at the nominal centre-of-mass energies given in Table 1. The KK2F program [7] is used to simulate events. Four-fermion background events are simulated with the grc4f generator [8] or with the KoralW [9] program with the grc4f matrix elements. The hadronization is performed by the Pythia 6.150 [10] string model, and heavy quark fragmentation is modelled according to the Peterson fragmentation scheme [11] with parameters tuned according to [12]. All the MC samples are passed through a detailed simulation of the OPAL detector [13].
The Standard Model cross-section predictions are calculated using Zfitter 6.36
[14]. Zfitter is used to calculate the Standard Model value of ,
the ratio of the
cross-section for charm-quark pair production to the hadronic cross-section,
at which the resulting is quoted, and to
calculate for comparison of the
theoretical predictions with the measured values.
Zfitter is also used for estimating the effects of interference between
initial- and final-state photon radiation, as described in Section 3.4.
3 Analysis procedure
The measurement of starts by selecting non-radiative hadronic events, applying fiducial cuts and rejecting four-fermion background events. The number of selected events, , is corrected for background and for the efficiency of the selection cuts to yield a corrected number of non-radiative hadronic events, . The background includes the residual four-fermion background and feedthrough of events with lower effective centre-of-mass energy, . The contribution from interference between initial- and final-state radiation is also removed. A b-tagging algorithm is applied to the selected events, and the number of tagged events, , is similarly corrected for the same background contributions and interference to obtain , which still contains contributions from and light-quark-pair events. is then calculated using:
where are the efficiencies for non-radiative , and light-quark-pair events to pass the selection criteria and the b-tagging algorithm.
In the following sections, we describe the selection of high quality non-radiative hadronic events, the rejection of four fermion background (Section 3.1), and the tagging algorithm used to select events originating from (Section 3.2). This is followed by the description of the residual background estimation (Section 3.3). The correction for interference is discussed in Section 3.4, and finally the calculation of is presented (Section 3.5). The systematic uncertainties are described in Section 4, and the final results and conclusion are given in Section 5.
3.1 Hadronic event selection
Hadronic events, , are selected based on the number of reconstructed charged particle tracks and the energy deposited in the calorimeters [15]. Further requirements follow, demanding at least seven tracks and that the polar angle of the thrust axis, , satisfy ; the thrust axis is calculated from all tracks and clusters and corrected for double-counting as in [16]. The effective centre-of-mass energy, , of the collision is estimated as described in Ref. [3], and non-radiative hadronic events are selected if . For the centre-of-mass energies analysed in this paper, the production cross-section of events is comparable to that of non-radiative events. The production cross-section of events is about an order of magnitude smaller. Using the same techniques as in [17], events are rejected if they are identified as events.
The number of events at each energy selected by the above cuts () is given in Table 2. Typical efficiencies, including the efficiency of the cut, are for and 80% for lighter (u, d, s and c) events. About 14% of the sample are expected to be events. The selection of non-radiative events is less efficient for final states than for other flavours because of the generally larger missing energy due to the neutrinos in semileptonic b and c hadron decays. The remaining four-fermion background is estimated to be about 6% of the selected hadronic events.
3.2 b-tagging
In events, the quark and the anti-quark are typically boosted in opposite directions, and the subsequent hadronization is largely independent. In this analysis, each event is divided into two hemispheres defined by a plane that is orthogonal to the thrust direction.
We use a hemisphere-based b-tagger designed for LEP2 Higgs searches [18], where the tagging of events is based on three nearly independent properties of the b-hadron and its decay products: a lepton from a semileptonic b-hadron decay, the long lifetime, and kinematic differences between b-hadron decays and fragmentation in events, due to the hard fragmentation of the b-hadron and the high multiplicity of its decay products.
For the lepton tag, semileptonic b-hadron decays are identified from their resultant electron or muon and the lepton momentum is used as the b-tag variable. Electrons are identified using an artificial neural network (ANN) [4] while muons are identified using information from the muon chambers in association with the tracking chambers, as in [19]. Electrons from photon conversions are rejected using an additional ANN described in [20].
For the lifetime tag, secondary vertices are reconstructed. Variables based on the vertex significance (the distance between the reconstructed primary and secondary vertices divided by the corresponding uncertainty) and the impact parameters of the tracks associated with the vertex are combined using an ANN scheme as in [18].
For the kinematic tag, three variables are combined using another ANN: the number of detected particles in the central part of the hemisphere, the angle between the hemisphere axis and its boosted sphericity axis, and the C parameter [21], the latter two being calculated in the rest frame of all the particles associated with the hemisphere.
In each hemisphere, the output of the lepton tag, the lifetime ANN and the kinematic ANN are combined with an unbinned likelihood calculation [22], and the likelihoods are obtained. The likelihood is the probability for the first hemisphere to contain a b quark. is the same probability for the second hemisphere, and are the corresponding probabilities for c-quark (light quarks). The two hemispheres’ outputs are then combined into a single event b-tagging likelihood variable , using
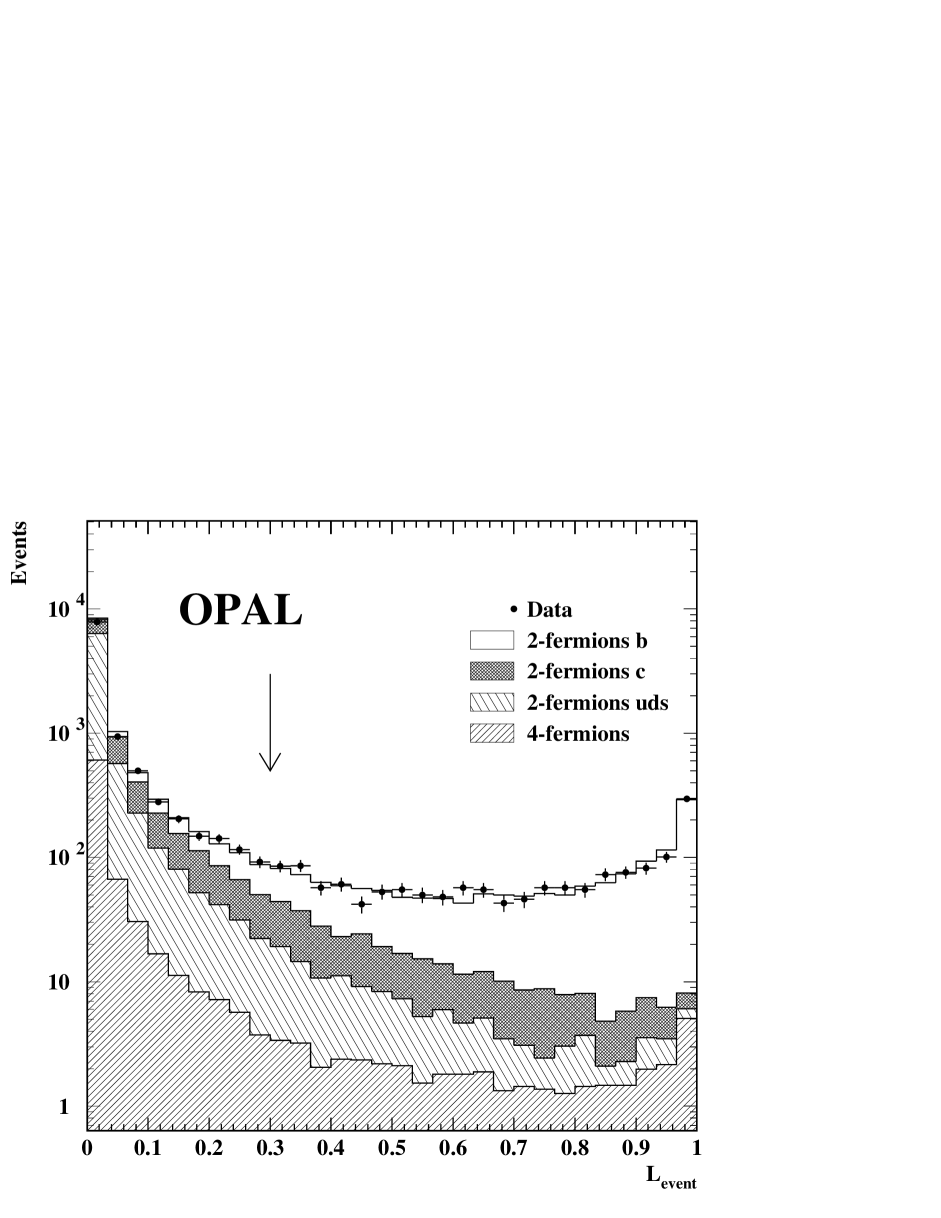
The normalization parameters are set to and , which are the Zfitter theoretical predictions for and at about 190 GeV. The same values are used for all data sets. The number of events, , satisfying a b-tagging cut of is determined; this cut value minimizes the total uncertainty in the measurement of . Typical efficiencies for the b-tagger in the hadronic event sample are and for and light-quark pair events respectively; for the residual four-fermion events the tagging efficiency is about 5%. On average, 77% of the tagged sample is expected to be events. The distribution of for the 182–209 GeV data is shown in Figure 1, together with the expectation from the Monte Carlo. Good agreement between the data and the Monte Carlo is observed.
3.3 Background estimation
The residual four-fermion background is estimated from Monte Carlo simulation and subtracted from the number of selected hadronic () and b-tagged () events. It is 6.5% for the hadronic event sample and 2.5% for the b-tagged sample. The dominant contribution to the four-fermion background originates from and final states, with only 5% coming from non- and non- events.
Backgrounds from two-photon collisions and events were found to be negligible. The selected event sample has a small contamination from radiative hadronic events where was overestimated. This contamination is estimated using Monte Carlo simulation and subtracted from and when calculating and . Since both the b-tagged and the hadronic samples include such contamination, the effect on the measured value of is small. About 3% of the selected hadronic events and 4% of the b-tagged events have a true value of smaller than .
The contributions from non-radiative and light-quark-pair events that are b-tagged are taken into account by the two negative terms in the numerator of equation 1. The secondary production of heavy quarks, commonly referred to as gluon splitting, can also lead to primary light-quark-pair events being selected by the b-tagging algorithm. This contribution is fully accounted for by the efficiencies in equation 1 if the rates of this production in the Monte Carlo are correct. These rates were measured at LEP1 [25, 24, 23]. We extrapolate the measured values to the higher energies using theoretical predictions given in [26, 10, 27]. We obtain production rates per hadronic event, and at GeV where the uncertainties include the uncertainty on the measurements and the variation of the theoretical models used for the extrapolation to higher energy. The default Monte Carlo values are and . We correct the value of in the Monte Carlo according to the extrapolated value. Since the Monte Carlo value of agrees with the data we do not correct the Monte Carlo for but take the difference between the Monte Carlo value and the maximal extrapolated rate () as the corresponding systematic uncertainty.
3.4 Subtraction of interference between initial- and final-state photon radiation
The interference cross-section is defined as the difference between the cross-section including interference between initial- and final-state photon radiation and the cross-section excluding interference. It is calculated using Zfitter with the Standard Model value of the forward backward asymmetry, for , and , in bins of where is the angle between the fermion direction and the direction of the beam. The interference cross-section can be positive or negative, depending on the value of . The thrust axis gives a good estimate of the fermion direction, so we assume that the interference correction estimated in bins of can be applied in bins of . The fractions of b, c and uds events in the hadronic and b-tagged samples are estimated from Monte Carlo samples generated excluding interference. The interference cross-section for each flavour is then weighted according to the estimated flavour composition, and the resulting numbers of events are subtracted from the number of b-tagged events and from the number of events to obtain and , which appear in equation 1. These corrections are typically 0.3% for the hadronic sample and for the b-tagged sample. The uncertainty on the above procedure is discussed in Section 4.1.3 and given in Table 3.
3.5 Calculation of
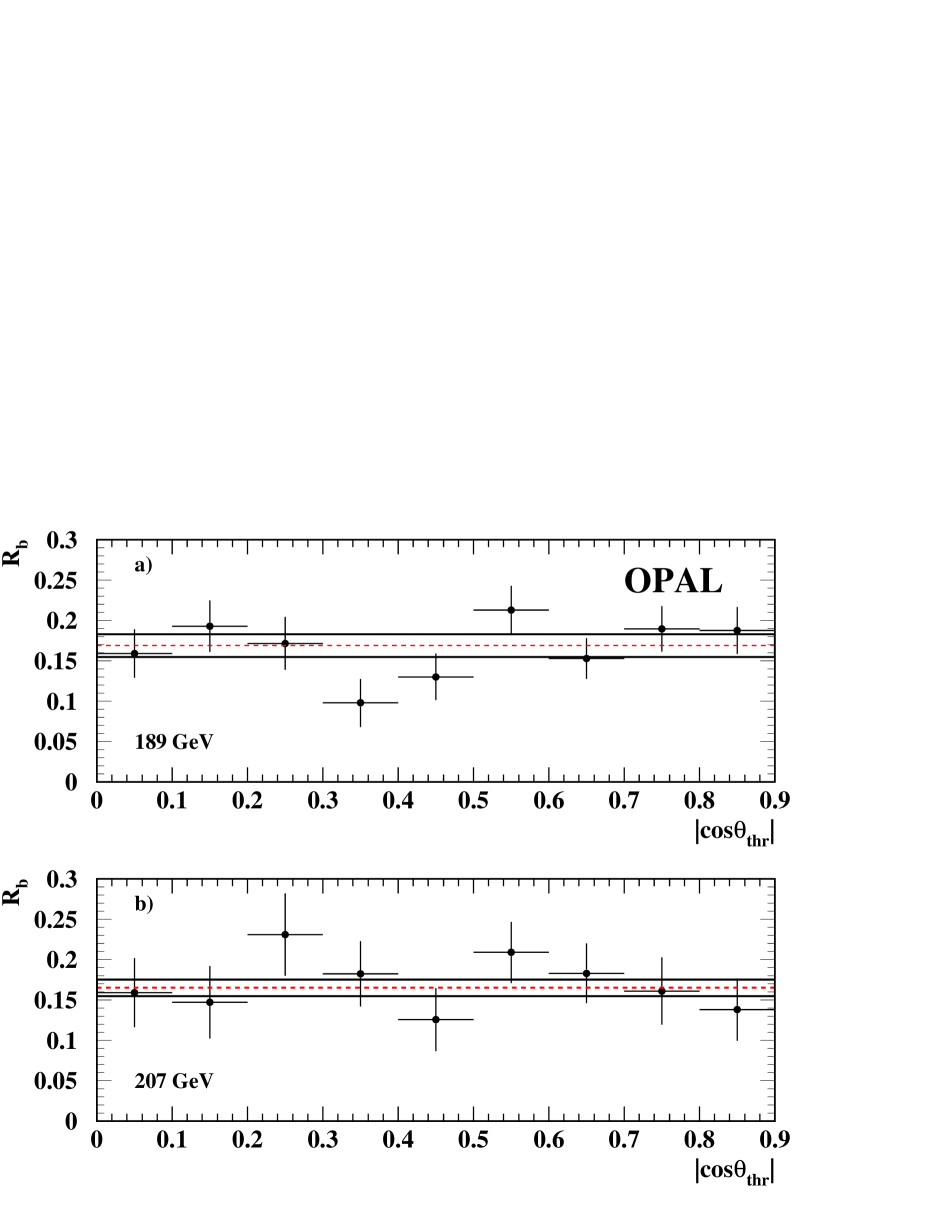
To avoid dependence on the Monte Carlo angular distribution, the analysis is performed in bins of . In each bin, the efficiencies and corrected numbers of and events are determined. The efficiencies, , are defined as the number of MC events of the specific flavour b-tagged in the bin, divided by the number of events of that specific flavour that were generated in that bin.
is then calculated in each bin in the range . Figure 2 shows the value of versus for the 189 GeV and 207 GeV samples.
The final value of is determined by taking the average over all bins. The total numbers of selected hadronic and tagged events, the values of the variables in equation 1, as well as the resulting value with its statistical uncertainty, are summarized in Table 2.
| Data set | |||||||||
|---|---|---|---|---|---|---|---|---|---|
| 183 | 1172 | 185 | 1199.8 | 176.1 | 0.60 | 0.062 | 0.012 | 0.2532 | |
| 189 | 3496 | 447 | 3561.1 | 422.7 | 0.58 | 0.059 | 0.012 | 0.2551 | |
| 192 | 573 | 80 | 584.7 | 76.4 | 0.58 | 0.064 | 0.014 | 0.2560 | |
| 196 | 1343 | 182 | 1370.6 | 172.7 | 0.56 | 0.060 | 0.014 | 0.2570 | |
| 200 | 1312 | 166 | 1333.9 | 157.3 | 0.58 | 0.061 | 0.014 | 0.2581 | |
| 202 | 591 | 72 | 604.6 | 68.3 | 0.56 | 0.062 | 0.014 | 0.2585 | |
| 205 | 1124 | 136 | 1140.6 | 128.0 | 0.55 | 0.061 | 0.014 | 0.2592 | |
| 207 | 2046 | 251 | 2078.5 | 237.5 | 0.54 | 0.057 | 0.014 | 0.2597 |
The resulting values are quoted for the case where is set to its Standard Model value, , given in Table 2. The dependence of the result on the assumed value of can be parametrized as:
The parameter , derived from equation 1, is determined separately for each centre-of-mass energy and is given in Table 4.
4 Systematic uncertainties
The systematic uncertainties considered for these measurements are described in the following paragraphs. A breakdown of the systematic uncertainty at 207 GeV is given in Table 3, and the total systematic error is given for all energies in Table 4.
| Uncertainty source | (%) |
|---|---|
| b fragmentation | 0.6 |
| b decay multiplicity | 0.6 |
| b hadron composition | 0.3 |
| b lifetime | 0.1 |
| c fragmentation | 0.8 |
| c decay multiplicity | 0.1 |
| c hadron composition | 0.3 |
| c lifetime | 0.1 |
| semileptonic branching ratio | 0.1 |
| semileptonic decay model | 0.1 |
| Total b,c physics modelling | 1.3 |
| rate | 0.2 |
| Interference | 0.3 |
| Four-fermion background | 0.1 |
| 0.1 | |
| 0.1 | |
| Total physics modelling | 1.3 |
| Track reconstruction | 3.2 |
| Lepton ID | 0.5 |
| Non-radiative event selection | 0.1 |
| Monte Carlo statistics | 0.6 |
| Total detector effects | 3.3 |
| Total systematic uncertainty | 3.5 |
4.1 Physics modelling
4.1.1 Bottom and charm physics modelling
Uncertainties in bottom and charm fragmentation and decay properties are discussed below. The variation of parameters is realized by reweighting Monte Carlo events to the modified distribution.
-
b fragmentation: Although the mean scaled energy of weakly decaying b hadrons is expected to change from LEP1 to LEP2 energies, the free parameter of the Peterson fragmentation function [11] used in the default MC for heavy flavour events is assumed not to vary with energy. The value in events is varied in the range , which corresponds to a variation of the mean scaled energy of weakly decaying b hadrons in decays in the range of [12]. In addition, the heavy-quark fragmentation model is changed to that suggested by Collins and Spiller [28] and to that of Kartvelishvili [29]. The largest difference in all the above tests is from the Peterson parameter variation and is taken as the systematic uncertainty.
-
b decay multiplicity: The multiplicity of the charged decay products of hadrons containing a b quark is varied in the Monte Carlo simulation according to [12].
-
b hadron composition: The tagging efficiency differs for the various b hadron species. The fractions of b hadrons and their uncertainties have been taken from [30]. The fractions and are varied independently within ranges of the experimental measurements, and their variation is compensated by the fraction of and mesons.
-
b hadron lifetimes: The lifetimes of the different b hadrons are varied in the Monte Carlo by their uncertainties according to [30].
-
c fragmentation: Simulated events have their Peterson fragmentation parameter varied in the range of . This corresponds to a variation of the mean scaled energy of weakly decaying c hadrons in decays in the range of [12].
-
c decay multiplicity: The average charged particle multiplicities of , and decays are varied in the Monte Carlo within the ranges of the experimental measurements [31].
-
c hadron composition: The fraction is written as . The last three parameters are varied independently by their uncertainties according to [32] to evaluate the uncertainty on the charm efficiency.
-
c hadron lifetimes: Charmed hadron lifetimes are varied within their experimental uncertainties according to [30].
4.1.2 Inclusive and production rate
The total production rates of and in the Monte Carlo are varied by 4% and 7% respectively according to [4]. This variation contributes an uncertainty of 0.18%.
4.1.3 Initial-final state interference
4.1.4 Four-fermion background
The uncertainties on the measured and cross-sections [2] and the uncertainty on the luminosity are found to have a negligible systematic effect on . The background from W- and Z-pairs has the highest probability to be accepted in the tagged sample when one or both bosons decay into a final state containing a charm- or bottom-quark. The systematic uncertainty on the W- and Z-pair tagging efficiency is estimated by varying the tagging efficiency by 5%. This variation introduces an uncertainty of 0.15%. The effect of the detector resolution is also taken into account, as described in Section 4.2.1.
4.1.5 Secondary heavy-quark production
As discussed in Section 3.3, the difference between the Monte Carlo rate for secondary production and the highest expected value is taken as an uncertainty. Typically, this process contributes a relative uncertainty of about 0.1%. The secondary production rate is taken from [24, 23] and weighted according to [26] as described in Section 3.3. The uncertainty on this estimation contributes a relative uncertainty of 0.13%.
4.1.6 Monte Carlo production
The transition has a small dependence on the Monte Carlo value of . The default Monte Carlo value of is varied within the measured uncertainty (Table 2). The effect on is negligible.
4.2 Detector effects
4.2.1 Track reconstruction
The detector performance in the Monte Carlo is varied as in [4, 18]. The effect of the detector resolution on the track parameters is estimated by degrading the resolution of all tracks in the Monte Carlo simulation. This is done by applying a single multiplicative scale factor to the difference between the reconstructed and true track parameters. A variation is applied independently to the and track parameters. These variations together contribute an uncertainty of 1.8%. In addition, the efficiency for assigning measurement points in the silicon microvertex detector to the tracks is varied by in and in . Each of these variations contributes an uncertainty of 1.3%. The track reconstruction efficiency is varied by 1%. This is done by randomly discarding 1% of the tracks, and contributes an uncertainty of 1.8%. The alignment of the silicon microvertex detector is changed in the Monte Carlo as in [4]. This variation gives an uncertainty of 0.4%. The systematic uncertainties resulting from the individual variations are summed in quadrature.
Since the largest part of this uncertainty is due to the effect on , we verify the validity of the 5% variation in the track parameters by using events that are rejected by the b-tagger. We look at the 182–209 GeV sample as well as at data collected in the same years at the peak for detector calibration. Events with a low value of in one hemisphere are selected, giving a sample dominated by light-quark pairs. The value of the vertex significance in the opposite hemisphere is then examined. Figure 3 shows the fraction of events with vertex significance less than a negative cut value in the data and in the Monte Carlo with 5% variation in the track parameters, normalised to the fraction in Monte Carlo. This study suggests that the difference between the data and the Monte Carlo is smaller than the variation on the Monte Carlo and we conclude that the 5% variation is adequate.

4.2.2 Lepton ID
The electron identification efficiency is varied by 15% and the electron fake rate by 30%. These values are 50% larger than those used in [5] following a later comparison of OPAL’s data and Monte Carlo. The muon identification efficiency is varied by 2% and the fake rate by 14%. This source contributes typically an uncertainty of 0.45% on which is predominantly from the variation on the electron identification efficiency.
4.2.3 Non-radiative event selection
We repeated the analysis using a different method for estimating , described in [33]. The resulting was found to be different by less than 0.1%. This comparison is almost free of statistical uncertainties; thus we take this difference as an uncertainty.
4.2.4 Monte Carlo statistics
The finite size of the Monte Carlo samples contributes between 0.6% and 0.8% uncertainty to the systematic error.
4.3 Cross-checks
As a cross-check, the analysis is repeated on data collected in the same years at the peak for detector calibration. A value of is obtained. The systematic uncertainty is determined as for the high-energy data samples. This result is consistent with the LEP1 average value of [2].
Another cross-check is made by comparing the likelihood of the hemisphere to contain a b-quark in Monte Carlo and data. This comparison is done for both the 182–209 GeV data and the calibration data at the peak. We select hemispheres where the b-tagger output in one hemisphere indicates a high probability for the event to be a event, and look at the opposite hemisphere. The samples are 60% and 88% pure in events for the high energy and the Z peak data respectively. We also look at hemispheres in events that are rejected by the b-tagger in the opposite hemisphere, giving samples with only 6% events. The results of this cross-check for the 182–209 GeV data and for the calibration data at the peak are shown in Figure 4. The small excess of data with respect to the Monte Carlo for in the anti-b-tagged plot of the 182–209 GeV sample (Figure 4 (b)) is covered by the detector resolution uncertainty. It is consistent with the result of the study shown in Figure 3 (a). The difference between the Monte Carlo and the data in the b-tagged 91 GeV plot (Figure 4 (c)) is also covered by the detector resolution uncertainty.

5 Results and conclusion
The production rate per non-radiative event has been measured using data collected by the OPAL detector at LEP at centre-of-mass energies between 182 GeV and 209 GeV. The results are summarized in Table 4, together with earlier OPAL results from 130-172 GeV [5]. The measurements are shown in Figure 5, where they are compared with the predictions of the Standard Model, calculated using Zfitter. Good agreement between the Standard Model and the measurements is observed. A comparison of the eight measurements reported here to the Standard Model prediction gives: , or 76% probability of obtaining a larger difference than observed. Since the test only uses the absolute difference between the prediction and measurement, we also made another test assuming that the ratio of the measurement to the prediction is constant. We perform a fit for the ratio using only the statistical uncertainties and add the systematic uncertainties, which are assumed to be fully correlated, to the result. We obtain a ratio of . Both tests suggest that these measurements are consistent with the Standard Model.
The measurement technique presented here has a larger selection efficiency and purity and thus yields a smaller statistical uncertainty and a smaller dependence on than the one used previously. The 183 GeV and 189 GeV results are in agreement with [5] and supersede the previous measurements.

| (GeV) | ||
|---|---|---|
| 133.3 [5] | -0.12 | |
| 161.3 [5] | -0.11 | |
| 172.1 [5] | -0.11 | |
| 182.7 | -0.085 | |
| 188.6 | -0.082 | |
| 191.6 | -0.088 | |
| 195.5 | -0.092 | |
| 199.5 | -0.083 | |
| 201.6 | -0.088 | |
| 205.3 | -0.088 | |
| 206.8 | -0.082 |
6 Acknowledgements
We particularly wish to thank the SL Division for the efficient operation
of the LEP accelerator at all energies
and for their close cooperation with
our experimental group. In addition to the support staff at our own
institutions we are pleased to acknowledge the
Department of Energy, USA,
National Science Foundation, USA,
Particle Physics and Astronomy Research Council, UK,
Natural Sciences and Engineering Research Council, Canada,
Israel Science Foundation, administered by the Israel
Academy of Science and Humanities,
Benoziyo Center for High Energy Physics,
Japanese Ministry of Education, Culture, Sports, Science and
Technology (MEXT) and a grant under the MEXT International
Science Research Program,
Japanese Society for the Promotion of Science (JSPS),
German Israeli Bi-national Science Foundation (GIF),
Bundesministerium für Bildung und Forschung, Germany,
National Research Council of Canada,
Hungarian Foundation for Scientific Research, OTKA T-038240,
and T-042864,
The NWO/NATO Fund for Scientific Research, the Netherlands.
References
- [1] G. Altarelli, T. Sjöstrand and F. Zwirner, Physics at LEP2 CERN-TH/96-01, Vol. 1, 1996.
-
[2]
For a recent overview, see:
The 4 LEP experiments: ALEPH, DELPHI, L3 and OPAL, the LEP Electroweak Working Group, and the SLD Heavy Flavour and Electroweak Groups, A Combination of Preliminary Electroweak Measurements and Constraints on the Standard Model, CERN-EP/2003-091, December 2003 and references within. - [3] OPAL Collaboration, G. Abbiendi et al., Eur. Phys. J. C33 (2004) 173.
- [4] OPAL Collaboration G. Abbiendi et al., Eur. Phys. J. C8 (1999) 217.
- [5] OPAL Collaboration, G. Abbiendi et al., Eur. Phys. J. C16 (2000) 41.
-
[6]
OPAL Collaboration, K. Ahmet et al., Nucl. Instr. and Meth. A305 (1991) 275;
O. Biebel et al., Nucl. Instr. and Meth. A323 (1992) 169;
M. Hauschild et al., Nucl. Instr. and Meth. A314 (1992) 74;
S. Anderson et al., Nucl. Instr. and Meth. A403 (1998) 326;
G. Abbiendi et al., Eur. Phys. J. C14 (2000) 373. -
[7]
S. Jadach, B.F.L. Ward and Z. Wa̧s, Phys. Lett B449 (1999) 97;
S. Jadach et al., Comp. Phys. Comm. 130 (2000) 260. - [8] J. Fujimoto et al., Comp. Phys. Comm. 100 (1997) 128.
- [9] S. Jadach et al., Comp. Phys. Comm. 119 (1999) 272.
- [10] T. Sjöstrand et al., Comp. Phys. Comm. 135 (2001) 238.
- [11] C. Peterson, D. Schlatter, I. Schmitt and P. M. Zerwas, Phys. Rev. D27 (1983) 105.
- [12] The LEP Collaborations, ALEPH, DELPHI, L3 and OPAL, Nucl. Instrum. Methods A378 (1996) 101. Updated averages are described in “Final input parameters for the LEP/SLD heavy flavour analyses”, LEPHF/2001-01 (see http://www.cern.ch/LEPEWWG/heavy/ ).
- [13] OPAL Collaboration, J. Allison et al., Nucl. Instr. and Meth. A317 (1992) 47.
-
[14]
D. Bardin et al., Comp. Phys. Commun. 133 (2001) 229;
we use Zfitter version 6.36 with default parameters, except FINR=0, BOXD=2, CONV=2 and INTF=0 or =1, and with the following input parameters: =91.1852 GeV, =174.3 GeV, =115 GeV, =0.02761, =0.1185. These parameters are used for compatibility with [3]. - [15] OPAL Collaboration, G. Alexander et al., Z. Phys.C52 (1991) 175.
- [16] OPAL Collaboration, K. Ackerstaff et al., Eur. Phys. J. C2 (1998) 213.
- [17] OPAL Collaboration, G. Abbiendi et al., Phys. Lett. B493 (2000) 249.
- [18] OPAL Collaboration, G. Abbiendi et al., Eur. Phys. J. C26 (2003) 479.
- [19] OPAL Collaboration, R. Akers et al., Z. Phys. C60 (1993) 199.
- [20] OPAL Collaboration, G. Alexander et al., Z. Phys. C70 (1996) 357.
-
[21]
G. Parisi, Phys. Lett. B74 (1978) 65;
J.F. Donoghue, F.E. Low and S.Y. Pi, Phys. Rev. D20 (1979) 2759. - [22] OPAL Collaboration, G. Abbiendi et al., Eur. Phys. J. C7 (1999) 407.
-
[23]
ALEPH Collaboration, R. Barate et al.,
Eur. Phys. J. C16 (2000) 597;
L3 Collaboration, M. Acciarri et al., Phys. Lett. B476 (2000) 243. - [24] OPAL Collaboration, G. Abbiendi et al., Eur. Phys. J. C13 (2000) 1.
-
[25]
ALEPH Collaboration, R. Barate et al.,
Phys. Lett. B434 (1998) 437;
DELPHI Collaboration, P. Abreu et al., Phys. Lett. B405 (1997) 202;
DELPHI Collaboration, P. Abreu et al., Phys. Lett. B462 (1999) 425;
OPAL Collaboration, G. Abbiendi et al., Eur. Phys. J. C18 (2001) 447;
SLD Collaboration, K. Abe et al., Phys. Lett. B507 (2001) 61. - [26] D.J. Miller, M.H. Seymour, Phys. Lett. B435 (1998) 213.
- [27] L. Lönnblad, Comp. Phys. Comm. 71 (1992) 15.
- [28] P. Collins and T. Spiller, J. Phys. G 11 (1985) 1289.
- [29] V.G. Kartvelishvili, A.K. Likhoded and V.A. Petrov, Phys. Lett. B 78 (1978) 615.
- [30] Particle Data Group, K. Hagiwara et al., Phys. Rev. D66 (2002) 1.
- [31] MARK III Collaboration, D. Coffman et al., Phys. Lett. B263 (1991) 135.
-
[32]
OPAL Collaboration, G. Abbiendi et al.,
Eur. Phys. J. C29 (2003) 463;
OPAL Collaboration, K. Ackerstaff et al., Eur. Phys. J. C7 (1999) 369. - [33] OPAL Collaboration, G. Alexander et al., Z. Phys. C72 (1996) 191.