SLAC-PUB-10783
BABAR-PROC-04/18
October, 2004
Search for – Mixing and Rare Charm Decays
U. Egede
Imperial College London
London, SW7 2AZ,
United Kingdom
(for the B AB AR Collaboration)
Abstract
Based on a dataset acquired by the BABAR experiment running on and near the resonance from 1999-2002, an upper limit is set on the rate of – mixing using the decay mode , followed by a semi-leptonic decay of the . Results are compared to previous BABAR analysis using hadronic decays. We also set limits on the flavor-changing neutral current decays () and the lepton-flavor violation decays .
Contributed to the Proceedings of the 5th Rencontres du Vietnam,
August 2004, Hanoi, Vietnam
Stanford Linear Accelerator Center, Stanford University, Stanford, CA 94309
Work supported in part by Department of Energy contract DE-AC03-76SF00515.
1 Overview
The BABAR experiment, which is documented in detail elsewhere[1], has since its start in 1999 not only given results on -physics but also a series of new results in charm physics. With a cross section of at the resonance compared to the cross section of around for production there is in fact a higher prompt charm production than production.
Here we present two new results from BABAR. The first one is a search for mixing between the neutral meson states in the semi-leptonic decay channel[2] while the other is a search for rare lepton decays of the neutral meson[3]. Both are processes that, if seen with the current statistics, would be clear signs of physics beyond the Standard Model (SM).
2 – mixing
Charm mixing is characterised by the two parameters and , where () is the mass (width) difference between the the two neutral mass eigenstates, and is the average width. We define the overall time-integrated mixing rate as .
Mixing between the neutral charm mesons is, within the SM, heavily suppressed by the GIM mechanism. The expected mixing rate through box and di-penguin diagrams is but enhancements involving non-pertubative effects are possible. For a recent review of predictions for both the SM rate and possible New Physics contributions see[4].
To search for mixing the production flavour of the -meson is tagged from the charge of the pion in the decay and the decay flavour is tagged from the charge of the electron in the decay . Charge conjugation is implied everywhere. The decay where the pion and the electron have opposite charge (called the wrong sign mode), can only proceed when the oscillates into a before its decay. The right sign mode where the pion and electron have the same charge is used as a normalisation mode. In an analysis where the efficiency for right sign and wrong sign decays are identical, is simply given as the time-integrated ratio of the two decay modes.
The analysis is based on a sample of and uses the sample while ignoring the less pure muon sample. The mass difference between the partially reconstructed candidate and the partially reconstructed candidate is together with particle identification the main selection criterion to obtain a pure sample.
Separate neural networks, with input parameters specifically describing the daughters and globally describing the rest of the event, are used to select signal events and reconstruct the momentum vector. The neural networks, combined with charged kaon and electron particle identification, provide a relatively pure selection of unmixed signal events and give a resolution in of .
The time distribution of the right sign control sample follows a simple exponential convoluted with a resolution function , while the wrong sign signal has the form
| (1) |
where is measured in units of the lifetime.
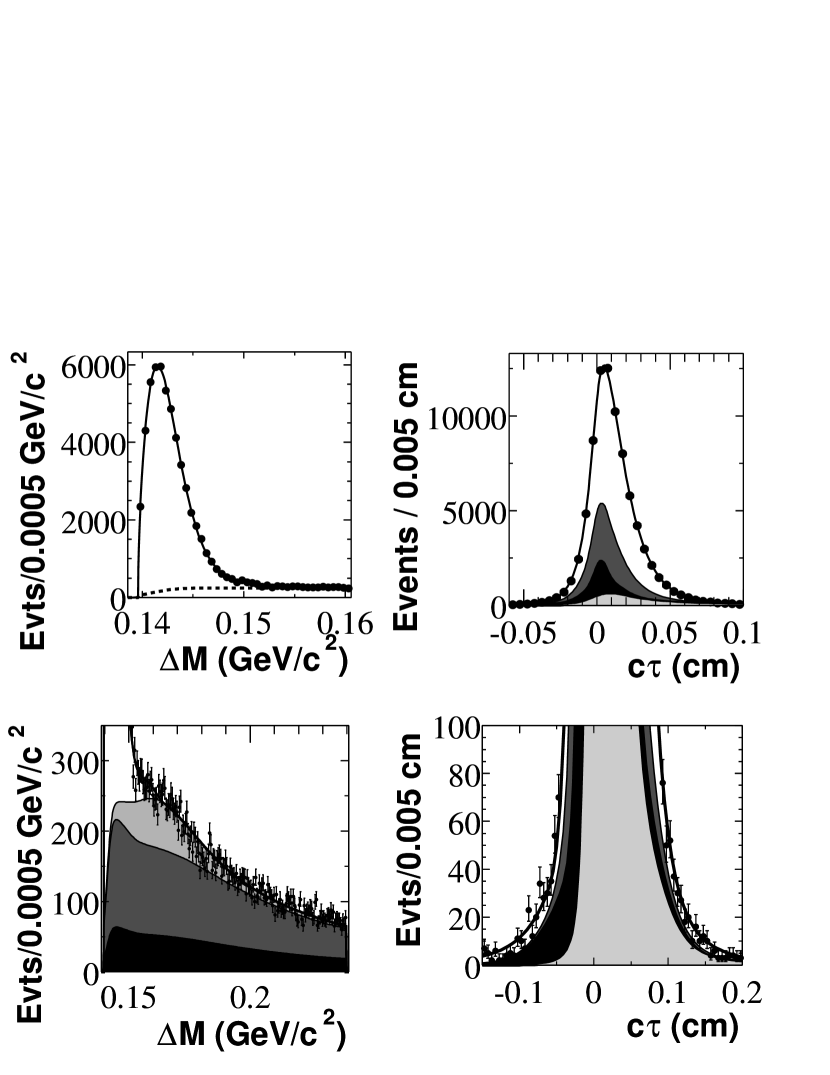
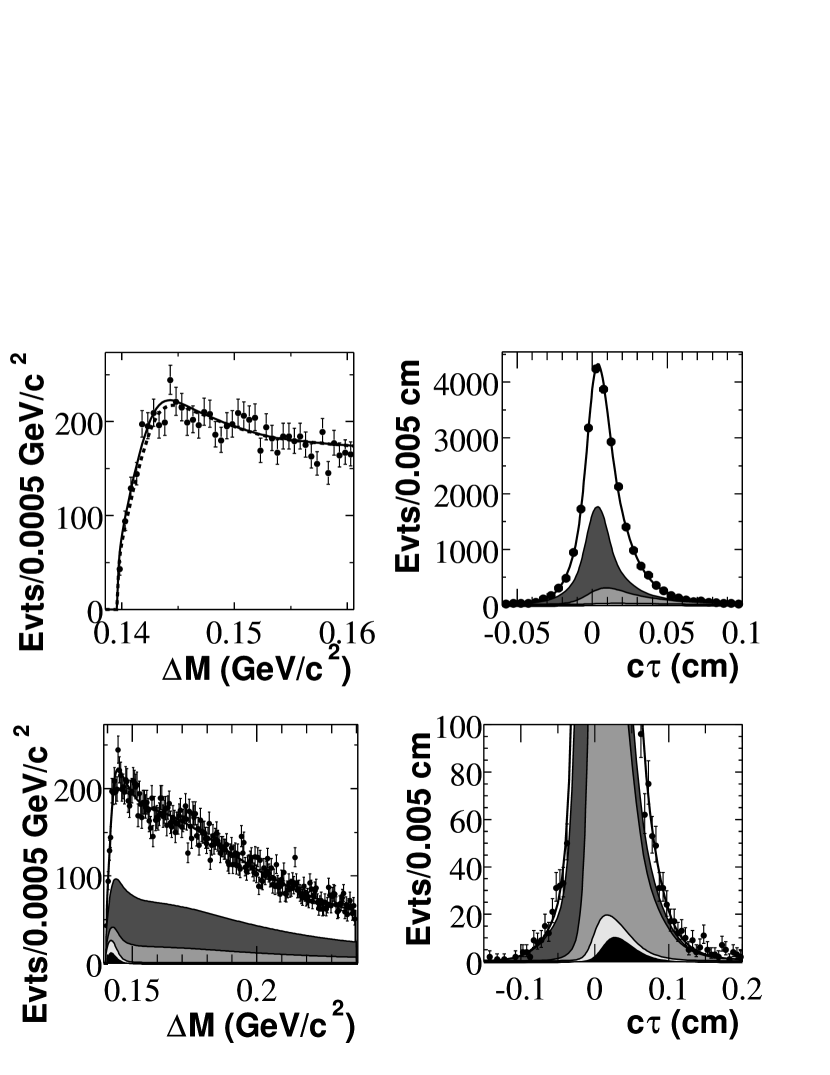
An unbinned extended likelihood fit is performed on the 2-dimensional distribution of signal and background in the variables and ; first on the right sign sample and then, with the shared parameters between the two datasets constrained, on the wrong sign sample. In Figs. 2 and 2, projections of the fit can be seen overlaid on the data. The result is a wrong sign signal yield of events.
Systematic errors arise mainly from the assumptions related to the shape of signal and background in the variable and when added in quadrature add up to 34% of the statistical error. Combining the wrong sign yield with the right sign yield we get the final result
| (2) | |||||
| (3) |
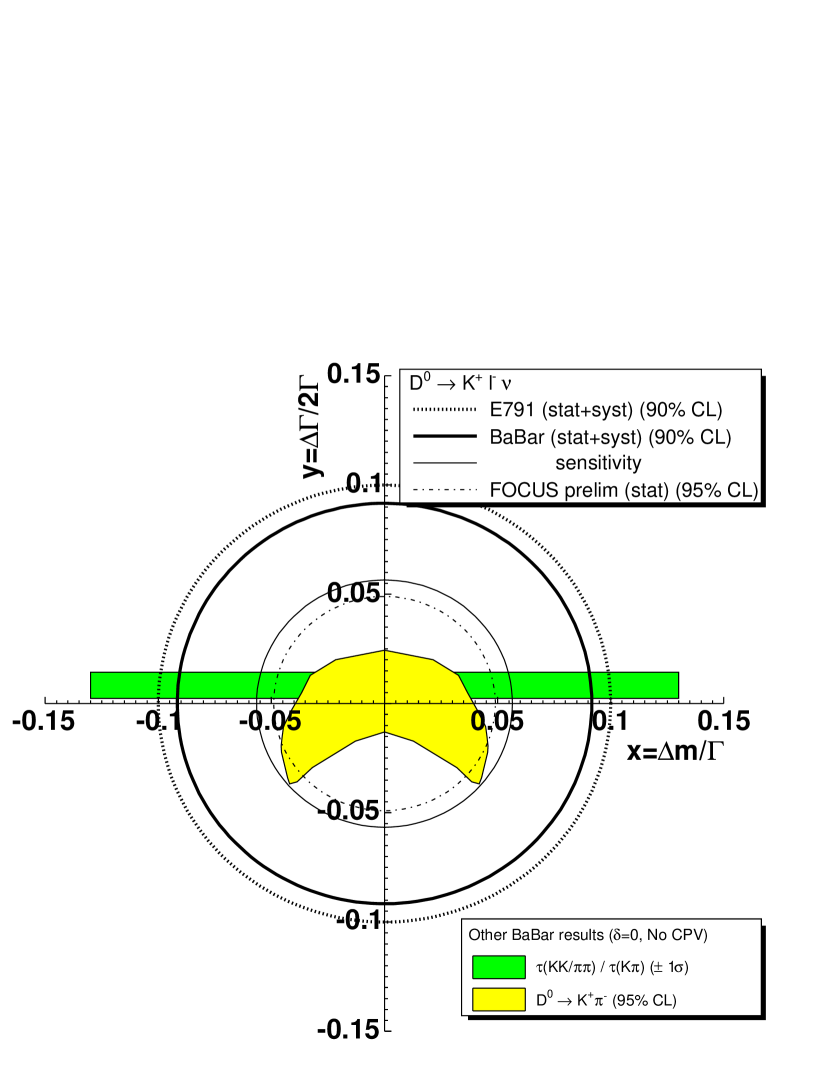
Systematics are taken into account by scaling the log likelihood curve for the fit to the wrong sign yield with the systematic error added in quadrature (). The upper limit was calculated assuming a flat prior for the number of wrong sign events to be positive. In Fig. 4, the result is compared to previous results.
3 Flavour-changing neutral current and lepton-flavour violating decays
In this analysis, a search is performed for the flavour-changing neutral current (FCNC) decays and and the lepton-flavour violating (LFV) decays . In the SM, the FCNC decays are highly suppressed by the GIM mechanism and the LFV decays are strictly forbidden. Compared to rare decay searches in the and sector, rare decays are sensitive to new physics involving the up-quark sector such as certain -parity violating supersymmetric models[9].
As in the previous analysis the is required to originate from a , but this time to ensure as clean a sample as possible. For the same reason, the is required to have a momentum above in the centre-of-mass frame to reduce background from combinatorics involving the decay products of mesons. Electrons (muons) are identified with an efficiency of 95% (60%) with a hadron misidentification probability of 0.2% (2%) as measured on a decay control sample.
The decay is used as a control sample as it has very similar kinematics and, as such, the systematic errors can be minimised. Apart from the particle identification, the selection of the control channel, is identical to the criteria used for the signal.
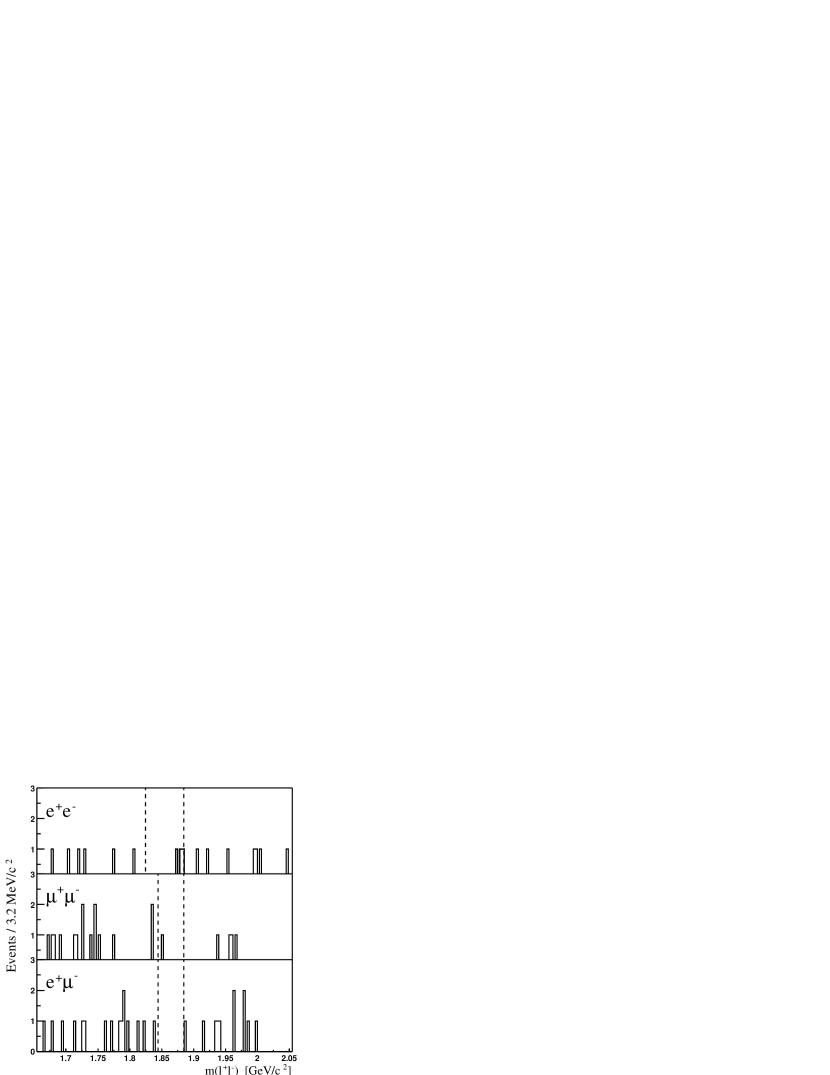
Based on a sample of 122 and after optimisation of the selection criteria the events seen in Fig. 4 remain. The background is estimated from the sidebands with a looser selection applied and then scaling it to the final selection taking the small correlation between the criteria into account.
We do not see any signal in any of the channels and the branching fraction upper limits have been calculated using an extension of the Feldman-Cousins method[10] that avoids the unwanted effect of the Feldman-Cousins method[11] that the UL for a search can go down in case of an upwards fluctuation in the expected background. Our result and a comparison to previous published results[12, 13] can be seen in Table 1.
| 3 | 1 | 0 | |
| UL at 90% CL | |||
| Previous published limit[12, 13] |
References
References
- [1] B. Aubert et al. [BABAR Collaboration], Nucl. Instrum. Meth. A 479, 1 (2002).
- [2] B. Aubert et al. [BABAR Collaboration], Accepted by Phys. Rev. D-RC, arXiv:hep-ex/0408066.
- [3] B. Aubert et al. [BABAR Collaboration], Accepted by Phys. Rev. Lett, arXiv:hep-ex/0408023.
- [4] A. A. Petrov, eConf C030603, MEC05 (2003) [arXiv:hep-ph/0311371].
- [5] E. M. Aitala et al. [E791 Collaboration], Phys. Rev. Lett. 77, 2384 (1996)
- [6] S. Malvezzi [FOCUS Collaboration], ICHEP 2002: Nucl. Phys. B. (Proc. Suppl.) Vol. 117. (April 2003)
- [7] B. Aubert et al. [BABAR Collaboration], Phys. Rev. Lett. 91, 121801 (2003)
- [8] B. Aubert et al. [BABAR Collaboration], Phys. Rev. Lett. 91, 171801 (2003)
- [9] G. Burdman, E. Golowich, J. Hewett and S. Pakvasa, Phys. Rev. D 66, 014009 (2002).
- [10] J. Conrad et al., Phys. Rev. D 67, 012002 (2003).
- [11] G. J. Feldman and R. D. Cousins, Phys. Rev. D 57, 3873 (1998).
- [12] E. M. Aitala et al. [E791 Collaboration], Phys. Lett. B 462, 401 (1999).
- [13] I. Abt et al. [HERA-B Collaboration], Phys. Lett. B 596, 173 (2004).