\runtitleConstraints upon the CKM angle
\runauthorA. Schwartz
UCHEP-04-01
Constraints upon the CKM angle from Belle and BaBar
A. J. Schwartz
Physics Department
University of Cincinnati
P.O. Box 210011
Cincinnati, Ohio 45221
Abstract
The Belle and BaBar experiments have measured branching
fractions and asymmetries in the charmless decay modes
, , and . From these
measurements, contraints upon the CKM angle can be
obtained. These constraints consistently indicate that
is around 100∘.
1 INTRODUCTION
The Standard Model predicts violation to occur in
meson decays owing to a complex phase in the
Cabibbo-Kobayashi-Maskawa (CKM) mixing matrix. This phase
is illustrated by plotting the unitarity condition
as vectors in the complex plane: the phase results in
a triangle of nonzero height. One interior angle of the
triangle, denoted or , is determined from
decays.111Charge-conjugate modes
are included throughout this paper unless noted otherwise.
Another interior angle, or , is determined
from charmless decays such as , , and .
To determine requires measuring time-dependent decay
rates; here we present such measurements from the
Belle [1] and BaBar [2] experiments.
In neutral meson decays, violation arises
predominantly because of interference between a
decay amplitude and a amplitude. For the
final states considered here, there are two decay amplitudes
possible: a “tree” and a “penguin”
(see Fig. 1). Because these amplitudes have
different weak phases, additional information is needed
to determine , such as the size of the penguin
amplitude or the difference in strong phases between
the penguin and tree amplitudes.
Figure 1: Tree-level diagram (top) and penguin diagram
(bottom) for , , and decays.
2 ANALYSIS
The analyses of , , and decays have
several similarities. Events are selected by requiring two
opposite-charge pion-candidate tracks originating from the
interaction region, and appending zero, one, or two ’s.
The charged pion identification criteria are based on
information from either a DIRC detector (BaBar) [3]
or time-of-flight counters and aerogel cherenkov
counters (Belle) [4]. Both experiments also
use information from the central tracking chamber.
decays are identified via two
kinematic variables: the “beam-constrained” mass, ,
and the energy difference, . The former
is defined as and
the latter as , where
is the reconstructed momentum,
is the reconstructed energy,
and is the beam energy, all evaluated in
the center-of-mass (CM) frame.
After selection cuts, the and distributions
are jointly fit for the signal event yields.
This fit includes contributions from backgrounds,
whose - distributions are obtained from
either Monte Carlo (MC) simulation or extrapolation
from - sidebands.
A tagging algorithm is used to identify the flavor of the
signal decay, i.e., whether it is or .
This algorithm examines tracks not associated with the
signal decay to identify the flavor of the non-signal .
It depends predominantly on identifying leptons or
kaons. The signal-side tracks are fit for a signal
decay vertex, and the tag-side tracks are fit for
a tag-side decay vertex; the distance
between vertices is to good approximation proportional
to the time difference between the decays:
, where
is the Lorentz boost of the
system and equals 0.43 (0.56) for Belle (BaBar).
One subsequently does an unbinned maximum likelihood (ML)
fit to to measure or constrain .
The dominant background for all three decays is
continuum events, where
. To distinguish such events from
events, the event topology
is used: in the CM frame, continuum events tend to be
collimated along the beam directions while
events tend to be spherical. In Belle, the “shape” of
an event is typically quantified via Fox-Wolfram
moments [5] of the form
,
where runs over all tracks on the tagging side and
runs over all tracks on either the tagging side or
the signal side. The function is the th
Legendre polynomial and is the angle
between momenta and .
These moments are combined into a Fisher
discriminant [6], and the discriminant
is subsequently combined with the probability
density function (pdf) for the cosine of the angle
between the direction and the electron beam
direction. This yields an overall likelihood ,
which is evaluated for both a hypothesis
and a continuum hypothesis. Signal events are
separated from continuum events by cutting on the
likelihood ratio .
In BaBar, signal is separated from continuum
background using several methods.
For , a cut is imposed, where
is the angle between the sphericity axis of
the candidate and that of the rest of the event.
A Fisher discriminant () is then constructed
from and ,
where is the momentum of particle ,
is the angle between and the thrust axis
(both evaluated in the CM frame), and runs over
all particles not associated with the decay. A pdf for
is included in the ML fit to . For and one [7] of two analyses, a neural
network is used that includes the two event-shape variables from
. The output of the neural network is included in the
fit. For the other analysis [8],
a cut is made, where
is the angle between the thrust axis of the candidate and
that of the rest of the event. The analysis subsequently uses
a Fisher discriminant constructed from 11 observables.
3
The decay time dependence of
decays is given by [9]
(1)
where () corresponds to ()
tags, and is the - mass difference. The
parameters and are -violating and
related to via [10]
(2)
(3)
(4)
where [11],
is the magnitude of the penguin amplitude relative
to that of the tree amplitude, and is the strong phase
difference between the two amplitudes. If there were no penguin
contribution, , , and
.
Since Eqs. (2) and (3) have three
unknown parameters, measuring and determines
a volume in - - space.
The most recent Belle measurement of and is
with 140 fb-1 of data [12]. Candidates must
satisfy
and GeV; the final event sample consists
of 224 candidates and 149 candidates after background subtraction. The ratio of
signal to background is 0.3. These events are
subjected to an unbinned ML fit to , in which
additional pdf’s and resolution functions are included
to account for backgrounds. There are two free parameters
in the fit, and the results are
and
.
These values are consistent with previous
Belle measurements [13] and
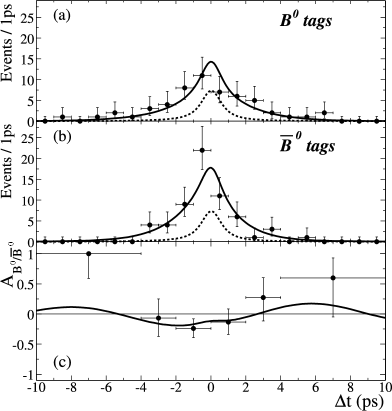
indicate large violation. Fig. 2
shows the distributions for the
samples; a clear difference is seen between the
distributions. Many cross-checks have been done
for this analysis, including an independent “blind”
analysis using a binned ML fit. The latter results
are very close to those of the main fit.
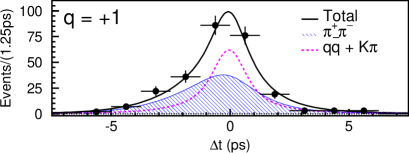
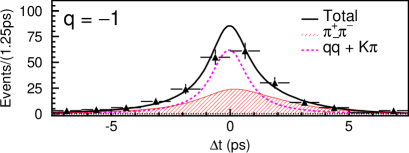
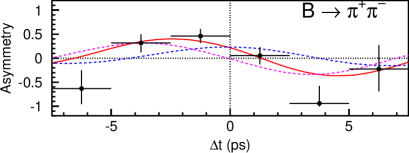
Figure 2: Belle results for [12]:
the distributions of tags (top),
tags (middle), and the resulting asymmetry (bottom).
The smooth curves are projections of the unbinned ML fit.
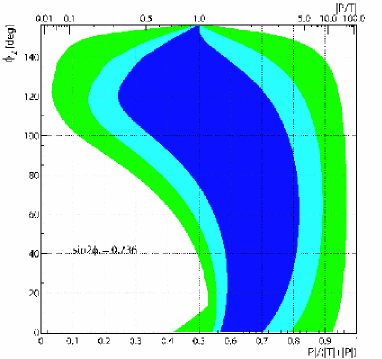
The Belle values for and prescribe a
95% C.L. volume in - - space.
Slicing this volume at fixed gives a 95% C.L. constraint
in the - plane; slicing this volume at fixed
gives a constraint in the - plane.
Two such projections are shown in Figs. 3a
and 3b; the resulting constraints are
for
(as predicted by QCD factorization [14]
and perturbative QCD [15]), and
for any value of .
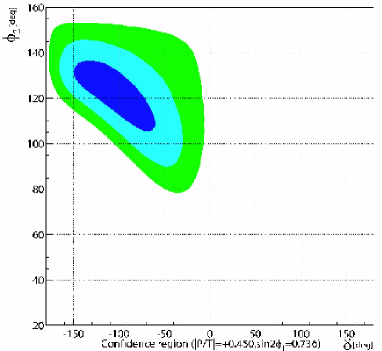
Figure 3: Belle results for :
(a) constraints in the - plane for
; and
(b) constraints in the -
plane for all values of .
The dark blue region corresponds to C.L.,
the light blue region to 90% C.L., and the green
region to 95% C.L.
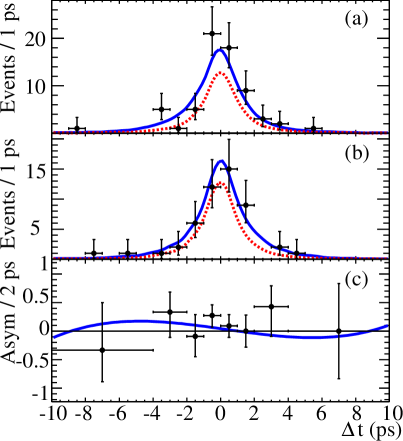
The BaBar experiment has also measured and using an unbinned ML fit [16].
The most recent result is from 205 fb-1 of
data [17]; the values obtained are
and .
These values
are inconsistent with the Belle result at the level
of [11].
The BaBar analysis differs from that of Belle in that
fewer cuts are made to enrich the data sample; rather,
additional pdf’s for the discriminating variables are
included in the likelihood function.
A total of 68 030 events are fit, and a signal yield of
decays is obtained. There are 46 free
parameters (including and ) in the fit.
The Belle and BaBar results can be averaged together
to constrain . However, such a constraint requires
knowledge or assumptions about or .
A model based on symmetry (and including an
-breaking factor for tree
amplitudes) and the measured rates
for and indicates
[18]
(note: this uses the BaBar result for 113 fb-1 of data).
A preferred method is to use isopin symmetry and the
measured rates for , ,
and charge-conjugates; this method can determine with little theoretical uncertainty [19].
However, the decay has only recently
been observed and the asymmetry between and
measured [20]. Future measurements with
higher statistics should yield an interesting constraint
on . The overall
branching fraction can be used to obtain an upper
bound [21] on the angular difference
,
where
(i.e., as ).
Using and the most recent values of the
above branching fractions [11] fluctuated
by in the conservative direction, one
obtains .
4
For , the final state is not a eigenstate.
There are thus four separate decays to consider:
and .
The decay rates can be parametrized as [22]
(5)
where () corresponds to ()
tags. The parameters and are -violating,
while the parameters
and are -conserving.
characterizes the
difference in rates between “” processes
or and
“” processes
or
(see Fig. 1).
depends, in addition,
on differences in phases between
and amplitudes.
The parameter is equal to the time
and flavor integrated asymmetry:
divided by the sum of the four rates. We also define
two separate asymmetries:
(6)
(7)
depends only on processes and
depends only on processes.
Both BaBar and Belle have done unbinned ML fits to the
distributions of decays
to determine ,
, , and .
The Belle analysis is with 140 fb-1 of data [23];
the BaBar analysis, originally with 81 fb-1 of data [24],
has been updated with 113 fb-1 [25].
To remove charge-ambiguous decays and possible interference
between and amplitudes, one must
eliminate the overlap region of the Dalitz
plot. Belle does this by requiring
GeV/ and GeV/. BaBar makes the
looser selection
GeV/ and requires that not be in this range.
In addition, BaBar requires that the bachelor
track from has GeV/, where is
evaluated in the CM frame; only 14% of pions
from (selected) decays satisfy this requirement.
Finally, Belle requires GeV/ to avoid the overlap region between
and .
Belle subsequently defines a signal region
GeV/ and
.
There are 1215 events in this region that pass all selection
requirements. Fitting to the - distributions yields
329 candidates. The resulting distributions
for tagged events are shown in Fig. 4
along with projections of the unbinned ML fit in .
Also shown is the asymmetry, which is consistent with zero.
Figure 4: Belle results for [23]:
the distributions of tags (left),
tags (right), and the resulting asymmetry (bottom
rows). The asymmetry is shown separately for high-quality
tags () and low quality tags (). The
smooth curves are projections of the unbinned ML fit.
The BaBar results are similar to those from Belle;
the corresponding distributions and asymmetry
are shown in Fig. 5. All Belle and BaBar results are listed in Table 1. There is very
good agreement between the measurements except for
, where the disagreement
is . A recent BaBar analysis with 192 fb-1
of data [26] uses a different strategy than the
quasi-two-body approach: it takes advantage of interference
in the Dalitz plot as prescribed in
Ref. [27]. These results are also listed
in Table 1 for comparison; they are
very similar to those from the quasi-two-body analyses.
Figure 5: BaBar results for [24]:
the distributions of tags (top),
tags (middle), and the resulting asymmetry (bottom).
The smooth curves are projections of the unbinned ML fit.
Table 1: Results of fits to the
distributions for candidates.
Belle 2-body
BaBar 2-body
BaBar Dalitz
(140 fb-1)
(113 fb-1)
(192 fb-1)
These measured values can be used to constrain ;
however, since the penguin contribution is unknown, additional
information is needed. A recent theoretical model [28]
uses symmetry and the measured rates or limits
for branching fractions of
,
,
, and
.
-breaking effects are considered at tree level and
accounted for via a factor . The strong phase
difference between the two tree amplitudes ( and
spectator ) is assumed to be small, as predicted
by factorization. The resulting central values and errors
for are:
for Belle values of , ,
, ;
for BaBar values (113 fb-1); and
for Belle and BaBar values combined.
The BaBar Dalitz plot analysis (192 fb-1) [26]
allows one to directly fit for with little
theoretical uncertainty from the penguin contribution.
The result is
,
consistent with the -based results above.
5
The decay has two vector particles
in the final state. If the mesons
are longitudinally polarized, is even
and ; but if they are transversely polarized,
can be even or odd and the final state is not
a eigenstate.
For longitudinal
polarization, can be determined
from the distribution as done for .
However, has an advantage:
the penguin contribution is expected to be small
relative to the tree contribution [29],
which reduces theoretical uncertainty on .
Unfortunately is more challenging experimentally:
there are several backgrounds and also possible nonresonant
contributions. The method depends upon the ’s being
longitudinally polarized; otherwise a more involved angular
analysis is necessary to determine [30].
Finally, the nonnegligible decay width of the allows for
final states, which complicates extracting via
an isospin analysis [31].
The decay has been observed by BaBar and the
-violating parameters and measured
with 81 fb-1 of data [7, 8]
and updated with 113 fb-1 of data [25].
A similar analysis is underway at Belle with 250 fb-1 of data.
The final state consists of four pions, two charged and two neutral.
In the case of multiple candidates arising from multiple
candidates, the candidate that minimizes
the sum
is chosen, where runs over the candidates.
From MC simulation, it is found that one or more pions from
are swapped with pions from the tag side 39% (16%)
of the time for longitudinal (transverse) polarization.
BaBar selects events with relatively loose cuts and
does an unbinned ML fit to the distribution,
including pdf’s to account for backgrounds. Nonresonant
contributions and interference with decays yielding the
same final state,
e.g., , are estimated to be small
and neglected. For 81 fb-1 of data, 24 288 events
are fit and a signal yield of is obtained.
The fit includes a pdf for the angles and
, where is the angle between
the from and the
in the rest frame (). This pdf has
the form [32]
(8)
and determines , the fraction
of longitudinally polarized decays.
The fit results are
and
(113 fb-1),
and
(81 fb-1).
The first error listed is statistical and the second systematic.
It is fortunate that is close to unity;
in this case the final state has and
an angular analysis to determine is
unnecessary. Fig. 6 shows
the distributions for
tagged events along with the resulting asymmetry. No violation is observed. Inputting
the measured values for and into
an isospin analysis that includes the branching
fractions for [7] and
[33], and the upper
limit for [34], one
obtains [35].
The last error is due to the penguin contribution; it is significantly
smaller than that for (), as expected.
Figure 6: BaBar results for [7]:
the distributions of tags (top),
tags (middle), and the resulting asymmetry (bottom).
The smooth curves are projections of the unbinned ML fit.
6 SUMMARY
Time-dependent asymmetries in , , and decays are measured and used to constrain the CKM angle .
The mode is experimentally clean but has the largest penguin
contribution, which contributes theoretical uncertainty to .
A model-independent constraint is
for (95% C.L.).
An -based model [18] indicates
(and also that
is large). Belle observes large violation in this
mode while BaBar does not.
The mode is more complicated as there
are more backgrounds than for and the final state is
not a eigenstate. A model based upon symmetry
and using the measured branching fractions for
and obtains
(Belle + BaBar quasi-two-body results
combined).
The mode has the smallest penguin contribution
but suffers from additional backgrounds, possible nonresonant
contributions, and a possible component in the final state.
Neglecting the latter two effects, BaBar measures and for longitudinal polarization, which dominates
the decay. Combining the measured values with the branching
fractions or limits for [7],
[33], and
[34] gives
[35].
This value is similar to those obtained from
measurements of and
decays.
References
[1]http://belle.kek.jp/
[2]http://www.slac.stanford.edu/BFROOT/
[3] B. Aubert et al.,
Nucl. Instr. Meth. A 479 (2002) 1.
[4] A. Abashian et al.,
Nucl. Instr. Meth. A 479 (2002) 117.
[5] G. C. Fox and S. Wolfram,
Phys. Rev. Lett. 41 (1978) 1581.
[6] B. Casey et al.,
Phys. Rev. D 66 (2002) 092002.
[7] B. Aubert et al.,
Phys. Rev. D 69 (2004) 031102.
[8] B. Aubert et al.,
hep-ex/0404029 (2004).
[9] M. Gronau, Phys. Rev. Lett. 63 (1989) 1451.
[10] M. Gronau and J. L. Rosner,
Phys. Rev. D 65 (2002) 093012.
[11]http://www.slac.stanford.edu/xorg/hfag/
[12] K. Abe et al.,
Phys. Rev. Lett. 93 (2004) 021601.
[13]
K. Abe et al., Phys. Rev. D 68 (2003) 012001.
[14] M. Beneke et al.,
Nucl. Phys. B 606 (2001) 245;
M. Beneke and M. Neubert, Nucl. Phys. B 675 (2003) 333.
[15] Y. Y. Keum and A. A. Sanda,
Phys. Rev. D 67 (2003) 054009.
[16] B. Aubert et al.,
Phys. Rev. Lett. 89 (2002) 281802.
[17] B. Aubert et al.,
hep-ex/0408089 (2004).
[18]
M. Gronau and J. L. Rosner, Phys. Lett. B 595 (2004) 339.
[19]
M. Gronau and D. London, Phys. Rev. Lett. 65 (1990) 3381.
[20] K. Abe et al., hep-ex/0408101 (2004).
[21] M. Gronau et al., Phys. Lett. B 514 (2001) 315;
J. Charles, Phys. Rev. D 59 (1999) 054007;
Y. Grossman and H. R. Quinn, Phys. Rev. D 58 (1998) 017504.
[22] M. Gronau, Phys. Lett. B 233 (1989) 479.
[23] C. C. Wang et al., hep-ex/0408003 (2004).
[24] B. Aubert et al.,
Phys. Rev. Lett. 91 (2003) 201802.
[25] L. Roos (for BaBar), hep-ex/0407051 (2004).
[26] B. Aubert et al., hep-ex/0408099 (2004).
[27] H. R. Quinn and A. E. Snyder,
Phys. Rev. D 48 (1993) 2139.
[28] M. Gronau and J. Zupan, hep-ph/0407002 (2004).
[29] R. Aleksan et al.,
Phys. Lett. B 356 (1995) 95.
[30] I. Dunietz et al.,
Phys. Rev. D 43 (1991) 2193.
[31] A. F. Falk et al.,
Phys. Rev. D 69 (2004) 011502.
[32]
K. Abe, M. Satpathy, and H. Yamamoto, hep-ex/0103002 (2001).
[33] J. Zhang et al.,
Phys. Rev. Lett. 91 (2003) 221801;
B. Aubert et al., Phys. Rev. Lett. 91 (2003) 171802.
[34] B. Aubert et al., hep-ex/0408061 (2004).
[35] M. A. Giorgi, “Recent Results on
CP Violation in B Decays,” presented at
XXXII Int. Conf. on High Energy Physics, Beijing, China,
16-22 August 2004.