System Size and Centrality Dependence
of the Balance Function in A + A
Collisions at GeV
The NA49 Collaboration
Abstract
Electric charge correlations were studied for p+p, C+C, Si+Si and centrality selected Pb+Pb collisions at GeV with the NA49 large acceptance detector at the CERN-SPS. In particular, long range pseudo-rapidity correlations of oppositely charged particles were measured using the Balance Function method. The width of the Balance Function decreases with increasing system size and centrality of the reactions. This decrease could be related to an increasing delay of hadronization in central Pb+Pb collisions.
The NA49 Collaboration
C. Alt9, T. Anticic21, B. Baatar8,D. Barna4, J. Bartke6, L. Betev9,10, H. Białkowska19, A. Billmeier9, C. Blume9, B. Boimska19, M. Botje1, J. Bracinik3, R. Bramm9, R. Brun10, P. Bunčić9,10, V. Cerny3, P. Christakoglou2, O. Chvala15, J.G. Cramer17, P. Csató4, N. Darmenov18, A. Dimitrov18, P. Dinkelaker9, V. Eckardt14, G. Farantatos2, D. Flierl9, Z. Fodor4, P. Foka7, P. Freund14, V. Friese7, J. Gál4, M. Gaździcki9,12, G. Georgopoulos2, E. Gładysz6, K. Grebieszkow20, S. Hegyi4, C. Höhne13, K. Kadija21, A. Karev14, M. Kliemant9, S. Kniege9, V.I. Kolesnikov8, T. Kollegger9, E. Kornas6, R. Korus12, M. Kowalski6, I. Kraus7, M. Kreps3, M. van Leeuwen1, P. Lévai4, L. Litov18, B. Lungwitz9, M. Makariev18, A.I. Malakhov8, C. Markert7, M. Mateev18, B.W. Mayes11, G.L. Melkumov8, C. Meurer9, A. Mischke7, M. Mitrovski9, J. Molnár4, S. Mrówczyński12, G. Pálla4, A.D. Panagiotou2, D. Panayotov18, A. Petridis2, M. Pikna3, L. Pinsky11, F. Pühlhofer13, J.G. Reid17, R. Renfordt9, A. Richard9, C. Roland5, G. Roland5, M. Rybczyński12, A. Rybicki6,10, A. Sandoval7, H. Sann7, N. Schmitz14, P. Seyboth14, F. Siklér4, B. Sitar3, E. Skrzypczak20, G. Stefanek12, R. Stock9, H. Ströbele9, T. Susa21, I. Szentpétery4, J. Sziklai4, V. Trubnikov20, D. Varga4, M. Vassiliou2, G.I. Veres4,5, G. Vesztergombi4, D. Vranić7, A. Wetzler9, Z. Włodarczyk12 I.K. Yoo16, J. Zaranek9, J. Zimányi4
1NIKHEF, Amsterdam, Netherlands.
2Department of Physics, University of Athens, Athens, Greece.
3Comenius University, Bratislava, Slovakia.
4KFKI Research Institute for Particle and Nuclear Physics, Budapest, Hungary.
5MIT, Cambridge, USA.
6Institute of Nuclear Physics, Cracow, Poland.
7Gesellschaft für Schwerionenforschung (GSI), Darmstadt, Germany.
8Joint Institute for Nuclear Research, Dubna, Russia.
9Fachbereich Physik der Universität, Frankfurt, Germany.
10CERN, Geneva, Switzerland.
11University of Houston, Houston, TX, USA.
12Institute of Physics Świ etokrzyska Academy, Kielce, Poland.
13Fachbereich Physik der Universität, Marburg, Germany.
14Max-Planck-Institut für Physik, Munich, Germany.
15Institute of Particle and Nuclear Physics, Charles University, Prague, Czech Republic.
16Department of Physics, Pusan National University, Pusan, Republic of Korea.
17Nuclear Physics Laboratory, University of Washington, Seattle, WA, USA.
18Atomic Physics Department, Sofia University St. Kliment Ohridski, Sofia, Bulgaria.
19Institute for Nuclear Studies, Warsaw, Poland.
20Institute for Experimental Physics, University of Warsaw, Warsaw, Poland.
21Rudjer Boskovic Institute, Zagreb, Croatia.
1 Introduction
Collisions of heavy ions have been used throughout the last decades in order to investigate the possible formation of the quark-gluon plasma (QGP) [1], by studying a variety of characteristics [2]. At the early stage of these collisions an extended region with large energy density may be produced, where hadronic may be replaced by quark-gluon degrees of freedom possibly leading to a new partonic phase of matter. In the subsequent evolution, the system dilutes and cools down, hadronizes and finally decays into free hadrons. These final state hadrons carry only indirect information about the early stage of the collision.
Numerous observables, such as particle yields and measures of correlations and fluctuations, have been proposed that could signal the possible transition from the hadronic to the partonic phase. Recent data suggest that conditions, consistent with the occurrence of the QCD phase transition, are indeed reached [3] in Pb+Pb collisions at 158A GeV at the CERN SPS. Moreover, results from the study of the energy dependence of single particle yields and spectra, suggest that a deconfined phase starts to be formed in the early stage of the reaction at low SPS energies [4]. The study of correlations and fluctuations is expected to provide additional information on the reaction mechanism of high energy nuclear collisions. In particular, event-by-event charge and mean fluctuations, have been analyzed over the past years [5]. Another important measure of correlations, the Balance Function (BF), was introduced by Bass, Danielewicz and Pratt [6]. It measures the correlation of the oppositely charged particles produced during a heavy ion collision and its width can be related to the time of hadronization. The BF is derived from the charge correlation function that was used to study the hadronization of jets in p+p collisions at the ISR [7] and annihilations at PETRA [8]. The first results on the BF were obtained for Au+Au collisions by the STAR collaboration at RHIC [9].
In this paper we study the BF in p+p, C+C, Si+Si and centrality selected Pb+Pb collisions at a beam energy of 158A GeV, corresponding to a center-of-mass energy of GeV per nucleon pair. The data were obtained with the NA49 detector at the CERN SPS.
2 The Balance Function Method
The motivation for studying the Balance Function comes from the idea that hadrons are produced locally as oppositely charged particle pairs. Particles of such a pair are separated in rapidity due to the initial momentum difference and secondary interactions with other particles.
Particles of a pair that was created earlier are separated further in rapidity because of the expected large initial momentum difference and the long lasting rescattering phase. On the other hand, oppositely charged particle pairs that were created later are correlated within a smaller interval of the relative rapidity. Our aim is to measure the degree of this separation of the balancing charges and to find possible indications for delayed hadronization.
In this paper the BF is used in order to examine the pseudo-rapidity () correlation of charged particles. It is defined as a difference of the correlation function of oppositely charged particles and the correlation function of like-charge particles normalized to the total number of particles. The general definition of the BF reads [6]:
| (1) |
where and could be different kinds of particles, whereas and could be intervals in pseudo-rapidity. For example could refer to all negative particles and to all positive particles. Alternatively could be an interval of the relative pseudo-rapidity of the oppositely charged particles, whereas could be the interval of the pseudo-rapidity of the produced particles that is covered by the detector. In the numerator, represents a conditional probability of observing a particle of type in bin given the existence of a particle of type in bin . The terms , , and are calculated using pairs from each event and the resulting values are summed over all events. For example, the term is calculated by counting all possible combinations of a positive particle in and a negative particle in in an event and summing the number of combinations over all events. The other three terms are calculated analogously. The terms and are the total number of negative and positive particles, respectively, that are within the studied pseudo-rapidity interval , summed over all events.
In our case, and are the negative and positive particles respectively that are within the pseudo-rapidity interval and have a pseudo-rapidity difference . So the definition of the BF takes the following form:
| (2) |
The most interesting property of the BF is its width. Early stage hadronization is expected to result in a broad BF, while late stage hadronization leads to a narrower distribution [6]. The width of the BF can be characterized by the weighted average :
| (3) |
where i is the bin number of the BF histogram.
3 Experimental Setup
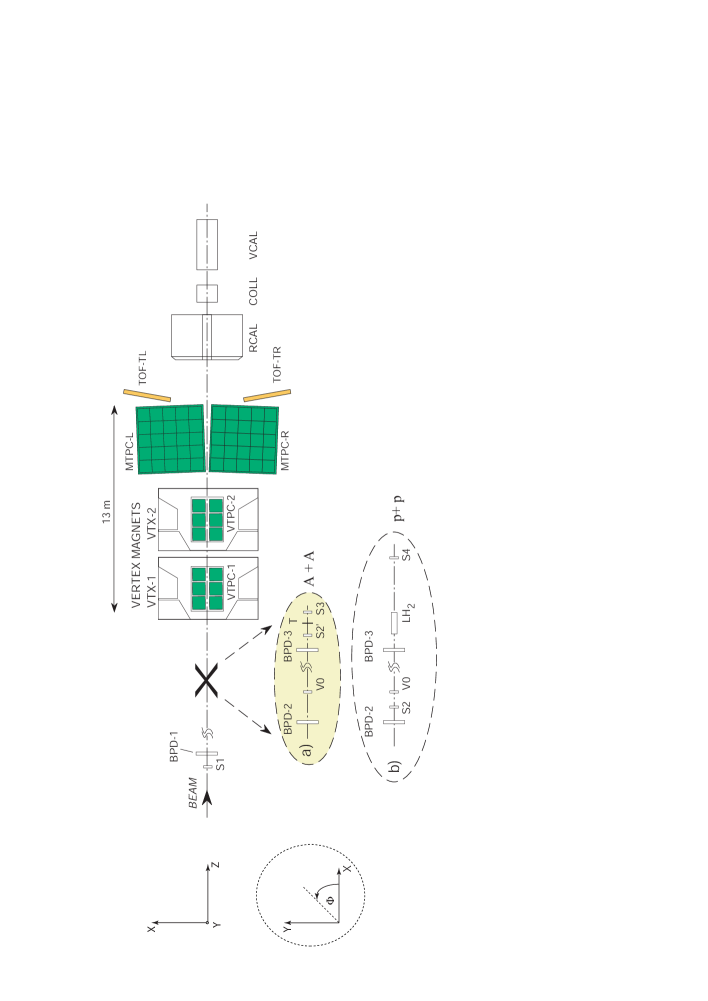
The NA49 detector [10] is a wide acceptance hadron spectrometer for the study of hadron production in collisions of hadrons or heavy ions at the CERN SPS. The main components are four large-volume Time Projection Chambers (TPCs) (Fig. 1) which are capable of detecting 80% of some 1500 charged particles created in a central Pb+Pb collision at 158A GeV. Two chambers, the Vertex TPCs (VTPC-1 and VTPC-2), are located in the magnetic field of two super-conducting dipole magnets (1.5 and 1.1 T, respectively), while the two others (MTPC-L and MTPC-R) are positioned downstream of the magnets symmetrically to the beam line. The set–up is supplemented by two Time of Flight (TOF) detector arrays and a set of calorimeters. The data presented in this paper are analyzed with a global tracking scheme [11], which combines track segments that belong to the same physical particle but were detected in different TPCs. The NA49 TPCs allow precise measurements of particle momenta with a resolution of (GeV/c)-1.
The targets are C (561 mg/cm2), Si (1170 mg/cm2) disks and a Pb (224 mg/cm2) foil for ion collisions and a liquid hydrogen cylinder (length 20 cm) for hadron interactions. They are positioned about 80 cm upstream from VTPC-1.
Pb beam particles are identified by means of their charge as seen by a Helium Gas-Cherenkov counter (S2’) and proton beam particles by a 2 mm thick scintillator (S2). Both detectors are situated in front of the target. For p, C and Si beams, interactions in the target are selected by anti-coincidence of the incoming beam particle with a small scintillation counter (S4) placed on the beam line between the two vertex magnets. For p+p interactions at 158 GeV this counter selects a (trigger) cross section of 28.5 mb out of 31.6 mb of the total inelastic cross section. For Pb-ion beams, an interaction trigger is provided by anti-coincidence with a Helium Gas-Cherenkov counter (S3) directly behind the target. The S3 counter is used to select minimum bias collisions by requiring a reduction of the Cherenkov signal by a factor of about 6. Since the Cherenkov signal is proportional to , this requirement ensures that the Pb projectile has interacted with a minimal constraint on the type of interaction. This setup limits the triggers on non-target interactions to rare beam-gas collisions, the fraction of which proved to be small after cuts, even in the case of peripheral Pb+Pb collisions.
The centrality of a collision is selected (on-line for central Pb+Pb, Si+Si and C+C and off-line for minimum bias Pb+Pb interactions) by a trigger using information from a downstream calorimeter (VCAL), which measures the energy of the projectile spectator nucleons.
4 Data Analysis
4.1 Data Sets
The data sets used in this analysis come from p+p, C+C, Si+Si and Pb+Pb collisions at 158A GeV. For Pb+Pb interactions data with both central () and minimum bias trigger () have been analyzed in order to study the centrality dependence of the BF. The minimum bias data were subdivided into six different centrality classes [12] according to the energy recorded by the VCAL, from class Veto 1 (the most central collisions) to class Veto 6 (the most peripheral collisions). The most central Pb+Pb interactions correspond to of the total geometric cross section (Table 1). Since minimum bias data provide only a small number of central collisions, we used in addition trigger selected central data. Finally, we analyzed three different data sets (Table 2) of Pb+Pb minimum bias events coming from two different data-taking periods ( - Data Set 1 and Data Set 2, - Data Set 3) with opposite magnetic field polarities (positive field polarity - Data Set 2 and Data Set 3, negative field polarity - Data Set 1) in order to estimate the systematic uncertainties (Table 2).
The event centrality is characterized by the mean impact parameter and the corresponding number of wounded nucleons . For each bin of centrality these quantities were determined by use of the Glauber model as implemented in the VENUS event generator [13]. In order to estimate the correlation between the energy deposited in the VCAL and or minimum bias VENUS events were processed through the GEANT detector simulation code, and the energy deposited in the VCAL was simulated. All these quantities are listed in Table 1.
4.2 Event and Track Selection
In order to reduce the contamination from non-target events and non-vertex tracks, selection criteria were imposed both at the event and the track level.
Events were selected that had a proper position of the reconstructed primary vertex. The vertex coordinate along the beam axis had to fulfill where the values of the central position and the range are shown in Table 2 for p+p, C+C, Si+Si and Pb+Pb reactions, respectively. In addition the vertex coordinates and perpendicular to the beam axis had to fulfill and , where the values and , can also been seen in Table 2 for all the data samples analyzed.
Selection criteria at the track level were imposed in order to reduce the contamination by tracks from weak decays, secondary interactions other sources of non vertex tracks. Thus, an accepted track had to have an extrapolated distance of closest approach and of the particle at the vertex plane within the range: cm and cm. In addition the potential number of points in the detector for the selected tracks had to be more than 30. To suppress double counting due to track splitting, the ratio of the number of reconstructed points to the potential number of points was required to be larger than .
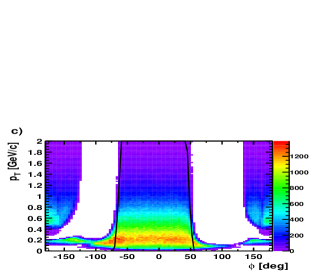
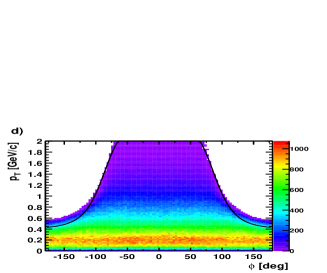
The NA49 detectors provide large acceptance in momentum space; however the acceptance in the azimuthal angle is not complete. The boundary of the acceptance region can be described with the formula [14]:
| (4) |
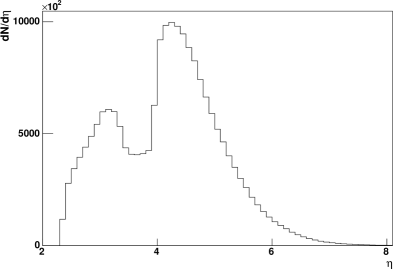
where the values of the parameters , , and depend on the rapidity interval and are given in Table 3 (see Fig. 2 for examples). The inclusive pseudo-rapidity distribution after applying the acceptance filter can be seen in Fig. 3.
Finally we required tracks to additionally satisfy the following criteria: GeV/c and . As shown in Fig. 3 the phase space analyzed covers most of the forward rapidity region, where the geometric acceptance is maximal.
4.3 Results
In this section, we will present results on the BF (Eq. 2) measured in p+p, C+C, Si+Si and Pb+Pb at GeV that were subjected to the event and track quality as well as to the phase space cuts described in the previous section.
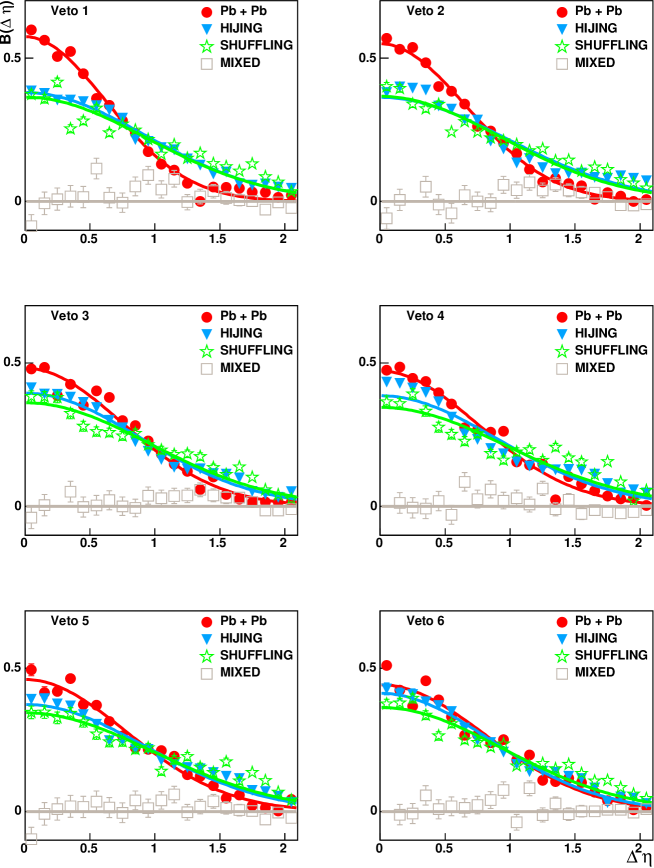
In order to study the centrality dependence of the BF, we analyzed Pb+Pb collisions that were divided into six centrality (Veto) classes [12], from 1 (the most central collisions) to 6 (the most peripheral ones) (Table 1).
The results are shown in Fig. 4 where the BF is plotted as a function of , the pseudo-rapidity difference of the charged particles. The error on each measured point is the statistical error. For visual comparisons the distributions were fitted with a Gaussian function having a fixed mean at zero (curves in Fig. 4). From inspection of Fig. 4 as well as from the values of the weighted average that are listed in Table 4, we notice that the width of the BF is narrower for the most central collisions (Veto 1) than for the peripheral ones (Veto 6). It should be mentioned, that for the calculation of the width (Eq. 3) we excluded the first point of each distribution, since from [15] it was shown that this point is significantly influenced by Coulomb interactions and Bose-Einstein correlations.
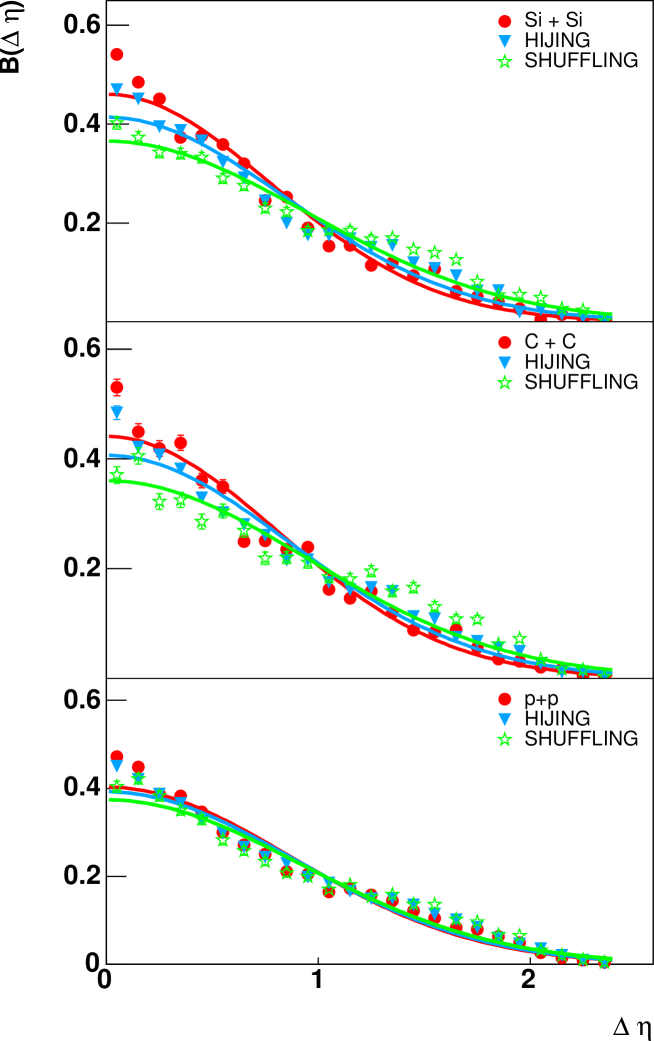
Furthermore, in order to extend the method to a system size study, we have analyzed C+C and Si+Si collisions at GeV. The BFs for the data samples of these two systems are shown in Fig. 5. The distributions are wider than those of the most central Pb+Pb collisions and tend to be similar to the ones coming from the most peripheral Pb+Pb interactions (Veto 6). This conclusion is confirmed by the corresponding values of displayed in Table 4.
In addition, we have studied p+p interactions at GeV. The resulting BF distribution shown in Fig. 5 is significantly wider than that for Pb+Pb interactions. The calculated widths for p+p, C+C, Si+Si and all centrality classes of Pb+Pb interactions are summarized in Table 4 along with their statistical errors.
4.4 Systematic errors
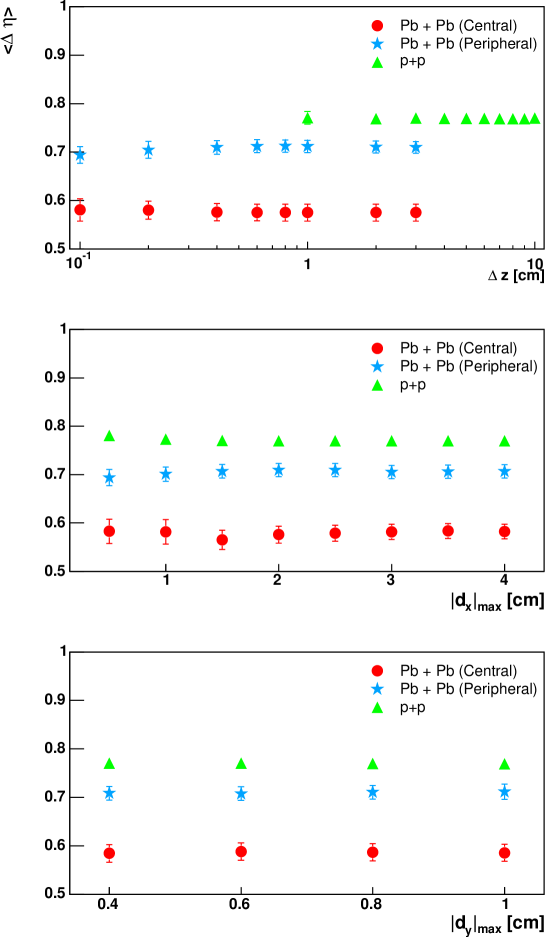
The systematic errors of the width of the BF were estimated by varying the cuts in , and and by comparing results obtained from different data taking periods. The results are described in this section.
The dependence of the width of the BF on the cut for the event vertex position and the upper limit cuts on the impact parameters and are shown in Fig. 6 for p+p and Pb+Pb (central and peripheral) collisions. The resulting variations of the width of the BF are used to estimate the systematic errors due to contamination of non-target interactions and non-vertex tracks. They amount to no more than , and for p+p, Pb+Pb peripheral and Pb+Pb central collisions, respectively.
Finally, as mentioned in a previous section, we analyzed three different data sets of minimum bias Pb+Pb collisions. The observed difference in the BF width are smaller than: , , and for Veto 6, Veto 5, Veto 4 and Veto 3 centrality selection respectively.
To summarize, the estimated systematic errors of the width of the BF for p+p, C+C, Si+Si, Pb+Pb peripheral and Pb+Pb central collisions are no more than : , , , and , respectively.
5 Discussion
In this section the results presented in the previous ones, will be compared to models and to results from RHIC obtained by the STAR collaboration [9].
The BF for each centrality class was calculated for mixed events that were produced by randomly choosing particles from different events with similar vertex position and multiplicity. As shown in Fig.4, the BF for mixed events goes to zero because of the removal of correlations caused by global charge conservation. Another method of mixing was applied to the data sample in order to estimate the maximum possible value of the width of the BF while retaining the constraint of charge conservation. This shuffling procedure [9] is a mixing method in which the value of the pseudo-rapidity of each track is taken randomly from the collection of pseudo-rapidity values of the tracks in the same event, whilst keeping the charge of each track the same. The BF for shuffled data is broader for each centrality class than the one obtained from the real data (Fig. 4). The values of for the shuffled data analysis are listed in Table 5.
Finally, in order to further investigate the origin of the system size and centrality dependence of the BF, we generated p+p, C+C and Si+Si collisions as well as centrality selected Pb+Pb interactions at GeV using the HIJING event generator [16]. The model is based on the excitation of strings and their subsequent hadronization according to the LUND model. The latter contains short range correlations of oppositely charged hadrons which are consistent with measurements from annihilations. The rescattering of produced hadrons is not included in the model.
The generated data sets were analyzed with and without applying the NA49 acceptance filter. The results revealed that the acceptance filter slightly increases the width by about . This suggest that this filter removes a fraction of balancing charges. The filtered distributions for Pb+Pb collisions and interactions of lighter systems are plotted in Fig. 4 and Fig. 5 respectively. The values of the widths are included in Table 5. The BF for HIJING is independent of centrality and system size and is wider than the one calculated from the real data for central, mid-central and mid-peripheral collisions. On the other hand both HIJING and real data distributions tend to be similar for the most peripheral Pb+Pb collisions (Veto 6) as well as for the lighter systems.
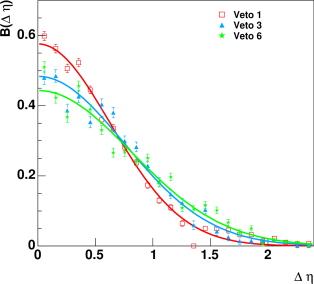
In order to demonstrate the dependence of the BF ’s width on the centrality class in Pb+Pb interactions, the BFs in different centrality bins were normalized to the same area and plotted on the same graph (Fig. 7). A significant narrowing of the BF width with increasing centrality is observed.
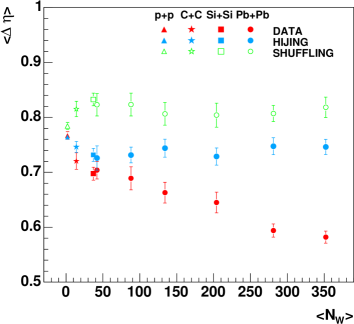
Fig. 8 shows the dependence of the width of the BF on the mean number of wounded nucleons (Table 1). The results for p+p, C+C and Si+Si collisions are also included. The width decreases monotonically with . On the other hand the width of the BF from both HIJING and shuffled data does not show any clear dependence on centrality.
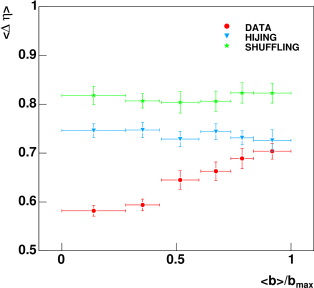
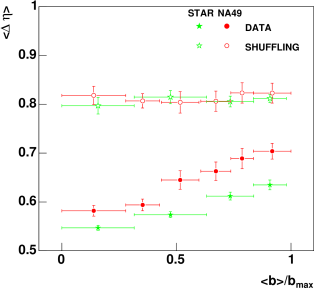
Fig. 9 shows the dependence of on the normalized mean impact parameter . The values of the impact parameter are listed in Table 1. Once again the strong decrease of the width with increasing centrality of the collision is obvious. The results from a similar analysis performed for Au+Au collisions at GeV by the STAR collaboration at RHIC [9] are plotted in Fig. 10. The width of the BF decreases from peripheral to central collisions by for the NA49 data, whereas for the higher energy STAR data the corresponding decrease is of the order of .
The narrowing of the BF compared to shuffled events is of similar magnitude in both experiments. The somewhat smaller difference between the widths for data and shuffled events for NA49 may be due to the incomplete azimuthal acceptance.
The influence of the decay of resonances on the width of the BF was estimated using the HIJING event generator. We found that the BF width increases by about when -meson decays are switched off. In the model the fraction of pions coming from decays (about ) is approximately independent of centrality. Therefore, the effect of decay can not explain the strong system size and centrality dependence of the width of the BF that we observe in our experimental data.
The measured narrowing of the BF is qualitatively consistent with the delayed hadronization scenario [6, 9] of an initially deconfined phase. Several model calculations have been published which provide a more quantitative description [17, 18, 19, 20]. In particular, within models based on statistical hadronization and hydrodynamic expansion the width of the BF was found to decrease with increasing transverse collective velocity of the matter at freeze-out [17, 18, 19] and thus with the collision centrality. However, a quantitative description of the STAR data was possible only when the condition of global charge conservation (a single fireball model) [18, 19] was substituted by a stronger condition of charge conservation in sub volumes (a multi-fireball model) [17]. The quark coalescence model was applied to the hadronization of the deconfined phase in [20]. When including radial flow, good agreement with the STAR measurements was obtained also in this model calculation.
6 Summary
In this paper the first measurements of the Balance Function in p+p, C+C and Si+Si interactions as well as centrality selected Pb+Pb collisions at GeV (the top SPS energy) are presented.
The width of the BF decreases monotonically with increasing system size (from minimum bias p+p to central Pb+Pb collisions) by and with increasing centrality of Pb+Pb collisions (from peripheral to central collisions) by . A similar decrease, of the order of , with centrality in Au+Au collisions was measured by STAR at GeV. Thus the narrowing of the BF seems to be nearly energy independent from the top SPS to RHIC energies.
Events from the string-hadronic HIJING model as well as shuffled events retaining only correlations from global charge conservation do not show any significant decrease of the BF width with increasing system size and centrality in nucleus-nucleus collisions. On the other hand, results from central Pb+Pb reactions at top SPS and Au+Au reactions at RHIC energies show a narrowing of the BF which suggests a delayed hadronization of the produced matter. For a more quantitative description of the data model calculations have to include the effect of transverse flow of the matter at freeze-out.
The energy dependence of the BF in the SPS range will be addressed in a future publication.
Acknowledgments
This work was supported by the University of Athens/Special account for research grants, the US Department of EnergyGrant DE-FG03-97ER41020/A000, the Bundesministerium fur Bildung und Forschung, Germany, the Polish State Committee for Scientific Research (2 P03B 130 23, SPB/CERN/P-03/Dz 446/2002-2004, 2 P03B 04123), the Hungarian Scientific Research Foundation (T032648, T032293, T043514), the Hungarian National Science Foundation, OTKA, (F034707), the Polish-German Foundation, and the Korea Research Foundation Grant (KRF-2003-070-C00015).
References
- [1] J. Collins, M. Perry, Phys. Rev. Lett. 34, 1353 (1975).
- [2] See for recent results: Proc. of Quark Matter 2004, J. Phys. G 30 (2004).
- [3] T. Alber et al. (NA35 Collaboration), Z. Phys. C64 (1994) 195. S. Afanasiev et al.(NA49 Collaboration), Phys. Rev. C66 (2002) 054902. R. Stock, Nucl. Phys. A661 (1999) 282c.
- [4] M. Gazdzicki, M. Gorenstein, Acta Phys. Polon. B30, 2705 (1999) M. Gazdzicki (NA49 Collaboration) Proc. of Quark Matter 2004, J. Phys. G 30 (2004), S701.
- [5] S. Jeon and V. Koch, Phys. Rev. Lett. 85 (2000) 2076. M. Asakawa, U. Heinz and B. Müller, Phys. Rev. Lett. 85 (2000) 2072. H. Heiselberg and A. D. Jackson, Phys. Rev. C63 (2001) 064904. E. V. Shuryak and M. A. Stephanov, Phys. Rev. C63 (2001) 064903. H. Appelshäuser et al. (NA49 Collaboration), Phys. Lett. B459 (1999) 679. S. V. Afanasiev et al. (NA49 Collaboration), Phys. Rev. Lett. 86 (2001) 1965. G. Georgopoulos, P. Christakoglou, A. Petridis and M. Vassiliou, Proc. of ”Correlations and Fluctuations 2002”. T. Anticic et al. (NA49 Collaboration), arXiv:hep-ex/0311009.
- [6] S. A. Bass, P. Danielewicz and S. Pratt, Phys. Rev. Lett. 85 (2000) 2689.
-
[7]
D. Drijard et al, Nucl. Phys. B155 (1979) 269
D. Drijard et al, Nucl. Phys. B166 (1980) 233
I.V. Ajinenko et al., Nucl. Phys. C43 (1989) 37. -
[8]
R. Brandelik et al., Phys. Lett. B100 (1981) 357
M. Althoff et al., Z. Phys. C17 (1983) 5
H. Aihara et al., Phys. Rev. Lett. 53 (1984) 2199
H. Aihara et al., Phys. Rev. Lett. 57 (1986) 3140
P.D. Acton et al., Phys. Lett. B305 (1993) 415. - [9] J. Adams et al., (STAR Collaboration) Phys. Rev. Lett. 90 (2003) 172301.
- [10] S. Afanasiev et al. (NA49 Collab.) Nucl. Instrum. Meth. A430, (1999) 210 .
- [11] L.S. Barnby et al. (NA49 Collab.), J.Phys. G25, (1999) 469 .
- [12] G. Cooper. Ph.D. thesis, Department of Physics, University of California, Berkeley (2000) LBNL-45467.
- [13] K. Werner, Phys. Rept. 232, 87, (1993).
- [14] J. Zaranek, Phys.Rev.C 66, 024905 (2002) J. Zaranek, Diploma Thesis (2003), University of Frankfurt.
- [15] S. Pratt and S. Cheng, Phys.Rev.C 68, 014907 (2003) .
- [16] Xin-Nian Wang, Miklos Gyulassy, Phys.Rev.D 3501-3516 (1991) 44.
- [17] S. Cheng et al., Phys.Rev.C 69, 054906 (2004).
- [18] P. Bozek, W. Broniowski, W. Florkowski, nucl-th/0310062.
- [19] W. Florkowski, P. Bozek, W. Broniowski, nucl-th/0402028.
- [20] A. Bialas, Phys. Lett. B B579 (2004) 31.
| Interaction | Number of events | range (GeV) | [fm] | |
|---|---|---|---|---|
| p+p | 1M | 2 | ||
| C+C | 100K | 14 | 1.9 | |
| Si+Si | 100K | 37 | 2.0 | |
| Pb+Pb(6) | 300K | 29340 - 40000 | 42 | 11.5 |
| Pb+Pb(5) | 110K | 26080 - 29340 | 88 | 9.6 |
| Pb+Pb(4) | 88K | 21190 - 26080 | 134 | 8.3 |
| Pb+Pb(3) | 75K | 14670 - 21190 | 204 | 6.5 |
| Pb+Pb(2) | 100K | 9250 - 14670 | 281 | 4.6 |
| Pb+Pb(1) | 100K | 0 - 9250 | 352 | 2.4 |
| Interaction | Year | Pol. | [cm] | [cm] | [cm] | [cm] | [cm] | [cm] |
|---|---|---|---|---|---|---|---|---|
| p+p | 2000 | + | 0.0 | 1.0 | 0.0 | 1.0 | -580.0 | 5.0 |
| C+C | 1998 | + | 0.0 | 1.0 | 0.0 | 1.0 | -579.1 | 2.0 |
| Si+Si | 1998 | + | 0.0 | 0.3 | 0.0 | 0.5 | -579.5 | 1.0 |
| Pb+Pb (m.b.) | 1996 | - | 0.0 | 0.1 | 0.0 | 0.1 | -578.9 | 0.4 |
| Pb+Pb (m.b.) | 1996 | + | -0.05 | 0.1 | 0.05 | 0.1 | -578.9 | 0.4 |
| Pb+Pb (m.b.) | 2000 | + | 0.0 | 0.1 | 0.0 | 0.1 | -581.2 | 0.4 |
| Pb+Pb (cen.) | 1996 | + | 0.0 | 0.1 | 0.0 | 0.1 | -578.9 | 0.4 |
| [c/GeV] | [GeV/c] | [deg] | ||
|---|---|---|---|---|
| -0.6 | 0 | 0 | 0 | 0 |
| -0.4 | 0 | -1 | 63 | -8 |
| -0.2 | 0 | 0 | 57 | -10 |
| 0.0 | 0 | 0.09 | 63 | -13 |
| 0.2 | 0 | 0.08 | 67 | -4 |
| 0.4 | -7 | 0.08 | 65 | -3 |
| 0.6 | 0 | 0.05 | 27 | 0 |
| 0.8 | 0 | 0 | 35 | 0 |
| 1.0 | 0 | 0.1 | 41 | 0 |
| 1.2 | 0.34 | 0.43 | 109 | 0 |
| 1.4 | 0.36 | 0.43 | 100 | 0 |
| 1.6 | 0.55 | 0.4 | 100 | 0 |
| 1.8 | 0.6 | 0.4 | 88 | 0 |
| 2.0 | 0.61 | 0.35 | 73 | 0 |
| 2.2 | 0.73 | 0.34 | 55 | 0 |
| 2.4 | 1.7 | 0.28 | 60 | 0 |
| 2.6 | 2.8 | 0.25 | 60 | 0 |
| 2.8 | 5 | 0.2 | 57 | 0 |
| 3.0 | 7 | 0.15 | 60 | 0 |
| 3.2 | 7 | 0.1 | 70 | 0 |
| Interaction | (Data set 1) | (Data set 2) | (Data set 3) |
|---|---|---|---|
| p+p | - | - | |
| C+C | - | - | |
| Si+Si | - | - | |
| Pb+Pb(Veto 6) | |||
| Pb+Pb(Veto 5) | |||
| Pb+Pb(Veto 4) | |||
| Pb+Pb(Veto 3) | |||
| Pb+Pb(Veto 2) | - | - | |
| Pb+Pb(Veto 1) | - | - |
| Interaction | (SHUFFLING) | (HIJING) |
|---|---|---|
| p+p | ||
| C+C | ||
| Si+Si | ||
| Pb+Pb(Veto 6) | ||
| Pb+Pb(Veto 5) | ||
| Pb+Pb(Veto 4) | ||
| Pb+Pb(Veto 3) | ||
| Pb+Pb(Veto 2) | ||
| Pb+Pb(Veto 1) |