, , , , , , , , , , , , , , , , , , , , , , , , , , , , , , , , , , , , , , , , , , , , , 111deceased, , , ,

Study of the Processes e+eηγbold-→superscript𝑒superscript𝑒𝜂𝛾e^{+}e^{-}\to\eta\gamma, π𝟎γ𝟑γbold-→superscript𝜋0𝛾3𝛾\pi^{0}\gamma\to 3\gamma in the c.m. Energy Range 600–1380 MeV at CMD-2

R.R. Akhmetshin V.M. Aulchenko V.Sh. Banzarov A. Baratt L.M. Barkov N.S. Bashtovoy A.E. Bondar D.V. Bondarev A.V. Bragin S.I. Eidelman D.A. Epifanov G.V. Fedotovitch N.I. Gabyshev D.A. Gorbachev A.A. Grebeniuk D.N. Grigoriev F.V. Ignatov S.V. Karpov V.F. Kazanin B.I. Khazin I.A. Koop P.P. Krokovny A.S. Kuzmin Yu.E. Lischenko I.B. Logashenko P.A. Lukin K.Yu. Mikhailov A.I. Milstein I.N. Nesterenko V.S. Okhapkin A.V. Otboev A.S. Popov S.I. Redin B.L. Roberts N.I. Root A.A. Ruban N.M. Ryskulov A.G. Shamov Yu.M. Shatunov B.A. Shwartz A.L. Sibidanov V.A. Sidorov A.N. Skrinsky I.G. Snopkov E.P. Solodov J.A. Thompson A.A. Valishev Yu.V. Yudin A.S. Zaitsev S.G. Zverev Budker Institute of Nuclear Physics, Novosibirsk, 630090, Russia Boston University, Boston, MA 02215, USA Novosibirsk State University, Novosibirsk, 630090, Russia University of Pittsburgh, Pittsburgh, PA 15260, USA Yale University, New Haven, CT 06511, USA
Abstract

The processes e+eηγsuperscript𝑒superscript𝑒𝜂𝛾e^{+}e^{-}\to\eta\gamma, π0γ3γsuperscript𝜋0𝛾3𝛾\pi^{0}\gamma\to 3\gamma have been studied in the c.m. energy range 600–1380 MeV with the CMD-2 detector. The following branching ratios have been determined:

(ρ0ηγ)superscript𝜌0𝜂𝛾\displaystyle{\mathcal{B}}(\rho^{0}\to\eta\gamma) =\displaystyle= (3.21±1.39±0.20)104,plus-or-minus3.211.390.20superscript104\displaystyle(3.21\pm 1.39\pm 0.20)\cdot 10^{-4},
(ωηγ)𝜔𝜂𝛾\displaystyle{\mathcal{B}}(\omega\to\eta\gamma) =\displaystyle= (4.441.83+2.59±0.28)104,plus-or-minussubscriptsuperscript4.442.591.830.28superscript104\displaystyle(4.44^{+2.59}_{-1.83}\pm 0.28)\cdot 10^{-4},
(ϕηγ)italic-ϕ𝜂𝛾\displaystyle{\mathcal{B}}(\phi\to\eta\gamma) =\displaystyle= (1.373±0.014±0.085)102,plus-or-minus1.3730.0140.085superscript102\displaystyle(1.373\pm 0.014\pm 0.085)\cdot 10^{-2},
(ρ0π0γ)superscript𝜌0superscript𝜋0𝛾\displaystyle{\mathcal{B}}(\rho^{0}\to\pi^{0}\gamma) =\displaystyle= (6.211.18+1.28±0.39)104,plus-or-minussubscriptsuperscript6.211.281.180.39superscript104\displaystyle(6.21^{+1.28}_{-1.18}\pm 0.39)\cdot 10^{-4},
(ωπ0γ)𝜔superscript𝜋0𝛾\displaystyle{\mathcal{B}}(\omega\to\pi^{0}\gamma) =\displaystyle= (9.06±0.20±0.57)102,plus-or-minus9.060.200.57superscript102\displaystyle(9.06\pm 0.20\pm 0.57)\cdot 10^{-2},
(ϕπ0γ)italic-ϕsuperscript𝜋0𝛾\displaystyle{\mathcal{B}}(\phi\to\pi^{0}\gamma) =\displaystyle= (1.258±0.037±0.077)103.plus-or-minus1.2580.0370.077superscript103\displaystyle(1.258\pm 0.037\pm 0.077)\cdot 10^{-3}.

1 Introduction

The magnetic dipole transitions of the light vector mesons (ρ𝜌\rho, ω𝜔\omega and ϕitalic-ϕ\phi) to the π0γsuperscript𝜋0𝛾\pi^{0}\gamma and ηγ𝜂𝛾\eta\gamma final states have traditionally provided a convenient laboratory for various tests of theoretical concepts, particularly the nonrelativistic quark model and Vector Dominance Model (VDM) [1, 2]. There are ongoing discussions about mechanisms of SU(3) breaking, possible admixture of glue in mesons and the role of anomalies in radiative decays [3, 4, 5, 6, 7, 8]. Precise measurements of the cross sections of e+esuperscript𝑒superscript𝑒e^{+}e^{-} annihilation into the π0γsuperscript𝜋0𝛾\pi^{0}\gamma and ηγ𝜂𝛾\eta\gamma final states in the broad c.m.energy range are necessary for the problem of the muon anomaly [9]. Radiative decays to π0γsuperscript𝜋0𝛾\pi^{0}\gamma and ηγ𝜂𝛾\eta\gamma can also provide important information on the properties of the ρ𝜌\rho, ω𝜔\omega and ϕitalic-ϕ\phi excitations as well as on the existence of light hybrids between 1000 and 2000 MeV [10, 11].

Despite previous experimental efforts (cf. the detailed bibliography in [12]), of these decays only ωπ0γ𝜔superscript𝜋0𝛾\omega\to\pi^{0}\gamma and ϕηγitalic-ϕ𝜂𝛾\phi\to\eta\gamma are rather well studied. A three-photon final state is convenient for the investigation of the π0γsuperscript𝜋0𝛾\pi^{0}\gamma and ηγ𝜂𝛾\eta\gamma final states since both π0superscript𝜋0\pi^{0} and η𝜂\eta readily decay into two photons. Measurements of the branching ratios for corresponding decays of the ρ𝜌\rho, ω𝜔\omega and ϕitalic-ϕ\phi using the two-photon decay mode have been performed at ND [13, 14] and SND [15, 16], however, none of them covered the whole off-resonance energy range.

In this work we report on the measurement of the cross section of the processes e+eπ0γsuperscript𝑒superscript𝑒superscript𝜋0𝛾e^{+}e^{-}\to\pi^{0}\gamma and e+eηγsuperscript𝑒superscript𝑒𝜂𝛾e^{+}e^{-}\to\eta\gamma in the three-photon final state in the c.m.energy range 600–1380 MeV using the data from the CMD-2 detector at the VEPP-2M e+esuperscript𝑒superscript𝑒e^{+}e^{-} collider.

2 Experiment

The general purpose detector CMD-2 has been described in detail elsewhere [17]. Its tracking system consists of a cylindrical drift chamber (DC) and double-layer multiwire proportional Z-chamber, both also used for the trigger, and both inside a thin (0.38 X0) superconducting solenoid with a field of 1 T. The barrel CsI calorimeter (BC) with a thickness of 8.1 X0 placed outside the solenoid has energy resolution for photons of about 9% in the energy range from 100 to 700 MeV. The angular resolution is of the order of 0.02 radians. The end-cap BGO calorimeter with a thickness of 13.4 X0 placed inside the solenoid has energy and angular resolution varying from 9% to 4% and from 0.03 to 0.02 radians, respectively, for the photon energy in the range 100 to 700 MeV. The barrel and end-cap calorimeter systems cover a solid angle of 0.92×4π0.924𝜋0.92\times 4\pi radians.

This analysis is based on a data sample corresponding to integrated luminosity of 21 pb-1 collected in 1997–1998 in the energy range 600–1380 MeV. The step of the c.m. energy scan varied from 0.5 MeV near the ω𝜔\omega and ϕitalic-ϕ\phi peaks to 10 MeV far from the resonances. The beam energy spread is about 4×1044superscript1044\times 10^{-4} of the total energy. The luminosity is measured using events of Bhabha scattering at large angles [18].

A GEANT3 based Monte Carlo simulation (MC) package is used to model the detector response and determine the efficiency [19]. Because of the beam induced background additional (“fake”) clusters can appear in the calorimeter. To take this effect into account in MC we determine a corresponding probability as well as photon energy and angular spectra directly from the data using the process e+eπ+ππ0e^{+}e^{-}\to\to\pi^{+}\pi^{-}\pi^{0}, and then include generation of such photons in the detector response during simulation.

3 Data analysis

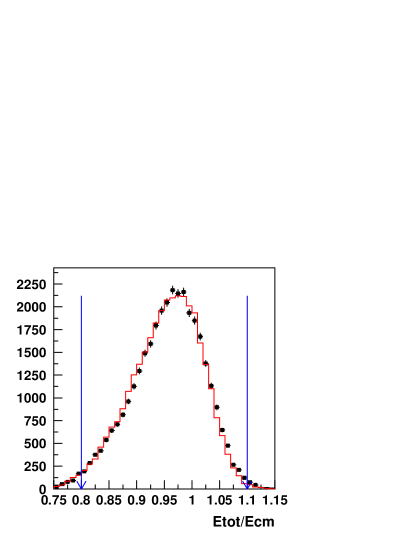
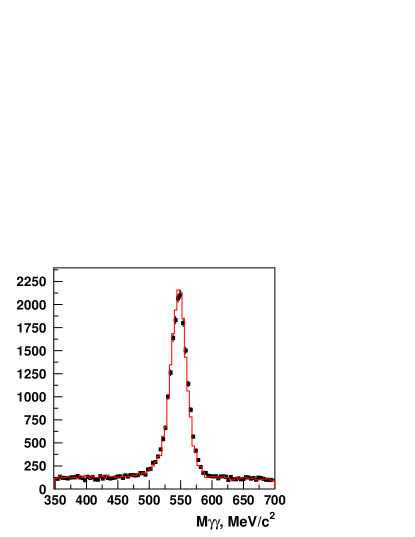
At the initial stage, events are selected which have no tracks in the DC, three or four photons in the CsI calorimeter, the total energy deposition 0.8<Etot/Ecm<1.10.8subscript𝐸totsubscript𝐸cm1.10.8<E_{\rm tot}/E_{\rm cm}<1.1, the total momentum Ptot/Ecm<0.15subscript𝑃totsubscript𝐸cm0.15P_{\rm tot}/E_{\rm cm}<0.15 and the minimum photon energy of 50 MeV. Figure 1 (left) shows the Etotsubscript𝐸totE_{\rm tot} distribution for the data and signal MC near the ϕitalic-ϕ\phi resonance. One can see good agreement between the data and signal MC. About 52×10352superscript10352\times 10^{3} events were selected in the whole energy range after these requirements.

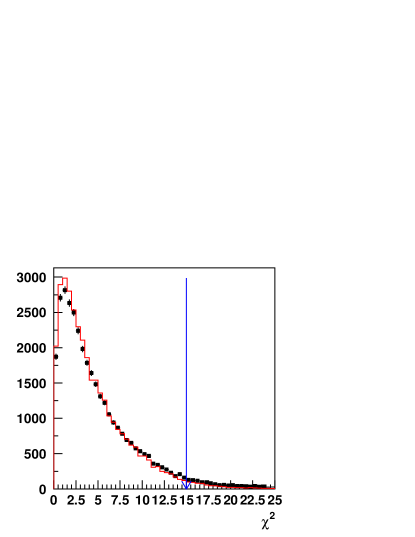
Then a kinematic fit requiring energy-momentum conservation (a standard 4C fit) was performed. We require χ2<15superscript𝜒215\chi^{2}<15 that provides a good signal/noise ratio while the number of rejected signal events is still small (see Fig. 1).

The reconstruction procedure assumes three photons, i.e., for events with four photons a combination of three photons with the minimum χ2superscript𝜒2\chi^{2} is chosen. After this stage about 48×10348superscript10348\times 10^{3} events remain.

Refer to caption
Refer to caption
Figure 1: The Etot/Ecmsubscript𝐸totsubscript𝐸cmE_{\rm tot}/E_{\rm cm} (left) and χ2superscript𝜒2\chi^{2} (right) distributions. The points with error bars represent experimental events, the histograms show the MC simulation. The arrows indicate the cuts imposed.

The dominant background comes from the QED three-photon annihilation: e+e3γsuperscript𝑒superscript𝑒3𝛾e^{+}e^{-}\to 3\gamma. These events can not be completely rejected by selection criteria. The ηγ𝜂𝛾\eta\gamma, π0γsuperscript𝜋0𝛾\pi^{0}\gamma and background events can be separated using decay dynamics. To this end two methods were considered: Dalitz plot analysis and a fit of the two-photon invariant mass distributions.
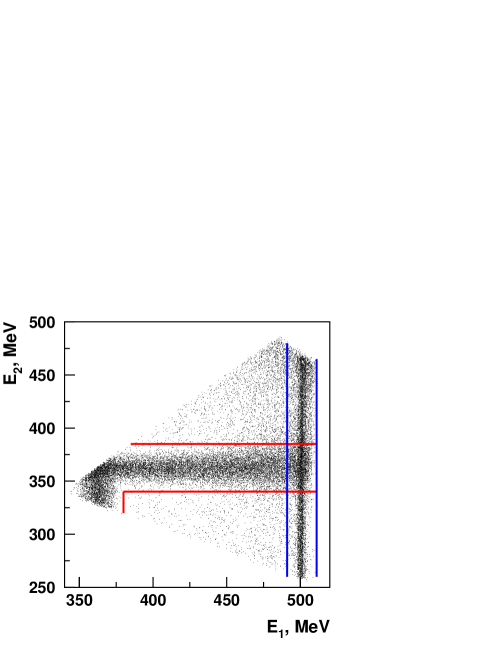
Figure 2 shows the Dalitz plot for the 3γ3𝛾3\gamma final state in the ϕitalic-ϕ\phi meson energy range (1011.41011.41011.4 MeV <ECM<1027.4absentsubscript𝐸CM1027.4<E_{\rm CM}<1027.4 MeV). Here the photons are sorted by their energy so that the first photon has a maximum energy: E1>E2>E3subscript𝐸1subscript𝐸2subscript𝐸3E_{1}>E_{2}>E_{3}. The Dalitz plot is divided into three regions: Dηγsubscript𝐷𝜂𝛾D_{\eta\gamma} (340MeV<E2<385MeVor340MeVsubscript𝐸2385MeVor340~{}{\rm MeV}<E_{2}<385~{}{\rm MeV}~{}{\rm or} E1<385MeVsubscript𝐸1385MeVE_{1}<385~{}{\rm MeV}), Dπ0γsubscript𝐷superscript𝜋0𝛾D_{\pi^{0}\gamma} (491MeV<E1<511MeV491MeVsubscript𝐸1511MeV491~{}{\rm MeV}<E_{1}<511~{}{\rm MeV}) and Dbgsubscript𝐷bgD_{\rm bg} (all the remaining events). For each of the three final states (ηγ𝜂𝛾\eta\gamma, π0γsuperscript𝜋0𝛾\pi^{0}\gamma and QED) we determine from the MC simulation the probabilities to enter each region. Based on that, from the population of various regions of the Dalitz plot in the data the total number of events due to each process is calculated. However, this method can provide bias in the signal yield determination because of the possible deviation between the signal shape in the data and MC simulation. Additional bias can arise from the background processes of the non-QED origin.
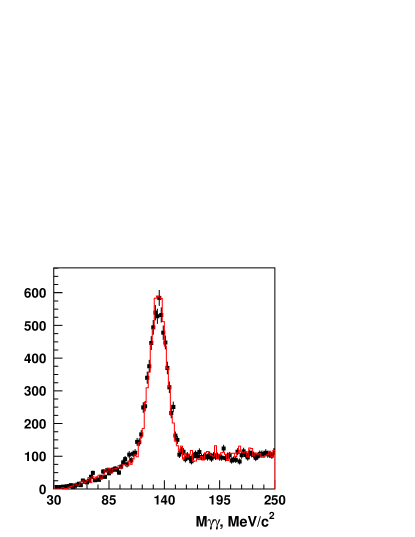
Refer to caption
Figure 2: The Dalitz plot for the 3γ3𝛾3\gamma final state at the ϕitalic-ϕ\phi meson energy. The points represent experimental events, the lines indicate boundaries used in the selection criteria, see the text for more detail.

Therefore, we obtain the number of ηγ𝜂𝛾\eta\gamma and π0γsuperscript𝜋0𝛾\pi^{0}\gamma events by fitting the two-photon invariant mass distribution. In this method the signal shape is obtained from the data decreasing a possible bias. The difference in the number of selected events in these two methods (about 3%) was considered as a systematic uncertainty because of the separation procedure.

For π0superscript𝜋0\pi^{0} reconstruction the invariant mass of the two softer photons (M23subscript𝑀23M_{23}) is used. For the η𝜂\eta signal three combinations are used:

  1. 1.

    In case of E1<mη2/ssubscript𝐸1superscriptsubscript𝑚𝜂2𝑠E_{1}<m_{\eta}^{2}/\sqrt{s}, two hard photons are used (M12subscript𝑀12M_{12}).

  2. 2.

    Otherwise, if E3<mη2/ssubscript𝐸3superscriptsubscript𝑚𝜂2𝑠E_{3}<m_{\eta}^{2}/\sqrt{s}, we use the first and third photons (M13subscript𝑀13M_{13}) .

  3. 3.

    In other cases two soft photons (M23subscript𝑀23M_{23}) are used.

Figure 3 shows the two-photon invariant mass distributions for the π0superscript𝜋0\pi^{0} (left) and η𝜂\eta (right) combinations near the peak of the ϕitalic-ϕ\phi meson.

Other possible sources of background are the processes e+eηγ3π0γsuperscript𝑒superscript𝑒𝜂𝛾3superscript𝜋0𝛾e^{+}e^{-}\to\eta\gamma\to 3\pi^{0}\gamma, e+eKSKLsuperscript𝑒superscript𝑒subscript𝐾Ssubscript𝐾Le^{+}e^{-}\to K_{\rm S}K_{\rm L}, e+eγγsuperscript𝑒superscript𝑒𝛾𝛾e^{+}e^{-}\to\gamma\gamma and e+eωπ0π0π0γsuperscript𝑒superscript𝑒𝜔superscript𝜋0superscript𝜋0superscript𝜋0𝛾e^{+}e^{-}\to\omega\pi^{0}\to\pi^{0}\pi^{0}\gamma. The expected number of events from these processes was calculated from the detection efficiencies determined by the MC simulation and their cross sections independently measured at CMD-2 [20, 21, 22, 23, 24]. The fraction of background events is negligible below the ϕitalic-ϕ\phi meson and is about 2% only in the ϕitalic-ϕ\phi meson energy range. Above the ϕitalic-ϕ\phi meson the expected cross section of the signal is very low (0.01–0.1 nb) and that of the background remaining after all selection criteria has close or even higher value. The separation procedure gives 17400 ηγ𝜂𝛾\eta\gamma events, 18680 π0γsuperscript𝜋0𝛾\pi^{0}\gamma events and about 12000 QED events in the whole energy range considered.

Refer to caption
Refer to caption
Figure 3: The two-photon invariant mass distributions in the π0superscript𝜋0\pi^{0} (left) and η𝜂\eta (right) mass range. The points with error bars represent experimental events, histograms show the MC simulation.

3.1 Approximation of the cross sections

At each energy point i𝑖i the cross section of the process σisubscript𝜎i\sigma_{\rm i} of a given process is calculated using the following formula:

σi=NiLiεi(1+δi),subscript𝜎isubscript𝑁isubscript𝐿isubscript𝜀i1subscript𝛿i\sigma_{\rm i}=\frac{N_{\rm i}}{L_{\rm i}\varepsilon_{\rm i}(1+\delta_{\rm i})}\,, (1)

where Nisubscript𝑁iN_{\rm i} is the number of selected events, Lisubscript𝐿iL_{\rm i} is the integrated luminosity, εisubscript𝜀i\varepsilon_{\rm i} is the detection efficiency and (1+δi)1subscript𝛿i(1+\delta_{\rm i}) is the radiative correction at the i-th energy point.

The detection efficiency was calculated from the Monte Carlo simulation taking into account corrections obtained from the data and the neutral trigger efficiency. The neutral trigger (NT) is part of the CMD-2 trigger system responsible for events with a final state of photons only, without any charged tracks. The NT efficiency was estimated using events of the process e+ee+eγsuperscript𝑒superscript𝑒superscript𝑒superscript𝑒𝛾e^{+}e^{-}\to e^{+}e^{-}\gamma at each energy point. Its value varied from about 80% to 90%.

The radiative corrections are calculated according to [25]. The dependence of the detection efficiency on the energy of the emitted photon is determined from simulation.

Table 1: The c.m. energy, integrated luminosity, number of selected events, detection efficiency, radiative correction, and Born cross section σ𝜎\sigma of the process e+eηγsuperscript𝑒superscript𝑒𝜂𝛾e^{+}e^{-}\to\eta\gamma.
s𝑠\sqrt{s}, MeV L𝐿L, nb-1 Nexpsubscript𝑁expN_{\rm exp} ε𝜀\varepsilon, % 1+δ1𝛿1+\delta σ𝜎\sigma, nb
599.86 35.2 0.1±2.3plus-or-minus0.12.30.1\pm 2.3 2.3 -0.157 <4.71absent4.71<4.71
629.86 44.6 0.7±2.8plus-or-minus0.72.80.7\pm 2.8 7.2 -0.142 <1.68absent1.68<1.68
659.86 39.8 3.0±2.9plus-or-minus3.02.93.0\pm 2.9 11.6 -0.134 0.75±0.63plus-or-minus0.750.630.75\pm 0.63
719.86 56.9 0.0±2.5plus-or-minus0.02.50.0\pm 2.5 15.0 -0.126 <0.48absent0.48<0.48
749.86 42.9 0.1±1.9plus-or-minus0.11.90.1\pm 1.9 16.0 -0.117 <0.44absent0.44<0.44
759.86 33.7 3.4±2.7plus-or-minus3.42.73.4\pm 2.7 15.7 -0.115 0.73±0.51plus-or-minus0.730.510.73\pm 0.51
763.86 39.7 5.6±3.9plus-or-minus5.63.95.6\pm 3.9 16.0 -0.116 1.00±0.61plus-or-minus1.000.611.00\pm 0.61
769.86 34.3 0.2±2.1plus-or-minus0.22.10.2\pm 2.1 17.0 -0.126 <0.63absent0.63<0.63
773.86 70.1 1.0±2.8plus-or-minus1.02.81.0\pm 2.8 15.8 -0.147 0.11±0.26plus-or-minus0.110.260.11\pm 0.26
777.86 83.6 2.4±3.5plus-or-minus2.43.52.4\pm 3.5 15.8 -0.186 0.22±0.27plus-or-minus0.220.270.22\pm 0.27
779.86 56.6 10.0±3.9plus-or-minus10.03.910.0\pm 3.9 14.7 -0.204 1.50±0.46plus-or-minus1.500.461.50\pm 0.46
780.86 58.5 2.3±5.9plus-or-minus2.35.92.3\pm 5.9 8.8 -0.207 0.57±1.14plus-or-minus0.571.140.57\pm 1.14
781.86 366.8 41.2±9.3plus-or-minus41.29.341.2\pm 9.3 14.7 -0.203 0.94±0.18plus-or-minus0.940.180.94\pm 0.18
782.86 77.6 9.8±4.4plus-or-minus9.84.49.8\pm 4.4 15.3 -0.191 1.03±0.37plus-or-minus1.030.371.03\pm 0.37
783.86 71.7 2.1±3.3plus-or-minus2.13.32.1\pm 3.3 15.7 -0.172 0.22±0.29plus-or-minus0.220.290.22\pm 0.29
785.86 67.0 8.2±3.9plus-or-minus8.23.98.2\pm 3.9 16.0 -0.123 0.87±0.36plus-or-minus0.870.360.87\pm 0.36
789.86 28.4 1.5±2.1plus-or-minus1.52.11.5\pm 2.1 15.2 -0.046 0.36±0.48plus-or-minus0.360.480.36\pm 0.48
793.86 46.2 1.7±2.2plus-or-minus1.72.21.7\pm 2.2 15.9 -0.010 0.23±0.31plus-or-minus0.230.310.23\pm 0.31
799.86 56.5 0.9±2.0plus-or-minus0.92.00.9\pm 2.0 15.5 0.005 0.10±0.23plus-or-minus0.100.230.10\pm 0.23
809.86 59.9 3.9±2.7plus-or-minus3.92.73.9\pm 2.7 15.9 0.006 0.41±0.29plus-or-minus0.410.290.41\pm 0.29
819.86 109.4 8.0±4.1plus-or-minus8.04.18.0\pm 4.1 15.8 0.004 0.47±0.24plus-or-minus0.470.240.47\pm 0.24
839.86 130.4 8.6±4.5plus-or-minus8.64.58.6\pm 4.5 15.4 -0.006 0.43±0.23plus-or-minus0.430.230.43\pm 0.23
879.86 167.9 2.1±3.9plus-or-minus2.13.92.1\pm 3.9 15.2 -0.037 0.08±0.15plus-or-minus0.080.150.08\pm 0.15
919.86 285.4 5.7±5.4plus-or-minus5.75.45.7\pm 5.4 15.0 -0.063 0.14±0.13plus-or-minus0.140.130.14\pm 0.13
939.86 136.7 1.1±3.8plus-or-minus1.13.81.1\pm 3.8 15.5 -0.077 0.06±0.18plus-or-minus0.060.180.06\pm 0.18
949.86 226.1 12.5±5.5plus-or-minus12.55.512.5\pm 5.5 16.2 -0.085 0.38±0.15plus-or-minus0.380.150.38\pm 0.15
957.86 250.1 6.2±4.7plus-or-minus6.24.76.2\pm 4.7 16.5 -0.093 0.17±0.12plus-or-minus0.170.120.17\pm 0.12
969.86 249.7 4.7±5.1plus-or-minus4.75.14.7\pm 5.1 17.2 -0.108 0.12±0.12plus-or-minus0.120.120.12\pm 0.12
983.93 307.7 5.2±7.0plus-or-minus5.27.05.2\pm 7.0 20.4 -0.132 0.07±0.13plus-or-minus0.070.130.07\pm 0.13
Table 2: The c.m. energy, integrated luminosity, number of selected events, detection efficiency, radiative correction, and Born cross section σ𝜎\sigma of the process e+eηγsuperscript𝑒superscript𝑒𝜂𝛾e^{+}e^{-}\to\eta\gamma.
Table 3: The c.m. energy, integrated luminosity, number of selected events, detection efficiency, radiative correction, and Born cross section σ𝜎\sigma of the process e+eπ0γsuperscript𝑒superscript𝑒superscript𝜋0𝛾e^{+}e^{-}\to\pi^{0}\gamma.
Table 4: The c.m. energy, integrated luminosity, number of selected events, detection efficiency, radiative correction, and Born cross section σ𝜎\sigma of the process e+eπ0γsuperscript𝑒superscript𝑒superscript𝜋0𝛾e^{+}e^{-}\to\pi^{0}\gamma.
Refer to caption
Refer to caption
Refer to caption
Figure 4: The cross section of the process e+eηγsuperscript𝑒superscript𝑒𝜂𝛾e^{+}e^{-}\to\eta\gamma. The points with error bars represent the experimental data, the curve corresponds to the result of the fit.
Refer to caption
Refer to caption
Refer to caption
Figure 5: The cross section of the process e+eπ0γsuperscript𝑒superscript𝑒superscript𝜋0𝛾e^{+}e^{-}\to\pi^{0}\gamma. The points with error bars represent the experimental data, the curve corresponds to the result of the fit.

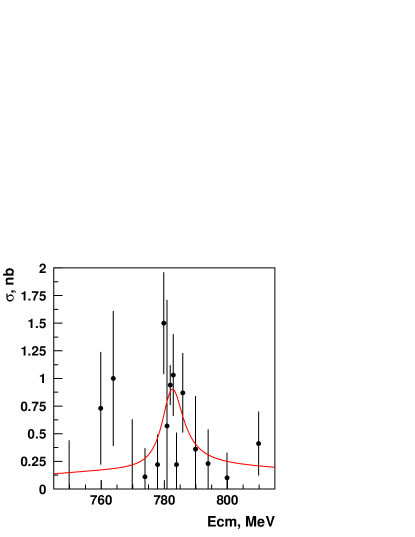
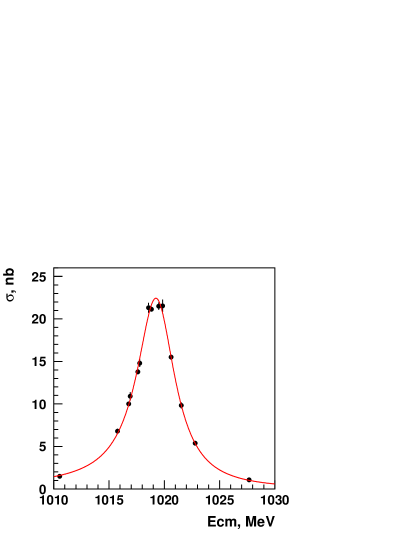
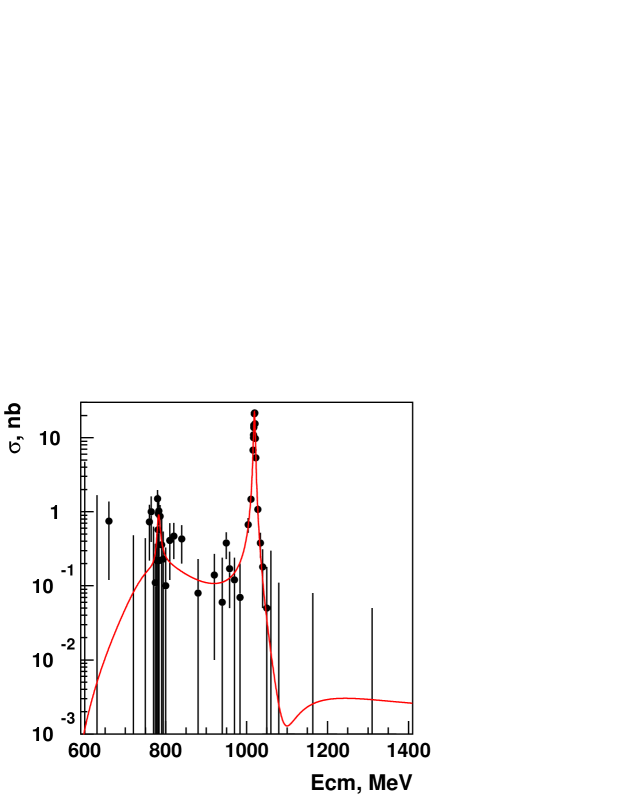
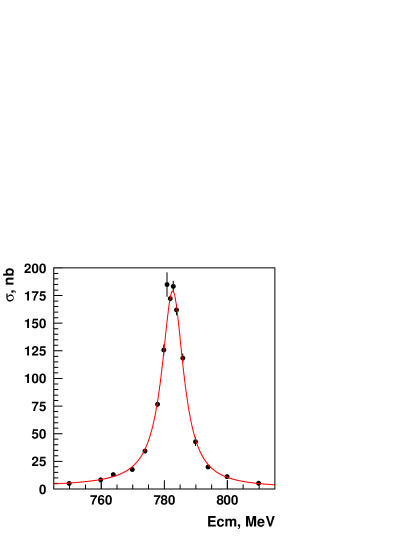
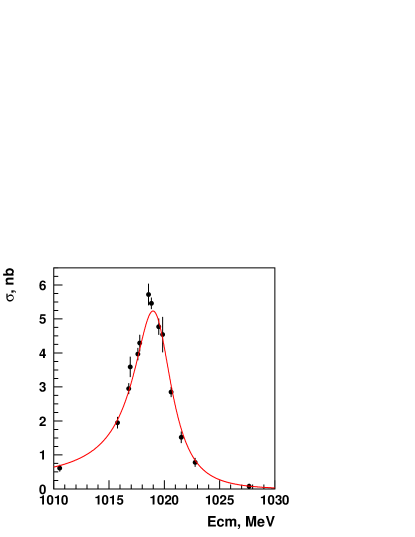
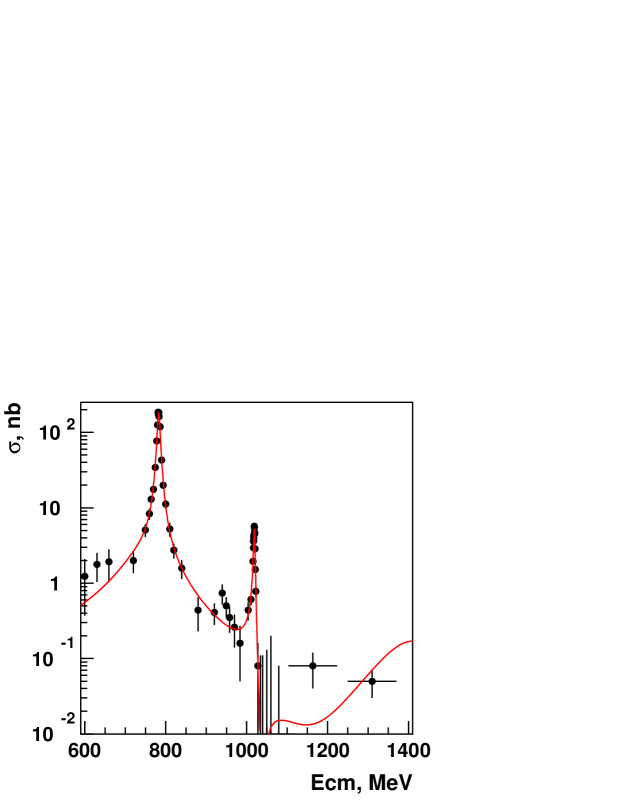
The obtained cross sections of the processes e+eηγsuperscript𝑒superscript𝑒𝜂𝛾e^{+}e^{-}\to\eta\gamma, π0γsuperscript𝜋0𝛾\pi^{0}\gamma are shown in Figs. 45. The observed pattern of the energy dependence is due to the interference of the ρ𝜌\rho, ω𝜔\omega and ϕitalic-ϕ\phi mesons. The detailed information on this analysis is listed in Tables 3.1-3.1. The cross section shown there is a so called “dressed” one, which is used in the approximation of the energy dependence with resonances. For applications to various dispersion integrals like that for the leading order hadronic contribution to the muon anomalous magnetic moment, the “bare” cross section should be used [26].

The maximum likelihood method is applied to fit the energy dependence of the experimental cross sections obtained from the relation (1).

The Born cross section of these processes can be written as:

σPγ(s)=FPγ(s)s3/2|VAV|2,subscript𝜎P𝛾𝑠subscript𝐹P𝛾𝑠superscript𝑠32superscriptsubscriptVsubscript𝐴V2\displaystyle\sigma_{{\rm P}\gamma}(s)=\frac{F_{{\rm P}\gamma}(s)}{s^{3/2}}\cdot\biggl{|}\sum_{\rm V}A_{\rm V}\biggr{|}^{2}\;, (2)
AV=σV(0)mV3F(mV2)mVΓVeiφVmV2sisΓV(s),subscript𝐴Vsubscriptsuperscript𝜎0Vsuperscriptsubscript𝑚V3𝐹superscriptsubscript𝑚V2subscript𝑚VsubscriptΓVsuperscript𝑒𝑖subscript𝜑Vsubscriptsuperscript𝑚2V𝑠𝑖𝑠subscriptΓV𝑠\displaystyle A_{\rm V}=\sqrt{\sigma^{(0)}_{\rm V}\frac{m_{\rm V}^{3}}{F(m_{\rm V}^{2})}}\cdot\frac{m_{\rm V}\Gamma_{\rm V}e^{i\varphi_{\rm V}}}{m^{2}_{\rm V}-s-i\sqrt{s}\Gamma_{\rm V}(s)}\,,

where mVsubscript𝑚Vm_{\rm V} is the mass of the resonance, ΓV(s)subscriptΓV𝑠\Gamma_{\rm V}(s) and ΓV=ΓV(mV2)subscriptΓVsubscriptΓVsuperscriptsubscript𝑚V2\Gamma_{\rm V}=\Gamma_{\rm V}(m_{\rm V}^{2}) are its width at the squared c.m.energy s𝑠s and at the resonance peak (s=mV2𝑠superscriptsubscript𝑚V2s=m_{\rm V}^{2}), respectively, δVsubscript𝛿V\delta_{\rm V} is its relative phase, F(s)𝐹𝑠F(s) is a factor taking into account the energy dependence of the phase space of the final state, FPγ(s)=pγ3=(s(1mP2/2s))3subscript𝐹P𝛾𝑠superscriptsubscript𝑝𝛾3superscript𝑠1superscriptsubscript𝑚P22𝑠3F_{{\rm P}\gamma}(s)=p_{\gamma}^{3}=(\sqrt{s}(1-m_{\rm P}^{2}/2s))^{3}, σV(0)superscriptsubscript𝜎V0\sigma_{\rm V}^{(0)} is the cross section at the resonance peak:

σV(0)=σe+eVηγ(mV2)=12πBVe+eBVηγmV2,superscriptsubscript𝜎V0subscript𝜎superscript𝑒superscript𝑒𝑉𝜂𝛾superscriptsubscript𝑚V212𝜋subscript𝐵Vsuperscriptesuperscriptesubscript𝐵V𝜂𝛾subscriptsuperscript𝑚2V\sigma_{\rm V}^{(0)}=\sigma_{e^{+}e^{-}\to V\to\eta\gamma}(m_{\rm V}^{2})=\frac{12\pi B_{\rm V\to\rm{e^{+}e^{-}}}B_{\rm V\to\eta\gamma}}{m^{2}_{\rm V}}\;, (3)

where BVe+esubscript𝐵VsuperscriptesuperscripteB_{\rm V\to\rm{e^{+}e^{-}}} and BVηγsubscript𝐵V𝜂𝛾B_{\rm V\to\eta\gamma} are the corresponding branching ratios. In Eq. (2) we sum over all vector mesons relevant at this energy, V=ρ,ω,ϕ,ρ,ω𝑉𝜌𝜔italic-ϕsuperscript𝜌superscript𝜔V=\rho,\omega,\phi,\rho^{\prime},\omega^{\prime}.

The Gounaris-Sakurai model has been used for the description of the ρ𝜌\rho meson [27]. To describe the energy dependence of the ω𝜔\omega and ϕitalic-ϕ\phi meson widths, their main decay modes π+ππ0superscript𝜋superscript𝜋superscript𝜋0\pi^{+}\pi^{-}\pi^{0}, π0γsuperscript𝜋0𝛾\pi^{0}\gamma as well as KL0KS0subscriptsuperscript𝐾0Lsubscriptsuperscript𝐾0SK^{0}_{\rm L}K^{0}_{\rm S}, K+Ksuperscript𝐾superscript𝐾K^{+}K^{-}, π+ππ0superscript𝜋superscript𝜋superscript𝜋0\pi^{+}\pi^{-}\pi^{0} and ηγ𝜂𝛾\eta\gamma, respectively, were taken into account using the same parameterization as in [28]. For the ρ(1450)superscript𝜌1450\rho^{\prime}(1450) the energy dependence of the width assumed 60% and 40% branching ratios for its decays into a1(1260)πsubscript𝑎11260𝜋a_{1}(1260)\pi and ωπ𝜔𝜋\omega\pi, respectively [29]. Its mass and width were taken to be 146514651465 MeV and 400400400 MeV, respectively [12]. The energy dependence of the ω(1420)superscript𝜔1420\omega^{\prime}(1420) width is calculated assuming the ωρπ\omega\prime\to\rho\pi decay. Its mass and width were fixed at the world average values of 1425 MeV and 215 MeV, respectively [12].

3.2 Results of the fits

For the fit to the e+eηγsuperscript𝑒superscript𝑒𝜂𝛾e^{+}e^{-}\to\eta\gamma cross section the resonance cross sections at the peak σρ(0)subscriptsuperscript𝜎0𝜌\sigma^{(0)}_{\rho}, σω(0)subscriptsuperscript𝜎0𝜔\sigma^{(0)}_{\omega}, σϕ(0)subscriptsuperscript𝜎0italic-ϕ\sigma^{(0)}_{\phi} as well as the ϕitalic-ϕ\phi meson mass mϕsubscript𝑚italic-ϕm_{\phi} are free parameters. The ρ𝜌\rho and ω𝜔\omega meson phases are chosen to be φρ=φω=0subscript𝜑𝜌subscript𝜑𝜔superscript0\varphi_{\rho}=\varphi_{\omega}=0^{\circ} while that for the ϕitalic-ϕ\phi meson is φϕ=180subscript𝜑italic-ϕsuperscript180\varphi_{\phi}=180^{\circ} in agreement with the quark model. The values of the other parameters are taken from Ref. [12]. We also consider a model in which in addition to the parameters described above there is a contribution tentatively referred to as that of the ρ(1450)superscript𝜌1450\rho^{\prime}(1450) meson. A fit in the model with the ρ(1450)superscript𝜌1450\rho^{\prime}(1450) doesn’t improve χ2superscript𝜒2\chi^{2} and results in the value of σρ(0)\sigma_{\rho\prime}^{(0)} consistent with zero, σρ(0)=0.0010.001+0.072\sigma_{\rho\prime}^{(0)}=0.001^{+0.072}_{-0.001} nb and compatible with our result in the 3π03superscript𝜋03\pi^{0} mode [20] σρ(0)=0.066±0.015\sigma^{(0)}_{\rho\prime}=0.066\pm 0.015 nb. Therefore, for our final results for the ηγ𝜂𝛾\eta\gamma decay we choose a model where σρ0=0\sigma_{\rho\prime}^{0}=0 nb, see Table 5.

Table 5: Results of the fits for the processes e+eηγsuperscript𝑒superscript𝑒𝜂𝛾e^{+}e^{-}\to\eta\gamma and e+eπ0γsuperscript𝑒superscript𝑒superscript𝜋0𝛾e^{+}e^{-}\to\pi^{0}\gamma
Parameter ηγ𝜂𝛾\eta\gamma π0γsuperscript𝜋0𝛾\pi^{0}\gamma
σρ(0)superscriptsubscript𝜎𝜌0\sigma_{\rho}^{(0)}, nb 0.145 ±plus-or-minus\pm 0.063 0.7080.134+0.146subscriptsuperscript0.7080.1460.1340.708^{+0.146}_{-0.134}
σω(0)superscriptsubscript𝜎𝜔0\sigma_{\omega}^{(0)}, nb 0.2990.124+0.175subscriptsuperscript0.2990.1750.1240.299^{+0.175}_{-0.124} 154.823.24+3.29subscriptsuperscript154.823.293.24154.82^{+3.29}_{-3.24}
σϕ(0)superscriptsubscript𝜎italic-ϕ0\sigma_{\phi}^{(0)}, nb 22.7910.238+0.220subscriptsuperscript22.7910.2200.23822.791^{+0.220}_{-0.238} 5.30±0.16plus-or-minus5.300.165.30\pm 0.16
σω(0)\sigma_{\omega\prime}^{(0)}, nb 0.1390.051+0.048subscriptsuperscript0.1390.0480.0510.139^{+0.048}_{-0.051}
mϕsubscript𝑚italic-ϕm_{\phi}, MeV 1019.52±0.05plus-or-minus1019.520.051019.52\pm 0.05 1019.46 (fixed)
mωsubscript𝑚𝜔m_{\omega}, MeV 782.59 (fixed) 783.20±0.13plus-or-minus783.200.13783.20\pm 0.13
φϕω,\varphi_{\phi-\omega},^{\circ} 180 (fixed) 164.4±7.9plus-or-minus164.47.9164.4\pm 7.9
χ2/\chi^{2}/n.d.f. 72.3/82 74.0/80

For the e+eπ0γsuperscript𝑒superscript𝑒superscript𝜋0𝛾e^{+}e^{-}\to\pi^{0}\gamma case the fit parameters are: the cross sections at the resonance peak σρ(0)superscriptsubscript𝜎𝜌0\sigma_{\rho}^{(0)}, σω(0)superscriptsubscript𝜎𝜔0\sigma_{\omega}^{(0)}, σϕ(0)superscriptsubscript𝜎italic-ϕ0\sigma_{\phi}^{(0)} and the ω𝜔\omega meson mass mωsubscript𝑚𝜔m_{\omega}. The ρω𝜌𝜔\rho-\omega phase is fixed to the value 13.3superscript13.313.3^{\circ} obtained in our study of the process e+eπ+πsuperscript𝑒superscript𝑒superscript𝜋superscript𝜋e^{+}e^{-}\to\pi^{+}\pi^{-} [26]. The ϕωitalic-ϕ𝜔\phi-\omega phase is a fit parameter. A fit, which includes a possible ω\omega\prime contribution, gives the best χ2superscript𝜒2\chi^{2} at the value of σω(0)\sigma_{\omega\prime}^{(0)} significantly differing from zero. Results of the best fit are shown in the last column of Table 5.

3.3 Systematic errors

There are two types of systematic uncertainties on the cross section σV0subscriptsuperscript𝜎0V\sigma^{0}_{\rm V}: experimental and model uncertainties. The main sources of experimental systematic errors are listed below. The systematic error due to selection criteria is 4% estimated by varying the photon energy threshold, total energy deposition, total momentum, and χ2superscript𝜒2\chi^{2}. A possible uncertainty because of the method of process separation was estimated to be 3% by comparing our results obtained from fitting the distributions of the two-photon invariant mass to those from Dalitz plot analysis. The latter method also allows to determine the cross section of the QED process e+e3γsuperscript𝑒superscript𝑒3𝛾e^{+}e^{-}\to 3\gamma and it appears to be consistent with the theoretical prediction [30]: σ(3γ)exp/σ(3γ)th=0.973±0.018𝜎subscript3𝛾exp𝜎subscript3𝛾thplus-or-minus0.9730.018\sigma(3\gamma)_{\rm exp}/\sigma(3\gamma)_{\rm th}=0.973\pm 0.018. The uncertainty in the determination of the integrated luminosity is 1% and comes from the selection criteria of Bhabha events, radiative corrections and calibrations of DC and BC. The error of the NT efficiency was estimated to be 2% by trying various fitting functions for energy dependence and variations of the cluster threshold. The 1% uncertainty of the radiative corrections comes from the dependence on the emitted photon energy and the accuracy of the theoretical formulae. In total, the experimental systematic uncertainty of the cross section is 6%.

The model uncertainty estimated by comparing the values of the cross section at the resonance peak in various models differing by the values of phases and resonance parameters was 1% (2%) for the ρ𝜌\rho, 3%(0.1%) for the ω𝜔\omega and 0.1%(5%) for the ϕitalic-ϕ\phi meson in the ηγ𝜂𝛾\eta\gamma and π0γsuperscript𝜋0𝛾\pi^{0}\gamma decay modes, respectively.

4 Discussion

In Table 6 we present our results in terms of the product of the branching ratios (Ve+e)×(VPγ)𝑉superscript𝑒superscript𝑒𝑉𝑃𝛾{\mathcal{B}}(V\to e^{+}e^{-})\times{\mathcal{B}}(V\to P\gamma), where P=η(π0)𝑃𝜂superscript𝜋0P=\eta(\pi^{0}), which is calculated from σV(0)superscriptsubscript𝜎V0\sigma_{\rm V}^{(0)} according to (3). For the ηγ𝜂𝛾\eta\gamma mode one should additionally take into account the branching ratio of the ηγγ𝜂𝛾𝛾\eta\to\gamma\gamma decay taking its value (ηγγ)=(39.43±0.26)%𝜂𝛾𝛾percentplus-or-minus39.430.26{\mathcal{B}}(\eta\to\gamma\gamma)=(39.43\pm 0.26)\% from Ref. [12]. For the π0γsuperscript𝜋0𝛾\pi^{0}\gamma mode the corresponding value (π0γγ)=(98.798±0.032)%superscript𝜋0𝛾𝛾percentplus-or-minus98.7980.032{\mathcal{B}}(\pi^{0}\to\gamma\gamma)=(98.798\pm 0.032)\% from Ref. [12] was included at the MC generation stage. Our results are in good agreement with the world average values [12].

Table 6: (Ve+e)×(VPγ)𝑉superscript𝑒superscript𝑒𝑉𝑃𝛾{\mathcal{B}}(V\to e^{+}e^{-})\times{\mathcal{B}}(V\to P\gamma)
Decay This work PDG–2004
ρηγ,108𝜌𝜂𝛾superscript108\rho\to\eta\gamma,10^{-8} 1.50±0.65±0.09plus-or-minus1.500.650.091.50\pm 0.65\pm 0.09 1.38±0.17plus-or-minus1.380.171.38\pm 0.17
ωηγ,108𝜔𝜂𝛾superscript108\omega\to\eta\gamma,10^{-8} 3.171.31+1.85±0.21plus-or-minussubscriptsuperscript3.171.851.310.213.17^{+1.85}_{-1.31}\pm 0.21 3.53±0.35plus-or-minus3.530.353.53\pm 0.35
ϕηγ,106italic-ϕ𝜂𝛾superscript106\phi\to\eta\gamma,10^{-6} 4.0930.043+0.040±0.247plus-or-minussubscriptsuperscript4.0930.0400.0430.2474.093^{+0.040}_{-0.043}\pm 0.247 3.85±0.07plus-or-minus3.850.073.85\pm 0.07
ρπ0γ,108𝜌superscript𝜋0𝛾superscript108\rho\to\pi^{0}\gamma,10^{-8} 2.900.55+0.60±0.18plus-or-minussubscriptsuperscript2.900.600.550.182.90^{+0.60}_{-0.55}\pm 0.18 2.8±0.6plus-or-minus2.80.62.8\pm 0.6
ωπ0γ,106𝜔superscript𝜋0𝛾superscript106\omega\to\pi^{0}\gamma,10^{-6} 6.47±0.14±0.39plus-or-minus6.470.140.396.47\pm 0.14\pm 0.39 6.370.15+0.17subscriptsuperscript6.370.170.156.37^{+0.17}_{-0.15}
ϕπ0γ,107italic-ϕsuperscript𝜋0𝛾superscript107\phi\to\pi^{0}\gamma,10^{-7} 3.75±0.11±0.29plus-or-minus3.750.110.293.75\pm 0.11\pm 0.29 3.67±0.28plus-or-minus3.670.283.67\pm 0.28

By dividing the product of the branching ratios above by the corresponding world average leptonic width from Ref. [12] one can obtain the branching ratios of the radiative decays confronted in Table 7 to the world average values [12].

Table 7: (VPγ)𝑉𝑃𝛾{\mathcal{B}}(V\to P\gamma)
Decay This work PDG–2004
ρηγ,104𝜌𝜂𝛾superscript104\rho\to\eta\gamma,10^{-4} 3.21±1.39±0.20plus-or-minus3.211.390.203.21\pm 1.39\pm 0.20 3.0±0.4plus-or-minus3.00.43.0\pm 0.4
ωηγ,104𝜔𝜂𝛾superscript104\omega\to\eta\gamma,10^{-4} 4.441.83+2.59±0.28plus-or-minussubscriptsuperscript4.442.591.830.284.44^{+2.59}_{-1.83}\pm 0.28 4.9±0.5plus-or-minus4.90.54.9\pm 0.5
ϕηγ,102italic-ϕ𝜂𝛾superscript102\phi\to\eta\gamma,10^{-2} 1.373±0.014±0.085plus-or-minus1.3730.0140.0851.373\pm 0.014\pm 0.085 1.295±0.025plus-or-minus1.2950.0251.295\pm 0.025
ρπ0γ,104𝜌superscript𝜋0𝛾superscript104\rho\to\pi^{0}\gamma,10^{-4} 6.211.18+1.28±0.39plus-or-minussubscriptsuperscript6.211.281.180.396.21^{+1.28}_{-1.18}\pm 0.39 6.0±1.3plus-or-minus6.01.36.0\pm 1.3
ωπ0γ,102𝜔superscript𝜋0𝛾superscript102\omega\to\pi^{0}\gamma,10^{-2} 9.06±0.20±0.57plus-or-minus9.060.200.579.06\pm 0.20\pm 0.57 8.920.24+0.28subscriptsuperscript8.920.280.248.92^{+0.28}_{-0.24}
ϕπ0γ,103italic-ϕsuperscript𝜋0𝛾superscript103\phi\to\pi^{0}\gamma,10^{-3} 1.258±0.037±0.077plus-or-minus1.2580.0370.0771.258\pm 0.037\pm 0.077 1.23±0.10plus-or-minus1.230.101.23\pm 0.10

Taking into account a variation of the mωsubscript𝑚𝜔m_{\omega} and mϕsubscript𝑚italic-ϕm_{\phi} in various models as well as a systematic error caused by the uncertainties of the beam energy calibration, we obtain for the resonance masses:

mωsubscript𝑚𝜔\displaystyle m_{\omega} =\displaystyle= 783.20±0.13±0.16MeV,plus-or-minus783.200.130.16MeV\displaystyle 783.20\pm 0.13\pm 0.16~{}{\rm MeV}, (4)
mϕsubscript𝑚italic-ϕ\displaystyle m_{\phi} =\displaystyle= 1019.52±0.05±0.05MeV,plus-or-minus1019.520.050.05MeV\displaystyle 1019.52\pm 0.05\pm 0.05~{}{\rm MeV}, (5)

consistent with the world average values 782.59±0.11plus-or-minus782.590.11782.59\pm 0.11 MeV and 1019.456±0.020plus-or-minus1019.4560.0201019.456\pm 0.020 MeV, respectively [12].

Our result for the cross section of the process e+eηγsuperscript𝑒superscript𝑒𝜂𝛾e^{+}e^{-}\to\eta\gamma at the peak of the ϕitalic-ϕ\phi meson can be combined with the independent measurement of the same quantity in the decay mode η3π0𝜂3superscript𝜋0\eta\to 3\pi^{0} performed at CMD-2 [20] to obtain the ratio of the branching fractions of the η𝜂\eta meson, (η3π0)/(ηγγ)𝜂3superscript𝜋0𝜂𝛾𝛾{\mathcal{B}}(\eta\to 3\pi^{0})/{\mathcal{B}}(\eta\to\gamma\gamma). Since in both cases the η𝜂\eta meson decays into neutral particles only, most of systematic uncertainties will cancel in such a ratio. As a result, two sources of the systematic error survive: 2.5% for the selection criteria and 3% due to process separation and we obtain

(η3π0)(ηγγ)=0.817±0.012±0.032,𝜂3superscript𝜋0𝜂𝛾𝛾plus-or-minus0.8170.0120.032\frac{{\mathcal{B}}(\eta\to 3\pi^{0})}{{\mathcal{B}}(\eta\to\gamma\gamma)}=0.817\pm 0.012\pm 0.032, (6)

which is consistent with the world average value 0.825±0.007plus-or-minus0.8250.0070.825\pm 0.007 [12].

5 Conclusions

  • Using a data sample corresponding to integrated luminosity of 21 pb-1, the cross sections of the processes e+eηγsuperscript𝑒superscript𝑒𝜂𝛾e^{+}e^{-}\to\eta\gamma, π0γsuperscript𝜋0𝛾\pi^{0}\gamma have been measured in the c.m. energy range 600–1380 MeV. The following branching ratios have been determined:

    (ρ0ηγ)superscript𝜌0𝜂𝛾\displaystyle{\mathcal{B}}(\rho^{0}\to\eta\gamma) =\displaystyle= (3.21±1.39±0.20)104,plus-or-minus3.211.390.20superscript104\displaystyle(3.21\pm 1.39\pm 0.20)\cdot 10^{-4},
    (ωηγ)𝜔𝜂𝛾\displaystyle{\mathcal{B}}(\omega\to\eta\gamma) =\displaystyle= (4.441.83+2.59±0.28)104,plus-or-minussubscriptsuperscript4.442.591.830.28superscript104\displaystyle(4.44^{+2.59}_{-1.83}\pm 0.28)\cdot 10^{-4},
    (ϕηγ)italic-ϕ𝜂𝛾\displaystyle{\mathcal{B}}(\phi\to\eta\gamma) =\displaystyle= (1.373±0.014±0.085)102,plus-or-minus1.3730.0140.085superscript102\displaystyle(1.373\pm 0.014\pm 0.085)\cdot 10^{-2},
    (ρ0π0γ)superscript𝜌0superscript𝜋0𝛾\displaystyle{\mathcal{B}}(\rho^{0}\to\pi^{0}\gamma) =\displaystyle= (6.211.18+1.28±0.39)104,plus-or-minussubscriptsuperscript6.211.281.180.39superscript104\displaystyle(6.21^{+1.28}_{-1.18}\pm 0.39)\cdot 10^{-4},
    (ωπ0γ)𝜔superscript𝜋0𝛾\displaystyle{\mathcal{B}}(\omega\to\pi^{0}\gamma) =\displaystyle= (9.06±0.20±0.57)102,plus-or-minus9.060.200.57superscript102\displaystyle(9.06\pm 0.20\pm 0.57)\cdot 10^{-2},
    (ϕπ0γ)italic-ϕsuperscript𝜋0𝛾\displaystyle{\mathcal{B}}(\phi\to\pi^{0}\gamma) =\displaystyle= (1.258±0.037±0.077)104.plus-or-minus1.2580.0370.077superscript104\displaystyle(1.258\pm 0.037\pm 0.077)\cdot 10^{-4}.
  • From the two independent measurements of the ϕηγitalic-ϕ𝜂𝛾\phi\to\eta\gamma decay the following ratio of the branching ratios of the η𝜂\eta meson has been obtained:

    (η3π0)/(ηγγ)=0.817±0.012±0.032.𝜂3superscript𝜋0𝜂𝛾𝛾plus-or-minus0.8170.0120.032\displaystyle{\mathcal{B}}(\eta\to 3\pi^{0})/{\mathcal{B}}(\eta\to\gamma\gamma)=0.817\pm 0.012\pm 0.032.

Acknowledgments

The authors are grateful to the staff of VEPP-2M for the excellent performance of the collider, and to all engineers and technicians who participated in the design, commissioning and operation of CMD-2. This work is supported in part by grants DOE DEFG0291ER40646, NSF PHY-0100468, PST.CLG.980342, RFBR-03-02-16280, RFBR-03-02-16477, RFBR-03-02-16843, RFBR-04-02-16217, and RFBR-04-02-16223-a.

References

  • [1] T. Ohshima, Phys. Rev. D 22 (1980) 707.
  • [2] P.J. O’Donnell, Rev. Mod. Phys. 53 (1981) 673.
  • [3] A. Bramon, A. Grau, G. Pancheri, Phys. Lett. B 344 (1995) 240.
  • [4] M. Hashimoto, Phys. Rev. D 54 (1996) 5611.
  • [5] M. Benayoun, S.I. Eidelman, V.N. Ivanchenko, Z. Phys. C 72 (1996) 221.
  • [6] P. Ball, J.M. Frere, M. Tytgat, Phys. Lett. B 365 (1996) 367.
  • [7] A. Bramon, R. Escribano, M.D. Scadron, Eur. Phys. J. C 7 (1999) 271.
  • [8] M. Benayoun, Phys. Rev. D 59 (1999) 114027.
  • [9] M. Davier, et al., Eur. Phys. J. C 31 (2003) 503.
  • [10] T. Barnes, et al., Phys. Rev. D 55 (1997) 4157.
  • [11] F. Close, A. Donnachie, Yu.S. Kalashnikova, Phys. Rev. D 67 (2003) 074031.
  • [12] S. Eidelman et al., Phys. Lett. B 592 (2004) 1.
  • [13] V.P. Druzhinin, et al., Phys. Lett. 144 B (1984) 136.
  • [14] S.I. Dolinsky et al., Z. Phys. C42 (1989) 511.
  • [15] M.N. Achasov et al., Eur. Phys. J. C 12 (2000) 25.
  • [16] M.N. Achasov et al., Phys. Lett. B 559 (2003) 171.
  • [17] G. A. Aksenov et al., Preprint Budker INP 85-118, Novosibirsk, 1985; E. V. Anashkin et al., ICFA Instr. Bulletin 5 (1988) 18.
  • [18] R. R. Akhmetshin et al., Preprint Budker INP 99-11, Novosibirsk, 1999.
  • [19] E.V. Anashkin et al., Preprint Budker INP 99-1, Novosibirsk, 1999.
  • [20] R.R. Akhmetshin et al., Phys. Lett. B 509 (2001) 217.
  • [21] R.R. Akhmetshin et al., Phys. Lett. B 508 (2001) 217.
  • [22] R.R. Akhmetshin et al., Phys. Lett. B 551 (2003) 27.
  • [23] R.R. Akhmetshin et al., Phys. Lett. B 562 (2003) 173.
  • [24] R.R. Akhmetshin et al., Phys. Lett. B 580 (2004) 119.
  • [25] E. A. Kuraev and V.S. Fadin, Sov. J. Nucl. Phys., 41 (1985) 466.
  • [26] R.R. Akhmetshin et al., Phys. Lett. B 578 (2004) 285.
  • [27] G. J. Gounaris and J.J. Sakurai, Phys. Rev. Lett. 21 (1968) 244.
  • [28] R.R. Akhmetshin et al., Phys. Lett. B 434 (1998) 426.
  • [29] R.R. Akhmetshin et al., Phys. Lett. B 466 (1999) 392.
  • [30] S.I. Eidelman and E.A. Kuraev, Nucl. Phys. B 143 (1978) 353.