A METHOD OF EXTRACTING THE MASS OF THE TOP QUARK IN THE DI-LEPTON CHANNEL USING THE DØ DETECTOR
Abstract
We present a method for extracting the mass of the top quark from the di-lepton decays of top anti-top quark pairs. In this decay channel two neutrinos remain undetected. Extraction of the mass of the top quark by kinematic reconstruction is not possible because the event is under-constrained. We therefore employ a dynamical likelihood method to solve the problem.
1 The di-lepton event topology
In the di-lepton channel top anti-top quark pairs decay via
followed by We can identify and measure the -momenta
of the jets111Both jets are assumed to be -jets and the charged
leptons. The two neutrinos in the event remain undetected. The vector sum of
their transverse momenta can be inferred from the observed missing
This leaves us with observables out of values
needed to describe the six particle final state. In order to constrain the
kinematics, three additional constraints on the invariant masses of
final state particle combinations are introduced:
In the end the set of equations are still under-constrained by one equation.
Extraction of the mass of the top quark by kinematic reconstruction is
therefore not possible.
2 The Analysis
This analysis was developed during Run I[1]. Ideally we would like to calculate the probability to measure the observables , given the top quark mass
| (1) |
is the probability density function (pdf) for measuring given the final state parameters for a hypothetical and for the parton (anti-parton) momentum fraction Here is the proton (anti-proton) parton distribution function and is the matrix element for the process. A hypothetical value of is used as the last constraint. We then obtain up to real solutions for the and momenta[3]. There is a two-fold combinatoric ambiguity in pairing the charged leptons and -jets. As a result up to eight solutions of the neutrino momenta are possible. Instead of rigorously computing the pdf in Equation 1, event weights[2][3] are used to characterize the physics. In this poster we calibrate the effect of this simplification by comparing the measured mass of the top quark obtained from the likelihood fits to simulated events, versus the value used in their generation.
For every event, a weight which is a function of the hypothesized mass of the top quark is derived[1][2][3] that corresponds to the neutrino momentum solution. The event weight
| (2) |
represents the likelihood to observe the event for a given Here is the probability density function for the energy of the charged lepton to be in the rest frame of the top quark of mass [4]. The quantity is the analogue for the anti-top quark. With solutions for the neutrino momenta the total event weight is defined as:
| (3) |
The value of at which the weight curve peaks is used as the mass estimator in the analysis.
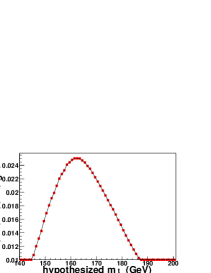
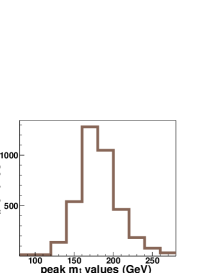
All simulated events are first filtered using the same criteria as for data events[5]. Figure 1(left) shows the weight curve for a simulated event with input GeV. The peak values from many events generated with the same are binned into histograms to construct templates, one of which is shown in Figure 1(right).
It is not possible to generate MC events with continuously varying input Seven distinct values are used to generate the signal MC template distributions from GeV to GeV. Templates representing contamination from background processes are also constructed and then added to the signal templates in the proportion of the expected background[5]. Normalized templates represent the likelihood of observing the particular event if the mass of the top quark equals
Sets of eight MC events are used to construct simulated experiments222Eight emu events observed from data[5]..
A binned maximum likelihood fit is performed for each such ensemble
using the template distributions.
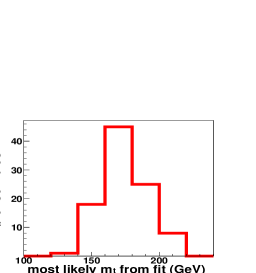
One such fit to ensemble events is illustrated in
Figure 2(left). Many different ensembles are constructed,
and the exercise
is repeated many times to obtain a distribution of maximum
likelihood estimates (MLEs) as in Figure 2(center).
The mean of this distribution yields the mean fitted estimate of .
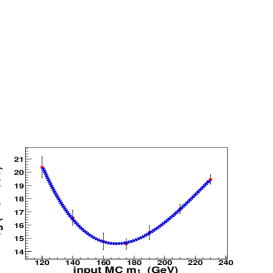
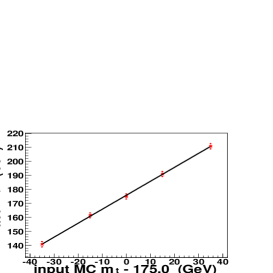
Repeating the same exercise for different input MC yields
values which can be used to check the performance of the method.
A straight line parameterized as:
fitted mass
gives the best fit to the ensemble test results for and GeV. This fit to the set of points, shown in Figure 2(right), is consistent with a straight line of unit slope and GeV offset.
3 Conclusion
The calibration of this method verifies its performance, and indicates absence of bias in the method.
4 Acknowledgments
I would like to thank the DØ collaboration for the opportunity to present this work at PIC-2004, and in particular my thesis adviser, Professor Ulrich Heintz, for his guidance.
References
- [1] DØ collab., Phys. Rev. Lett. 80, 2063 (1998); Phys. Rev. D 60, 052001 (1999)
- [2] K. Kondo, J. Phys. Soc. Japan 57, 4126 (1988); 60, 836 (1991)
- [3] R. H. Dalitz, G.R. Goldstein, Phys. Rev. D 45, 1531 (1992); Phys. Lett. B 287, 225 (1992).
- [4] J. H. Kuhn, Nucl. Phys. B 237, 1415 (1984); A. Czarnecki, M. Jezabek, J. H. Kuhn, Nucl. Phys. B 351, 70, (1991)
- [5] DØ collab., Measurement of the Production Cross-section at TeV in di-lepton final states, DØ Note 4421-CONF.