on leave from ]Nova Gorica Polytechnic, Nova Gorica The Belle Collaboration
violation in - mixing with dilepton events
K. Abe
High Energy Accelerator Research Organization (KEK), Tsukuba
K. Abe
Tohoku Gakuin University, Tagajo
N. Abe
Tokyo Institute of Technology, Tokyo
I. Adachi
High Energy Accelerator Research Organization (KEK), Tsukuba
H. Aihara
Department of Physics, University of Tokyo, Tokyo
M. Akatsu
Nagoya University, Nagoya
Y. Asano
University of Tsukuba, Tsukuba
T. Aso
Toyama National College of Maritime Technology, Toyama
V. Aulchenko
Budker Institute of Nuclear Physics, Novosibirsk
T. Aushev
Institute for Theoretical and Experimental Physics, Moscow
T. Aziz
Tata Institute of Fundamental Research, Bombay
S. Bahinipati
University of Cincinnati, Cincinnati, Ohio 45221
A. M. Bakich
University of Sydney, Sydney NSW
Y. Ban
Peking University, Beijing
M. Barbero
University of Hawaii, Honolulu, Hawaii 96822
A. Bay
Swiss Federal Institute of Technology of Lausanne, EPFL, Lausanne
I. Bedny
Budker Institute of Nuclear Physics, Novosibirsk
U. Bitenc
J. Stefan Institute, Ljubljana
I. Bizjak
J. Stefan Institute, Ljubljana
S. Blyth
Department of Physics, National Taiwan University, Taipei
A. Bondar
Budker Institute of Nuclear Physics, Novosibirsk
A. Bozek
H. Niewodniczanski Institute of Nuclear Physics, Krakow
M. Bračko
University of Maribor, Maribor
J. Stefan Institute, Ljubljana
J. Brodzicka
H. Niewodniczanski Institute of Nuclear Physics, Krakow
T. E. Browder
University of Hawaii, Honolulu, Hawaii 96822
M.-C. Chang
Department of Physics, National Taiwan University, Taipei
P. Chang
Department of Physics, National Taiwan University, Taipei
Y. Chao
Department of Physics, National Taiwan University, Taipei
A. Chen
National Central University, Chung-li
K.-F. Chen
Department of Physics, National Taiwan University, Taipei
W. T. Chen
National Central University, Chung-li
B. G. Cheon
Chonnam National University, Kwangju
R. Chistov
Institute for Theoretical and Experimental Physics, Moscow
S.-K. Choi
Gyeongsang National University, Chinju
Y. Choi
Sungkyunkwan University, Suwon
Y. K. Choi
Sungkyunkwan University, Suwon
A. Chuvikov
Princeton University, Princeton, New Jersey 08545
S. Cole
University of Sydney, Sydney NSW
M. Danilov
Institute for Theoretical and Experimental Physics, Moscow
M. Dash
Virginia Polytechnic Institute and State University, Blacksburg, Virginia 24061
L. Y. Dong
Institute of High Energy Physics, Chinese Academy of Sciences, Beijing
R. Dowd
University of Melbourne, Victoria
J. Dragic
University of Melbourne, Victoria
A. Drutskoy
University of Cincinnati, Cincinnati, Ohio 45221
S. Eidelman
Budker Institute of Nuclear Physics, Novosibirsk
Y. Enari
Nagoya University, Nagoya
D. Epifanov
Budker Institute of Nuclear Physics, Novosibirsk
C. W. Everton
University of Melbourne, Victoria
F. Fang
University of Hawaii, Honolulu, Hawaii 96822
S. Fratina
J. Stefan Institute, Ljubljana
H. Fujii
High Energy Accelerator Research Organization (KEK), Tsukuba
N. Gabyshev
Budker Institute of Nuclear Physics, Novosibirsk
A. Garmash
Princeton University, Princeton, New Jersey 08545
T. Gershon
High Energy Accelerator Research Organization (KEK), Tsukuba
A. Go
National Central University, Chung-li
G. Gokhroo
Tata Institute of Fundamental Research, Bombay
B. Golob
University of Ljubljana, Ljubljana
J. Stefan Institute, Ljubljana
M. Grosse Perdekamp
RIKEN BNL Research Center, Upton, New York 11973
H. Guler
University of Hawaii, Honolulu, Hawaii 96822
J. Haba
High Energy Accelerator Research Organization (KEK), Tsukuba
F. Handa
Tohoku University, Sendai
K. Hara
High Energy Accelerator Research Organization (KEK), Tsukuba
T. Hara
Osaka University, Osaka
N. C. Hastings
High Energy Accelerator Research Organization (KEK), Tsukuba
K. Hasuko
RIKEN BNL Research Center, Upton, New York 11973
K. Hayasaka
Nagoya University, Nagoya
H. Hayashii
Nara Women’s University, Nara
M. Hazumi
High Energy Accelerator Research Organization (KEK), Tsukuba
E. M. Heenan
University of Melbourne, Victoria
I. Higuchi
Tohoku University, Sendai
T. Higuchi
High Energy Accelerator Research Organization (KEK), Tsukuba
L. Hinz
Swiss Federal Institute of Technology of Lausanne, EPFL, Lausanne
T. Hojo
Osaka University, Osaka
T. Hokuue
Nagoya University, Nagoya
Y. Hoshi
Tohoku Gakuin University, Tagajo
K. Hoshina
Tokyo University of Agriculture and Technology, Tokyo
S. Hou
National Central University, Chung-li
W.-S. Hou
Department of Physics, National Taiwan University, Taipei
Y. B. Hsiung
Department of Physics, National Taiwan University, Taipei
H.-C. Huang
Department of Physics, National Taiwan University, Taipei
T. Igaki
Nagoya University, Nagoya
Y. Igarashi
High Energy Accelerator Research Organization (KEK), Tsukuba
T. Iijima
Nagoya University, Nagoya
A. Imoto
Nara Women’s University, Nara
K. Inami
Nagoya University, Nagoya
A. Ishikawa
High Energy Accelerator Research Organization (KEK), Tsukuba
H. Ishino
Tokyo Institute of Technology, Tokyo
K. Itoh
Department of Physics, University of Tokyo, Tokyo
R. Itoh
High Energy Accelerator Research Organization (KEK), Tsukuba
M. Iwamoto
Chiba University, Chiba
M. Iwasaki
Department of Physics, University of Tokyo, Tokyo
Y. Iwasaki
High Energy Accelerator Research Organization (KEK), Tsukuba
R. Kagan
Institute for Theoretical and Experimental Physics, Moscow
H. Kakuno
Department of Physics, University of Tokyo, Tokyo
J. H. Kang
Yonsei University, Seoul
J. S. Kang
Korea University, Seoul
P. Kapusta
H. Niewodniczanski Institute of Nuclear Physics, Krakow
S. U. Kataoka
Nara Women’s University, Nara
N. Katayama
High Energy Accelerator Research Organization (KEK), Tsukuba
H. Kawai
Chiba University, Chiba
H. Kawai
Department of Physics, University of Tokyo, Tokyo
Y. Kawakami
Nagoya University, Nagoya
N. Kawamura
Aomori University, Aomori
T. Kawasaki
Niigata University, Niigata
N. Kent
University of Hawaii, Honolulu, Hawaii 96822
H. R. Khan
Tokyo Institute of Technology, Tokyo
A. Kibayashi
Tokyo Institute of Technology, Tokyo
H. Kichimi
High Energy Accelerator Research Organization (KEK), Tsukuba
H. J. Kim
Kyungpook National University, Taegu
H. O. Kim
Sungkyunkwan University, Suwon
Hyunwoo Kim
Korea University, Seoul
J. H. Kim
Sungkyunkwan University, Suwon
S. K. Kim
Seoul National University, Seoul
T. H. Kim
Yonsei University, Seoul
K. Kinoshita
University of Cincinnati, Cincinnati, Ohio 45221
P. Koppenburg
High Energy Accelerator Research Organization (KEK), Tsukuba
S. Korpar
University of Maribor, Maribor
J. Stefan Institute, Ljubljana
P. Križan
University of Ljubljana, Ljubljana
J. Stefan Institute, Ljubljana
P. Krokovny
Budker Institute of Nuclear Physics, Novosibirsk
R. Kulasiri
University of Cincinnati, Cincinnati, Ohio 45221
C. C. Kuo
National Central University, Chung-li
H. Kurashiro
Tokyo Institute of Technology, Tokyo
E. Kurihara
Chiba University, Chiba
A. Kusaka
Department of Physics, University of Tokyo, Tokyo
A. Kuzmin
Budker Institute of Nuclear Physics, Novosibirsk
Y.-J. Kwon
Yonsei University, Seoul
J. S. Lange
University of Frankfurt, Frankfurt
G. Leder
Institute of High Energy Physics, Vienna
S. E. Lee
Seoul National University, Seoul
S. H. Lee
Seoul National University, Seoul
Y.-J. Lee
Department of Physics, National Taiwan University, Taipei
T. Lesiak
H. Niewodniczanski Institute of Nuclear Physics, Krakow
J. Li
University of Science and Technology of China, Hefei
A. Limosani
University of Melbourne, Victoria
S.-W. Lin
Department of Physics, National Taiwan University, Taipei
D. Liventsev
Institute for Theoretical and Experimental Physics, Moscow
J. MacNaughton
Institute of High Energy Physics, Vienna
G. Majumder
Tata Institute of Fundamental Research, Bombay
F. Mandl
Institute of High Energy Physics, Vienna
D. Marlow
Princeton University, Princeton, New Jersey 08545
T. Matsuishi
Nagoya University, Nagoya
H. Matsumoto
Niigata University, Niigata
S. Matsumoto
Chuo University, Tokyo
T. Matsumoto
Tokyo Metropolitan University, Tokyo
A. Matyja
H. Niewodniczanski Institute of Nuclear Physics, Krakow
Y. Mikami
Tohoku University, Sendai
W. Mitaroff
Institute of High Energy Physics, Vienna
K. Miyabayashi
Nara Women’s University, Nara
Y. Miyabayashi
Nagoya University, Nagoya
H. Miyake
Osaka University, Osaka
H. Miyata
Niigata University, Niigata
R. Mizuk
Institute for Theoretical and Experimental Physics, Moscow
D. Mohapatra
Virginia Polytechnic Institute and State University, Blacksburg, Virginia 24061
G. R. Moloney
University of Melbourne, Victoria
G. F. Moorhead
University of Melbourne, Victoria
T. Mori
Tokyo Institute of Technology, Tokyo
A. Murakami
Saga University, Saga
T. Nagamine
Tohoku University, Sendai
Y. Nagasaka
Hiroshima Institute of Technology, Hiroshima
T. Nakadaira
Department of Physics, University of Tokyo, Tokyo
I. Nakamura
High Energy Accelerator Research Organization (KEK), Tsukuba
E. Nakano
Osaka City University, Osaka
M. Nakao
High Energy Accelerator Research Organization (KEK), Tsukuba
H. Nakazawa
High Energy Accelerator Research Organization (KEK), Tsukuba
Z. Natkaniec
H. Niewodniczanski Institute of Nuclear Physics, Krakow
K. Neichi
Tohoku Gakuin University, Tagajo
S. Nishida
High Energy Accelerator Research Organization (KEK), Tsukuba
O. Nitoh
Tokyo University of Agriculture and Technology, Tokyo
S. Noguchi
Nara Women’s University, Nara
T. Nozaki
High Energy Accelerator Research Organization (KEK), Tsukuba
A. Ogawa
RIKEN BNL Research Center, Upton, New York 11973
S. Ogawa
Toho University, Funabashi
T. Ohshima
Nagoya University, Nagoya
T. Okabe
Nagoya University, Nagoya
S. Okuno
Kanagawa University, Yokohama
S. L. Olsen
University of Hawaii, Honolulu, Hawaii 96822
Y. Onuki
Niigata University, Niigata
W. Ostrowicz
H. Niewodniczanski Institute of Nuclear Physics, Krakow
H. Ozaki
High Energy Accelerator Research Organization (KEK), Tsukuba
P. Pakhlov
Institute for Theoretical and Experimental Physics, Moscow
H. Palka
H. Niewodniczanski Institute of Nuclear Physics, Krakow
C. W. Park
Sungkyunkwan University, Suwon
H. Park
Kyungpook National University, Taegu
K. S. Park
Sungkyunkwan University, Suwon
N. Parslow
University of Sydney, Sydney NSW
L. S. Peak
University of Sydney, Sydney NSW
M. Pernicka
Institute of High Energy Physics, Vienna
J.-P. Perroud
Swiss Federal Institute of Technology of Lausanne, EPFL, Lausanne
M. Peters
University of Hawaii, Honolulu, Hawaii 96822
L. E. Piilonen
Virginia Polytechnic Institute and State University, Blacksburg, Virginia 24061
A. Poluektov
Budker Institute of Nuclear Physics, Novosibirsk
F. J. Ronga
High Energy Accelerator Research Organization (KEK), Tsukuba
N. Root
Budker Institute of Nuclear Physics, Novosibirsk
M. Rozanska
H. Niewodniczanski Institute of Nuclear Physics, Krakow
H. Sagawa
High Energy Accelerator Research Organization (KEK), Tsukuba
M. Saigo
Tohoku University, Sendai
S. Saitoh
High Energy Accelerator Research Organization (KEK), Tsukuba
Y. Sakai
High Energy Accelerator Research Organization (KEK), Tsukuba
H. Sakamoto
Kyoto University, Kyoto
T. R. Sarangi
High Energy Accelerator Research Organization (KEK), Tsukuba
M. Satapathy
Utkal University, Bhubaneswer
N. Sato
Nagoya University, Nagoya
O. Schneider
Swiss Federal Institute of Technology of Lausanne, EPFL, Lausanne
J. Schümann
Department of Physics, National Taiwan University, Taipei
C. Schwanda
Institute of High Energy Physics, Vienna
A. J. Schwartz
University of Cincinnati, Cincinnati, Ohio 45221
T. Seki
Tokyo Metropolitan University, Tokyo
S. Semenov
Institute for Theoretical and Experimental Physics, Moscow
K. Senyo
Nagoya University, Nagoya
Y. Settai
Chuo University, Tokyo
R. Seuster
University of Hawaii, Honolulu, Hawaii 96822
M. E. Sevior
University of Melbourne, Victoria
T. Shibata
Niigata University, Niigata
H. Shibuya
Toho University, Funabashi
B. Shwartz
Budker Institute of Nuclear Physics, Novosibirsk
V. Sidorov
Budker Institute of Nuclear Physics, Novosibirsk
V. Siegle
RIKEN BNL Research Center, Upton, New York 11973
J. B. Singh
Panjab University, Chandigarh
A. Somov
University of Cincinnati, Cincinnati, Ohio 45221
N. Soni
Panjab University, Chandigarh
R. Stamen
High Energy Accelerator Research Organization (KEK), Tsukuba
S. Stanič
[
University of Tsukuba, Tsukuba
M. Starič
J. Stefan Institute, Ljubljana
A. Sugi
Nagoya University, Nagoya
A. Sugiyama
Saga University, Saga
K. Sumisawa
Osaka University, Osaka
T. Sumiyoshi
Tokyo Metropolitan University, Tokyo
S. Suzuki
Saga University, Saga
S. Y. Suzuki
High Energy Accelerator Research Organization (KEK), Tsukuba
O. Tajima
High Energy Accelerator Research Organization (KEK), Tsukuba
F. Takasaki
High Energy Accelerator Research Organization (KEK), Tsukuba
K. Tamai
High Energy Accelerator Research Organization (KEK), Tsukuba
N. Tamura
Niigata University, Niigata
K. Tanabe
Department of Physics, University of Tokyo, Tokyo
M. Tanaka
High Energy Accelerator Research Organization (KEK), Tsukuba
G. N. Taylor
University of Melbourne, Victoria
Y. Teramoto
Osaka City University, Osaka
X. C. Tian
Peking University, Beijing
S. Tokuda
Nagoya University, Nagoya
S. N. Tovey
University of Melbourne, Victoria
K. Trabelsi
University of Hawaii, Honolulu, Hawaii 96822
T. Tsuboyama
High Energy Accelerator Research Organization (KEK), Tsukuba
T. Tsukamoto
High Energy Accelerator Research Organization (KEK), Tsukuba
K. Uchida
University of Hawaii, Honolulu, Hawaii 96822
S. Uehara
High Energy Accelerator Research Organization (KEK), Tsukuba
T. Uglov
Institute for Theoretical and Experimental Physics, Moscow
K. Ueno
Department of Physics, National Taiwan University, Taipei
Y. Unno
Chiba University, Chiba
S. Uno
High Energy Accelerator Research Organization (KEK), Tsukuba
Y. Ushiroda
High Energy Accelerator Research Organization (KEK), Tsukuba
G. Varner
University of Hawaii, Honolulu, Hawaii 96822
K. E. Varvell
University of Sydney, Sydney NSW
S. Villa
Swiss Federal Institute of Technology of Lausanne, EPFL, Lausanne
C. C. Wang
Department of Physics, National Taiwan University, Taipei
C. H. Wang
National United University, Miao Li
J. G. Wang
Virginia Polytechnic Institute and State University, Blacksburg, Virginia 24061
M.-Z. Wang
Department of Physics, National Taiwan University, Taipei
M. Watanabe
Niigata University, Niigata
Y. Watanabe
Tokyo Institute of Technology, Tokyo
L. Widhalm
Institute of High Energy Physics, Vienna
Q. L. Xie
Institute of High Energy Physics, Chinese Academy of Sciences, Beijing
B. D. Yabsley
Virginia Polytechnic Institute and State University, Blacksburg, Virginia 24061
A. Yamaguchi
Tohoku University, Sendai
H. Yamamoto
Tohoku University, Sendai
S. Yamamoto
Tokyo Metropolitan University, Tokyo
T. Yamanaka
Osaka University, Osaka
Y. Yamashita
Nihon Dental College, Niigata
M. Yamauchi
High Energy Accelerator Research Organization (KEK), Tsukuba
Heyoung Yang
Seoul National University, Seoul
P. Yeh
Department of Physics, National Taiwan University, Taipei
J. Ying
Peking University, Beijing
K. Yoshida
Nagoya University, Nagoya
Y. Yuan
Institute of High Energy Physics, Chinese Academy of Sciences, Beijing
Y. Yusa
Tohoku University, Sendai
H. Yuta
Aomori University, Aomori
S. L. Zang
Institute of High Energy Physics, Chinese Academy of Sciences, Beijing
C. C. Zhang
Institute of High Energy Physics, Chinese Academy of Sciences, Beijing
J. Zhang
High Energy Accelerator Research Organization (KEK), Tsukuba
L. M. Zhang
University of Science and Technology of China, Hefei
Z. P. Zhang
University of Science and Technology of China, Hefei
V. Zhilich
Budker Institute of Nuclear Physics, Novosibirsk
T. Ziegler
Princeton University, Princeton, New Jersey 08545
D. Žontar
University of Ljubljana, Ljubljana
J. Stefan Institute, Ljubljana
D. Zürcher
Swiss Federal Institute of Technology of Lausanne, EPFL, Lausanne
Abstract
We report a measurement of the charge asymmetry for same-sign dileptons
in - mixing.
The data were collected with the Belle detector at KEKB. Using a data sample of
78 f \reciprocal b recorded at the resonance and
9 f \reciprocal b recorded at an energy 60 M eV below the resonance, we measure
.
pacs:
13.65.+i, 13.25.Gv, 14.40.Gx
††preprint: BELLE-CONF-0451ICHEP04 8-0699
I Introduction
The standard model allows -violation in
- mixing cpvmix . In particular, there is a possible difference
between the and transition
rates, which can manifest itself as a charge asymmetry in the same-sign dilepton events in
decays when prompt leptons from
semileptonic decays of neutral mesons are selected.
With the assumption of CPT invariance in the mixing, the flavor and
mass eigenstates of the neutral mesons are related by
(1)
The time-dependent decay rate for same-sign dileptons is given by
(2)
for the sample. For the sample, is replaced by .
Here and are the differences in mass and
decay width between the two mass eigenstates, is
the average lifetime of the two mass eigenstates, is the
proper time difference between the two meson decays. In this analysis only
the absolute value of is used.
It is assumed that the semileptonic decay of the neutral meson is
flavour specific and conserving, so that .
If is not conserved in mixing, the condition is no
longer required and the decay rates for and
samples can differ.
As can be seen in Eq. 2, the dependence is the
same for the and samples, and therefore
the -violation shows up as a -independent charge asymmetry,
defined as
(3)
Here corresponds to the describing
-violation in the neutral meson system. Standard Model
calculations give the size of this asymmetry to be of the order of
cppredict ; PRD .
A significantly larger value would therefore
be an indication of new physics.
Experimentally, measurement of same-sign dilepton events that
originate from and initial states
requires careful charge-dependent corrections, which must be done in
several steps. First, the contribution from continuum
(where or ) to
same-sign dilepton events must be
subtracted using off-resonance data. Second, all detected lepton
tracks must be corrected for charge asymmetries in
the efficiencies for track finding and
lepton identification, and for
the probabilities of misidentifying hadrons as leptons.
After these corrections,
the remaining same-sign dilepton events still
contain backgrounds from and events.
The last step of this analysis is to separate the
signal events from these background events using their different behavior
in the distributions.
II Belle Detector
The data were collected with the Belle detector belle at the KEKB
asymmetric collider kekb .
The Belle detector is a large-solid-angle magnetic
spectrometer that
consists of a three-layer silicon vertex detector (SVD),
a 50-layer central drift chamber (CDC) for tracking, a mosaic of
aerogel threshold Cherenkov counters, time-of-flight
scintillation counters (TOF), and an array of CsI(T) crystals
for electromagnetic calorimetry (ECL) located inside of
a superconducting solenoid coil that provides a 1.5 T
magnetic field. An iron flux-return located outside of
the coil is instrumented to detect mesons and to identify
muons (KLM).
The integrated luminosity of the data sample is 78 f \reciprocal b at the
resonance (“on-resonance”) and 9 f \reciprocal b at 60 MeV
below from the resonance (“off-resonance”).
II.1 Track finding Efficiency
The track finding efficiency is determined by analyzing a sample
where simulated single electron or muon tracks are overlaid on
hadronic events taken from experimental data. Lepton tracks are
generated to cover the region of and
,
where is the lepton momentum in the center-of-mass (c.m.)
and is the
angle of lepton track with respect to the -axis in the laboratory
frame. The -axis passes through the nominal interaction point, and
is anti-parallel to the positron beam direction. Figure 1
shows track finding efficiencies for positive and negative tracks
separately and their fractional differences as a function of for
electron and muon tracks. Events in all regions
are combined in these plots. The charge dependence of the track finding
efficiency for both electrons and muons is less than 1.0%.
Figure 1: Track finding efficiencies as a function of c.m. momentum
for positron tracks (a), electron tracks
(b), and charge dependence defined as
.
Corresponding plots for muon tracks are shown in (d), (e), and (f)
.
II.2 Lepton Identification
The most important contribution to the electron identification comes
from examination of the ratio of the ECL cluster energy to the track
momentum measured in the CDC. This information is combined with the
shower measurement in the ECL, the specific ionization measurements () in
the CDC, and the ACC light yield, to form an electron likelihood
. eid
The two-photon process is used to
estimate the electron identification efficiency.
For this data sample, events are required to have: i)
two tracks with particle ID information inconsistent with a muon hypothesis,
laboratory momenta greater than and
transverse momenta greater than ;
ii) at least one ECL cluster with energy greater than .
The two tracks are required to have:
i) an acolinearity angle whose cosine is greater than ;
ii) a transverse-momentum sum less than ; and
a longitudinal momentum sum of less than in the c.m. frame;
iii) an invariant mass less than . In addition the sum of the
ECL cluster energies must be between 0.6 G eV /c and 6.0 G eV /c.
The electron identification efficiency is obtained by taking the ratio of
the number of tracks selected with the above requirements with and without
additional electron identification requirements.
For muon identification, CDC tracks are extrapolated to the KLM and
the measured range and transverse deviation in the KLM is compared with
the expected values to form a muon likelihood muonid .
The muon identification efficiency is determined by analyzing a data sample
where simulated single-muon tracks are overlaid on the hadronic events
taken from experimental data.
Figure 2 shows the charge-dependent lepton identification
efficiencies, where electron tracks are required to satisfy
and the muon tracks are required to satisfy
and the reduced , of the transverse
deviation in the KLM is required to be less than 3.5. The charge
dependence of both electron and muon identification efficiencies are
less than 1%.
Figure 2: Identification efficiencies as a function of c.m. momentum
for positrons (a), electrons (b),
and charge dependence defined as
(c). Corresponding plots
for muons are shown in (d), (e), and (f).
II.3 Hadron identification
Comparison of the ACC light yield to the track momentum,
the time of flight measurement, and
measurements in the CDC
are combined to provide hadron likelihoods, for pions,
for kaons, and for protons.
II.4 Fake lepton
The hadron fake rate, which is defined as the probability that a hadron track
is mis-identified as a lepton, is determined from a sample of
for pions,
for kaons, and
() for protons.
These decays are selected from a hadronic event sample, which will be described later.
To select these track pair combinations, the closest approach with
respect to the run-dependent interaction point and the position of decay
vertex are used. The position distance of two tracks and the
deflection angle (except for ) at the decay vertex are also used.
For each decay, the invariant mass of the two tracks is
calculated after imposing the hadron identification requirement on the
negative (positive) charged track.
The signal yields are obtained by fitting the resulting mass distributions to sums of
double Gaussian signal terms and smooth background functions in two ways:
once without imposing any particle identification requirement and
again after imposing the lepton identification requirement on the positive
(negative) charged track. The ratios of the two signal yields give
the fake rates for the positive (negative) charged tracks.
The following cuts are placed on the likelihood ratios:
for pions in
,
for kaons in
, and
for pions in
.
The rate of pions faking electrons is at most 0.1% for both charges
and shows no significant charge dependence. The rate of kaons faking
electrons decreases rapidly as becomes larger and is
less than 0.2% for with no significant
charge dependence. While the rate of protons faking electrons is
nearly zero, the rate for anti-protons faking electrons is as large as 4% due to the large
anti-proton annihilation cross section in the ECL. The rate of pions
faking muons is about 1% for and shows
no significant charge dependence. The rate of kaons faking muons is 1%
to 2% and that for is about 50% larger than due to the
larger kaon-nucleon cross section for the . The rate of protons faking
muons is less than 0.4% and shows no clear charge dependence.
Figure 3:
Rates of pions ((a) and (d)), kaons ((b) and (e)), and protons ((c)
and (f)) faking electrons and muons vs laboratory momentum. Filled
circles are for positive tracks and open circles are for negative tracks.
The increase in the rate of kaons faking electrons at low momentum
clearly visible in (b) is due to the overlap of the electron and
kaon energy loss bands.
III Event Selection
III.1 Hadronic Event Selection
Hadronic events are required to have at least five tracks, an event
vertex with radial and coordinates within and
respectively of the nominal beam interaction point, a total
reconstructed c.m. energy greater than ( is the c.m.
energy), a net reconstructed c.m. momentum with a component less
than 0.3 , a total energy deposited to ECL between and
, and a ratio of the second and zeroth Fox-Wolfram
moments Fox-Wolfram less than 0.7.
III.2 Dilepton Event Selection
Lepton candidates are selected from the charged tracks by requiring
for electrons or and a reduced
of the transverse deviation in the KLM of less than 3.5 for muons.
In both cases a distance of closest approach to the run-dependent interaction
point less than radially and in is required. At least
one SVD hit per track in the - view and two SVD hits in the - view is required.
To eliminate electrons from
conversions, electron candidates are paired with all other oppositely
charged tracks and the invariant mass (assuming the electron mass
hypothesis) is calculated. If ,
the electron candidate is rejected. If a hadronic event contains more
than two lepton candidates, the two with the highest c.m. momenta are
used.
The two lepton candidates must satisfy additional criteria.
The c.m. momentum of each lepton is required to be in the range
. The lower cut reduces contributions from
secondary charm decay. The upper cut reduces continuum
contributions.
Each lepton track must satisfy . This cut selects tracks with better
vertex resolution and better lepton identification.
Events that contain one or more candidates are rejected.
The invariant mass of each candidate lepton paired with each
oppositely charged track (assuming the correct lepton mass hypothesis)
is calculated. If the invariant mass falls into the region,
defined as or
,
the candidate event is rejected. The looser lower cut for
the electron pair invariant mass is used to reject decays
with a low invariant
mass due to bremsstrahlung of the daughter electron(s).
As can be seen in Fig. 4, distributions of the opening
angle of the two tracks in the c.m. frame, ,
for the and pairs show distinct peaks in the
back-to-back direction (). This
background
is caused by jet-like continuum events and events with a
primary lepton and a secondary lepton originating from the same meson.
Also spikes can be seen at in the
pairs.
This structure is caused by jet-like continuum events where a non-muon
track is identified as muon because it is assigned hits in the KLM from a
true muon.
The opening dilepton angle in the
c.m. frame is required to satisfy
in order to reduce this background.
Figure 4:
distributions for the dilepton
samples of the on-resonance (open histogram) and scaled
off-resonance (filled histogram) data.
(a),(b) show events, (c),(d) show events and (e),(f) are
from combinations. (a),(c) and (e) are the charge case and
(b), (d) and (f) are the charge case.
The arrows indicate the selected range.
With these selection criteria there are 46551 positive and 45507
negative same sign dilepton events found in the on-resonance data.
Continuum contributions are estimated to be 2229.8 for positive and
1556.5 for negative same sign events, based on the yield from
off-resonance data. To estimate the continuum contribution from off-resonance
data, off-resonance yields were scaled by the integrated luminosities and
cross-section ratio. The scaling factor is defined in the Eq. 5.
These dilepton yields decomposed into different lepton
categories, are given in Table 1.
Table 1: Number of dilepton events
on-resonance
off-resonance
continuum
combination
positive
negative
positive
negative
positive
negative
9059 95.2
9028 95.0
11 3.3
11 3.3
96.2 28.9
96.2 28.9
14672121.1
14014118.4
14412.0
10010.0
1259.2104.9
874.4 87.4
22802151.0
22453149.8
10010.0
69 8.3
874.4 87.4
603.4 72.6
total
46533215.7
45477213.3
25516.0
18013.4
2229.8139.6
1574.0117.3
III.3 Determination
The -coordinate of each meson decay vertex is the production
point of the daughter lepton, which is determined from
the intersection of the lepton track with the run-dependent profile of
the interaction point.
is the distance between
the -coordinates of the two leptons.
In order to estimate the detector resolution in the determination
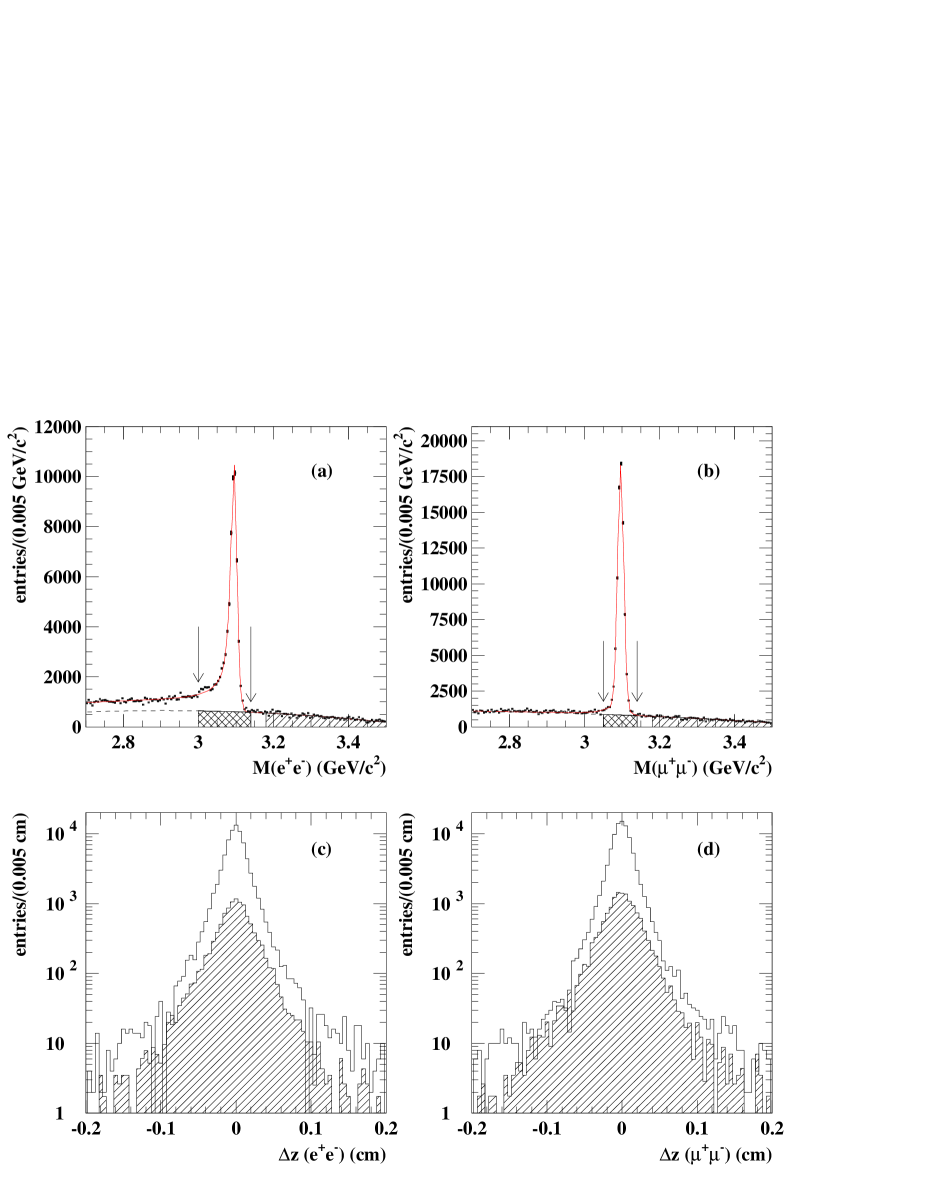
decays to and are used. In these events
the two tracks originate from the same point, so the measured ,
after the background contribution is subtracted, yields the detector
resolution. Candidate are selected using the same requirements
as the dilepton events except the veto. The signal regions
are defined as and and the sideband region as for both electrons and muons.
The invariant mass distributions of candidates are fitted to a
function given by
(4)
Here and are the heights of both Gaussians, is
the Gaussian mean which is common to two Gaussians,
and are the width of the Gaussians.
A parameter , given as for and
for ,
is introduced to modify the lower mass tail of one of the Gaussians for
the effect of bremsstrahlung using another parameter .
, and are the parameters of the background function.
The
distribution of the sideband region is scaled to the background
yield in the signal region and subtracted from the signal region distribution.
The mass distributions and the distributions are
shown in Fig. 5.
The RMS of the distributions are 193 for
,
for , and for the combined
.
Figure 5: Mass distributions for (a) and (b). The arrows indicate the signal region for each
decay mode. The dashed lines indicate the fitted background
component and the solid lines show the total fit results. The
cross hatched area shows the estimated combinatorial background in
the signal region and single hatched area is the sideband region
used to estimate background distribution. The distributions
for (c) and (d). Open
histograms are for all candidates in the signal region and
hatched histograms are for the background.
III.4 Subtraction of Continuum Events
A sample of dilepton events originating from events is obtained by
subtracting the luminosity and cross-section scaled off-resonance
data from the on-resonance data.
Since the kinematics of dilepton candidates are generally different
in these two data samples, the subtraction should, in principle be
performed in a six dimensional
(, , , , , )
space for each lepton flavour and charge combination,
where is the polar angle with respect to the beam axis
of more(less) energetic lepton
in c.m. frame.
The number of events is obtained from
(5)
where and are
the dilepton yields of origin and on(off)-resonance data,
respectively,
and are
the integrated luminosities and the square of c.m. energies for
on(off)-resonance, respectively.
is included here because this variable behaves
distinctly differently in the two data samples for the cases containing
muons, as shown in Fig. 4.
Given the available statistics, this approach is not possible. Instead, we perform
the subtraction by weighting the on-resonance and off-resonance yields
for one of the six kinematical variables, while integrating over the five other variables.
We obtain weighting factors for the six variables by
repeating this procedure. Since, t oa first approximation, the six
variables are not correlated with each other, this approach provides
the yield in the six variable space.
The weighting factors are given by
where denotes each of six variables,
is the scaling factor for the luminosity and c.m. energy introduced
in Eq. 5,
and
is the fraction of total in the on-resonance yield after integrtating over
all six variables and is used for the normalization.
While the weighting
factors show very little dependence on , , ,
and for all combinations of lepton flavours and charges,
a clear dependence is observed for in the case
of and data samples as shown in Fig. 6.
A clear dependence on is also seen for all lepton pair
combinations.
Figure 6: dependence of the weighting factor for the
fraction of the dilepton yield of origin in the on-resonance
data for (a) and (b) and
corresponding for (c) and (d) and (e) and (f).
Using this method, the dilepton candidate yield for each
lepton flavour and charge combination is then given
in terms of the on-resonance yield and the weighting factors
by
(6)
The dependence of the dilepton yields
are obtained by projecting
onto the axis.
IV Result
IV.1 Corrections to lepton candidates
The number of detected leptons for each lepton flavour and charge
is related to the number of true leptons
by
(7)
where and are
the efficiencies for track finding and lepton identification,
is the relative multiplicity of hadron
with respect to lepton in the event,
and is the rate of hadrons faking leptons .
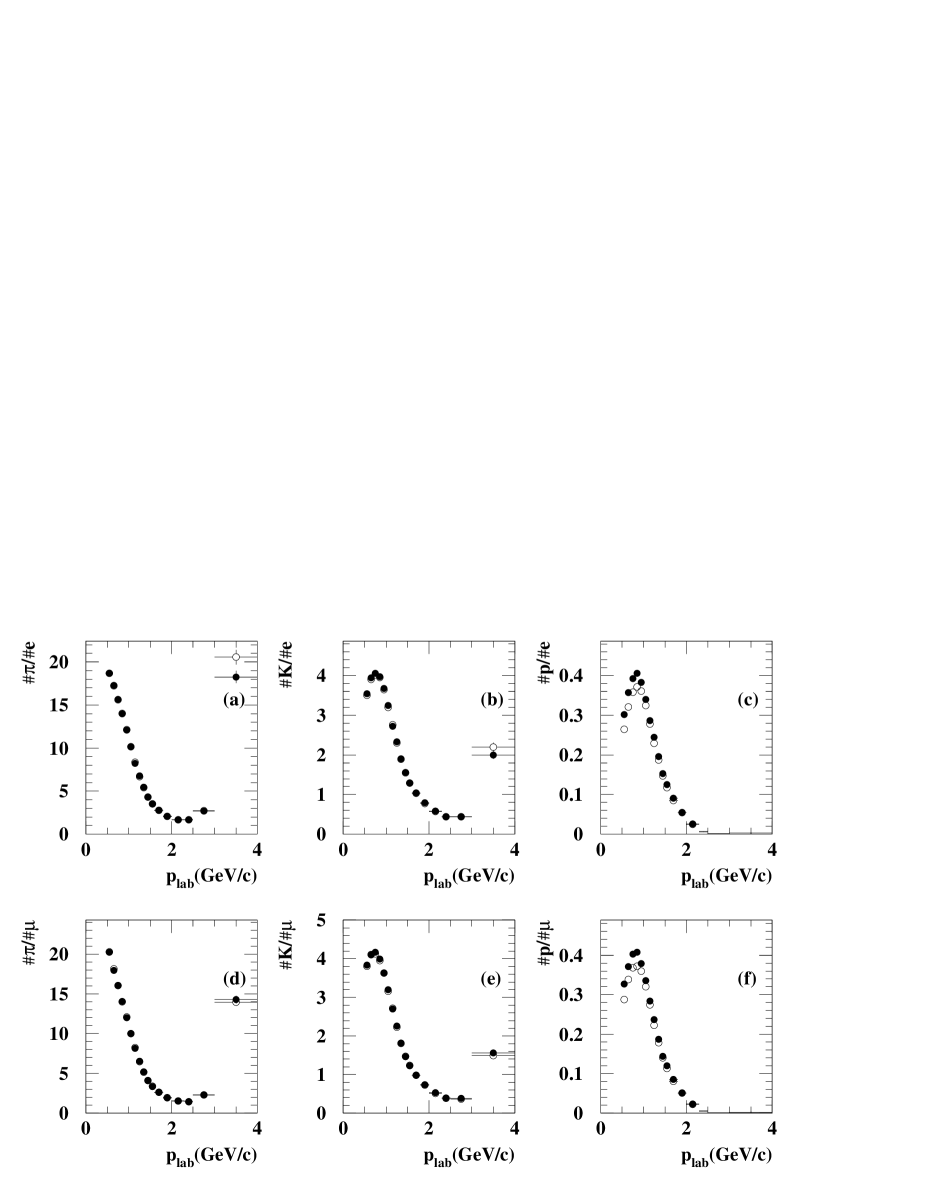
The relative multiplicities are determined from
Monte Carlo (MC) events, and are shown in Fig. 7.
Figure 7: Relative multiplicities of hadrons as a function of
with respect to leptons. The hadron and lepton species are indicated
on the vertical axis of each graph. Filled circles are for positive
tracks and open circles are for negative tracks. Though in (a),
(b), (d) and (e), the difference between positive and negative is
less than 1%, in both (c) and (f), proton rate is larger than
anti-proton rate by about 8%.
Using the measured efficiencies and fake rates and the MC determined relative
multiplicities, the correction factors
were determined in 7 bins of
(1.2–1.3, 1.3–1.4, 1.4–1.5, 1.5–1.6, 1.6–1.8, 1.8–2.0 and 2.0–2.3),
and
8 bins of
(30∘–37∘, 37∘–50∘, 50∘–77∘,
77∘–82∘, 82∘–111∘, 111∘–119∘,
119∘–128∘ and 128∘–135∘).
The fake rates are measured in the laboratory frame.
For the correction, they are converted into quantities in
(, ).
After the correction, the dilepton sample contains true leptons that come
either from prompt neutral meson decay (signal) or from background
processes such as charged meson decay, secondary charm decay, or
other leptonic meson processes.
IV.2 Fit to Distribution
A binned maximum likelihood fit with signal and background
contributions is used to extract from the distribution. The distribution for the signal events is given by
Eq. 2 assuming is negligible PDG as,
(8)
convolved with the detector response function described earlier.
Here is the lifetime and is the mixing parameter.
These parameters are fixed to their world average values PDG .
The backgrounds are placed into two categories; correctly tagged
(), and wrongly tagged ().
The category mainly contains events in which both leptons
come from secondary charm decay in
(mixed) processes. The category contains events in
which one lepton is from secondary charm decay of unmixed or
and the other is from a semi-leptonic decay.
Though background distributions are estimated using MC
simulations, this MC background distribution overestimates the
resolution in the data.
To correct for this the MC distribution is convolved with a
Gaussian hastings .
The distributions for the true same-sign dilepton events
where positive() and negative() samples are combined,
are shown
in Fig. 8 together with the fit results.
The of the fit is 72.17/38.
In the fit, the ratio of to is fixed at the MC value, and
only the ratio of signal and background is allowed to float.
The MC estimated and contributions to the distribution are shown in Fig. 8.
Figure 8: distribution for the true dilepton
events( and are combined).
Points with error bars are data. The dot-dashed line shows the
contribution from backgrounds, the dotted line shows the background contributions, the dashed line indicates the signal
component and the solid line indicates the total of the fit.
IV.3 Charge Asymmetry
The measured same-sign dilepton charge asymmetry is defined as
(9)
where are the distributions of the
true dilepton yields.
Since are the sum of signal and background,
,
the dilepton charge asymmetry is related to
by
(10)
where and .
A dilution factor, , is
calculated using the signal and background yields, which are determined
in the fit given in Fig. 8. The result of which is
determined from measured and dilution factor
is shown in Fig. 9.
The dilepton charge asymmetry is is a time integrated
quantity and does not depend on .
Fitting this distribution to a constant in the region of
, yields and
the is 68.73/36.
The optimum fitting range is determined using a MC study.
Figure 9: distribution for .
IV.4 Cross Checks
As a consistency check, is obtained for the , , and data samples, separately. The results, , , and , are consistent with the primary result.
Here the errors are statistical only.
In the extraction of from using
Eq. 10, it is assumed that . The validity of
this assumption is confirmed by repeating the fit without it. This yields
and in the range , which is consistent
with the initial assumption.
IV.5 Systematic errors
Systematic errors in the determination of come from uncertainties
in: i) the event selection criteria, ii) corrections for efficiencies
of track finding and lepton identification and for lepton
misidentification, iii) the continuum subtraction, iv) the fit for the
dilepton sample, v) the fit for the determination of .
Uncertainties in the event selection are estimated by repeating the
analysis with varied cut values. For the track selection, the
cut is varied from the nominal
– to – (barrel
detector part only) in several steps, the closest-approach cut in
from its nominal value of to in six steps, the
closest-approach cut in from to in five steps, the
cut from its nominal value of to in four steps, the
cut from nominal
to
in several steps, the requirement on the number of SVD hits by
from nominal value of greater or equal to two for and one for
. In addition, the mass cuts that reject and are widened by 20% and 50%.
To estimate the systematic error from the continuum subtraction, the
analysis is repeated with the continuum subtraction varied by the
statistical error of the off-resonance yield.
The contributions from track corrections are
estimated by varying each of the efficiencies, fake rates, and
relative multiplicities by .
The contribution from the detector response function is estimated
by changing the response function width according to the statistics of distribution of sample.
The contribution from the smearing is estimated by
repeating the analysis with and smearing,
which are the values obtained when the for the fit is changed by one compared with the
default fit. The contributions from uncertainties in and are also estimated by
varying the nominal values by . The dilution factor
fitting range is varied
from nominal to .
For the fitting range for the determination of the final , the
lower limit is varied from its nominal value of to in
several steps.
The results of the systematic error determination for are
summarized in Table 2.
Table 2:
Source of systematic errors for the measurement of
category
source
(%)
event selection
track selection
cut
lepton pair veto
continuum subtraction
track corrections
track finding efficiency
electron identification efficiency
muon identification efficiency
fake electrons
fake muons
relative multiplicity
fit for dileptons
detector response function
smearing of background
statistics of background MC
fitting range
assuming
fit for
fitting range
total
V Conclusion
The charge asymmetry for same-sign dilepton events decays has
been measured. The result is related to a -violation parameter in
- mixing, , or equivalently . The measured is
consistent with zero, or equivalently, is consistent with
unity. This implies -violation in - mixing is below
the level. The -violation parameter
can be calculated as ,
using the exact formula
(11)
These results are
consistent with and provide significantly more restrictive bounds than previous
measurements epsilon .
Acknowledgments
We thank the KEKB group for the excellent operation of the
accelerator, the KEK Cryogenics group for the efficient
operation of the solenoid, and the KEK computer group and
the National Institute of Informatics for valuable computing
and Super-SINET network support. We acknowledge support from
the Ministry of Education, Culture, Sports, Science, and
Technology of Japan and the Japan Society for the Promotion
of Science; the Australian Research Council and the
Australian Department of Education, Science and Training;
the National Science Foundation of China under contract
No. 10175071; the Department of Science and Technology of
India; the BK21 program of the Ministry of Education of
Korea and the CHEP SRC program of the Korea Science and
Engineering Foundation; the Polish State Committee for
Scientific Research under contract No. 2P03B 01324; the
Ministry of Science and Technology of the Russian
Federation; the Ministry of Education, Science and Sport of
the Republic of Slovenia; the National Science Council and
the Ministry of Education of Taiwan; and the U.S. Department of Energy.
References
(1)
A.B. Carter and A.I. Sanda, Phys. Rev. Lett. 45, 952 (1980);
Phys. Rev. D23, 1567 (1981).
(2)
See, for example,
A. Mohapatra, M. Satpathy, K. Abe, and Y. Sakai, Phys. Rev. D 58, 036003
(1998), and references therein.
(3)
R. N. Cahn and M. P. Worah, Phys. Rev. D60, 76006
(1999), Y. Nir, 27th SLAC Summer Institute on Particle Physics (1999), hep-ph/9911321, and references therein.
(4)
Belle Collaboration, A. Abashian et al. ,
Nucl. Instr. and Meth. A479, 117 (2002).
(5)
K. Akai et al. ,
Nucl. Instr. And Meth. A499, 191 (2003)
(6)
K. Hanagaki et al., Nucl. Instr. and Meth. A485, 490 (2002).
(7)
A. Abashian et al., Nucl. Instr. and Meth. A491, 69 (2002).
(8)
G. Fox and S. Wolfram, Phys. Rev. Lett. 41, 1581 (1978).
(9)
Particle Data Group, S. Eidelman et al., Phys. Lett. B 592, 1 (2004)
(10)
Belle Collaboration, N. Hastings et al.,
Phys. Rev. D67 052004 (2003).
(11)
CDF Collaboration, F. Abe et al.,
Phys. Rev. D55, 2546 (1996);
OPAL Collaboration, G. Abbiendi et al.,
Eur. Phys. J. C12, 609 (2000);
ALEPH Collaboration, R. Barate et al.,
Eur. Phys. J. C20, 431 (2001);
CLEO Collaboration, D.E. Jaffe et al.,
Phys. Rev. Lett. 86, 5000 (2001);
BABAR Collaboration, B. Aubert et al.,
Phys. Rev. Lett. 88, 231801 (2002);