TEVATRON RESULTS ON TOP QUARK PHYSICS.
Abstract
The CDF and D0 collaborations at Fermilab’s Tevatron collider have in place an extensive program to measure fundamental properties of the top quark. Recent results from Run I ( TeV) and Run II ( TeV) on the top quark’s production, mass, and decays are presented here. All results are consistent within their uncertainties with the Standard Model expectations for the top quark.
1 Introduction
After the discovery of the top quark in Run I of Fermilab’s Tevatron collider [1], the CDF and D0 collaborations switched from “discovery mode” to “measurement mode,” seeking to fully characterize the properties of this newest fundamental particle. However, the limited size of the Run I data sample () left most measurements with large statistical uncertainties.
Run II of the Tevatron is expected to yield 4–8 and therefore a far more detailed and necessary study of the physics of the top sector. By far the most intriguing aspect of the top quark is its mass; at 178 (about the same as an entire gold atom) it weighs in right at the electroweak symmetry breaking (EWSB) scale, which could be a clue to the origin of EWSB. Its large mass also leads to a lifetime shorter than the hadronization time scale, meaning it decays as a free quark and therefore provides the opportunity to probe heretofore-inaccessible bare quark properties such as spin and charge. Its production and decay can provide direct contact with the CKM matrix element and the study of the electroweak interaction at high energy. Finally, its energetic multi-body final states are often an important background in searches for new heavy particles (the Higgs boson being the canonical example).
2 Top Production and Decay at the Tevatron
The main mechanism for producing top quarks at the Tevatron is pair production via the strong interaction (electroweak production will be discussed in Section 7). annihilation accounts for about 85% of production with the remainder taken up by gg processes (see Figure 1). Calculations of the cross section [2] for TeV and = 175 result in pb. This represents an increase of approximately 30% with respect to Run I due to the larger center-of-mass energy.

Within the Standard Model the top quark decays to a bottom quark and a W boson nearly 100% of the time. Therefore, the final states that characterize production are determined by whether the W bosons decay hadronically or leptonically.111W decays to taus are only considered leptonic if the tau itself decays leptonically. Hadronic tau decays present their own difficulties and are usually considered separately. The main final states are
-
•
Dilepton (): The branching fraction for this final state is only about 7%, but the presence of two energetic leptons and large missing transverse energy () from the undetected neutrinos yields a clean event sample even without requiring explicit b-jet identification (“b-tagging”). The main backgrounds for this channel are Drell-Yan production, diboson production, and fake leptons.
-
•
Lepton + jets (): With a branching fraction of about 35%, this is something of a “golden mode” for production. The main background is the production of W bosons with associated jets, but after b-tagging good purity can be obtained.
-
•
All-hadronic (): This channel has the largest branching fraction (44%), but suffers from an enormous QCD multijet background. b-tagging is essential in this channel; however the purity of this final state is far worse than the channels with a lepton.
3 Detectors and Data Samples
The final states outlined above determine the requirements for a detector expected to do top physics. Good electromagnetic calorimetry and muon detection are required with as much reach in pseudorapidity () as possible. Well-calibrated hadron calorimetry covering as much solid angle as possible is necessary for good and jet energy resolution, and efficient b-tagging requires precision tracking of charged particles. All these considerations entered into the upgrade of the CDF and D0 detectors for Run II. In addition to complete upgrades of their trigger and data acquisition systems to cope with higher collision rates, both detectors augmented their central tracking systems with new silicon microstrip detectors and improved their forward muon identification capabilities. Also key to the top physics program were CDF’s new forward calorimeter system for improved electron identification, and a 2 T spectrometer magnet for charged particle momentum measurement at D0.
The Tevatron became operational in March 2001, and at conference time both experiments had about 400 of collision data on tape. Many of these data were obtained in 2004; the results presented here stem from data taken prior to a long accelerator shutdown at the end of 2003. The amount of data used typically ranges from about 150 to 200 , depending on subdetector quality requirements that vary from analysis to analysis.
4 Cross Section Measurements
Measuring the production cross section is a first step in any top physics program, as it establishes a baseline event selection and determines the amount of signal and background present in the sample. It is also an interesting measurement in its own right, as it provides a test of the Standard Model predictions for top production via QCD. Deviations from the SM could signal an exotic production mechanism (such as a heavy resonance) or a “contamination” of the sample from new physics processes. CDF and D0 have measured the cross section in a number of channels in a number of different ways; a brief overview of the techniques is given below.
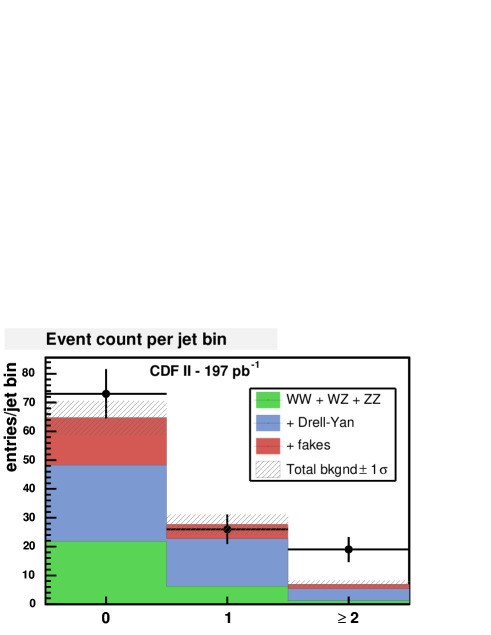
The cross section measurement in the dilepton channel is traditionally done as a counting experiment using events with two energetic leptons, large , and at least two jets. In order to increase acceptance, one can sacrifice some of the high purity of the dilepton channel by relaxing identification requirements on one of the leptons; one CDF analysis allows any isolated track to be considered as a “second” lepton. Figure 2 is a typical illustration of the counting method; the signal populates the high jet multiplicity bin and the lower multiplicities are used to cross-check background predictions. In addition to the counting experiments, CDF has employed a new technique wherein all events with two leptons are fit to the expected distributions from signal and background in the (,) plane, resulting in greater statistical power.
A variety of methods for measuring the cross section are available in the lepton+jets channel. By exploiting the long lifetime of bottom hadrons one can identify a b-quark jet by reconstructing a displaced secondary vertex or by counting tracks in a jet with large impact parameter. One can also look for “soft” leptons resulting from semileptonic b decays. The efficiency for tagging a jet in a event is typically about 50%; by requiring at least one tag a counting experiment can be done to extract the cross section. In lieu of requiring a tag, one can also exploit the large mass of the top quark; the jets in decay tend to be more energetic than those in the dominant W+jets background. By fitting the data to a discriminant variable such as the scalar sum of all objects in the event or to a multivariate kinematic discriminant such as the output of an artificial neural network, one can determine the fraction of in the W+jets sample and thus the cross section.
The background-swamped all-hadronic channel requires one to exploit both the top quark’s large mass and the presence of b quarks. In this channel CDF measures the cross section by counting the number of excess b-tags in a sample of events with at least six jets that are selected to have topologies indicative of the production of heavy t quarks. D0 extracts the cross section by fitting b-tagged multijet data to the output of an artificial neural network constructed from discriminant topological variables.
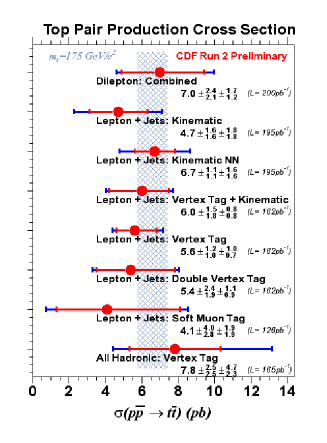
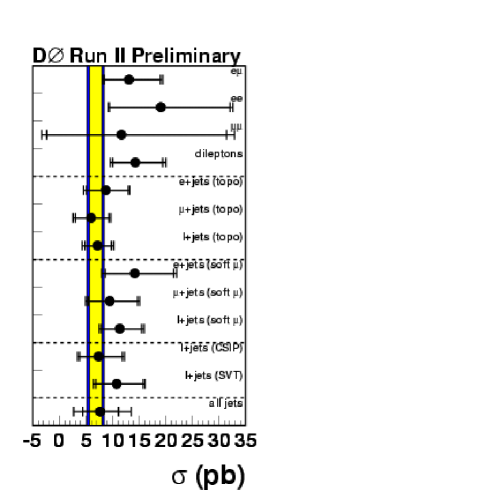
The results of the myriad cross section measurements are shown in Figure 3. Note that they are consistent across the different decay channels, between the two experiments, and with the SM expectation.
5 Mass Measurements
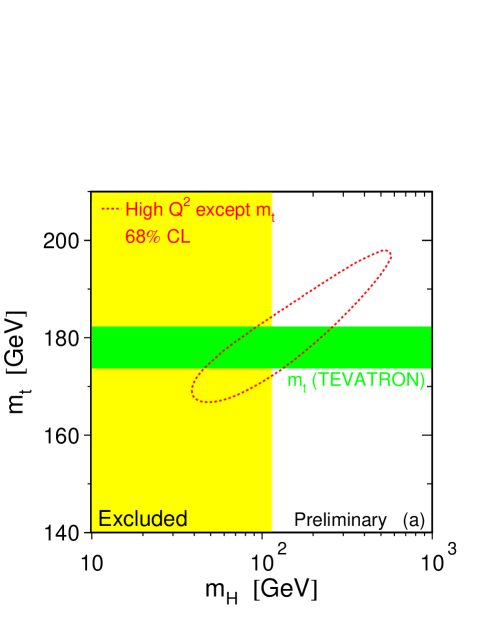
A precise measurement of the top quark mass is critical for experimentally testing the self-consistency of the Standard Model. Along with other precision electroweak measurements, it serves to constrain the possible values of the Higgs boson mass, as illustrated in Figure 4. Current global EW fits place a 95% CL upper bound on the Higgs mass of 237 [3]; the Run II goal is to further constrain the mass range by measuring the top mass to an uncertainty of 2–3 .
The current EW fits use as an input a new Run I average top mass value of . This new value is largely driven by a new analysis of D0’s Run I lepton+jets data that yielded an unprecedented single-measurement precision for the top mass [4]. This analysis assigned a mass-dependent probability to each event based on the event’s kinematical compatibility with the leading-order mass-dependent matrix element for production and decay. The probability-versus-mass curves for each event were combined (the sharpness of the curve effectively weighting each event) and the joint probability maximized to yield . The increase in statistical power using this technique is equivalent to a factor-of-2.4 larger dataset.
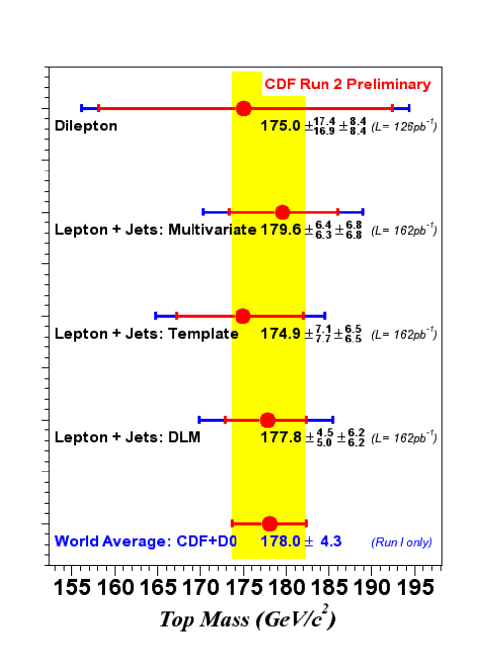
Measurements from large Run II datasets will soon be eclipsing the Run I results, however. CDF has performed several measurements of the top mass in the dilepton and lepton+jets channels using Run II data. These measurements have been done using traditional “template” methods, where one mass is reconstructed per event and the resulting mass distribution compared against template distributions from simulated events of varying masses. New techniques have also been employed, such as using multivariate templates and weighting events according to the probability for the chosen jet-parton assignment to be correct. An analysis based on probabilities formed from the matrix element, similar to the technique used for the D0 Run I data, yields the best measurement of the top mass in Run II: . The Run II mass measurements are summarized and compared with the Run I average in Figure 5. Nearly all top mass measurements are quickly becoming limited by the systematic uncertainty, the largest source of which is the uncertainty on the jet energy scale. Greatly improved understanding of the calorimeter response to jets will be the key to achieving a high-precision measurement of the top mass in Run II.
6 Properties of Top Decays
As mentioned in Section 2, top is expected to decay to Wb nearly 100% of the time. This assumption can be checked by examining various decay characteristics in detail; deviations from expectations could signal the presence of new particles in top decays, or that what is in the data isn’t really “top” at all!
6.1 Top decays to taus
The decay is all third-generation and is an excellent place for new physics to appear; for example supersymmetric models with a light charged Higgs and large could result in a large decay rate. However, most taus (65%) decay hadronically and are quite difficult to distinguish from a low-multiplicity parton jet. CDF has looked for top decays to hadronically-decaying taus in events where one top decays to an electron or muon. Two events are observed in 193 with 2.4 events expected from SM top and background. The branching ratio for top into tau is therefore determined to be less than 5 times the SM expectation at 95% CL.
6.2 Top decays to Xb
Consider the possibility that, instead of a W, tops decay into some particle X with branching ratio , and that X decays hadronically.222An example of such a particle would be a low-mass charged Higgs in certain SUSY scenarios. In that case the cross sections measured in the dilepton and lepton+jets channels would not agree. Therefore we can test for this possibility by taking the ratio of the dilepton and lepton+jets cross section; a value significantly different from unity could signal the presence of X. This has been done, using CDF cross section results older than those presented in these proceedings, yielding . Assuming the efficiency to detect X is the same as that for W, one can then set a 95% CL upper limit on at 0.46. Similarly, one can set a limit on , the branching fraction of top into a leptonically-decaying X, at 0.47.
6.3 Top decays to light quarks
Assuming three-generation unitarity, the CKM matrix element , implying that the ratio is nearly unity. One can use the ratio of single-tagged top events to double-tagged top events to measure if the b-tagging efficiency is known. CDF performs this measurement by dividing its lepton+jets sample into events with exactly three jets and four or more jets, and subdividing into single- and double-tagged events. These subsamples have different sensitivities to the product , where is the efficiency to tag a b-quark jet. The number of observed events in each subsample is used to form a likelihood as a function of . The most likely value of is then divided by the b-tagging efficiency to extract . The large uncertainties on this result can be readily improved by adding the information available in the zero-tagged data, as well as adding the dilepton channel.
6.4 Top dilepton kinematics
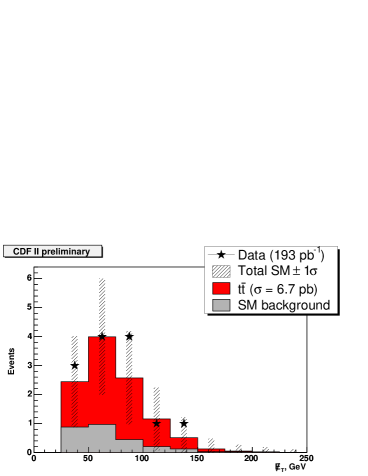
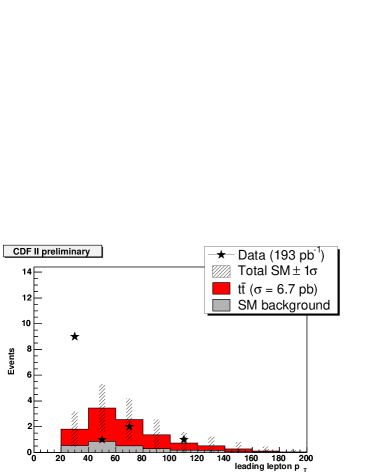
Several events in the Run I top dilepton sample were characterized by values of and lepton considerably larger than the expectations from SM top. In fact, it was suggested that the kinematics of these events were better described by cascade decays of heavy squarks [5]. In order to prepare for a possible continuation of this effect in Run II, CDF developed an a priori method to assess the consistency of the dilepton kinematics with the SM. A four-variable phase space was chosen; two of these variables are shown in Figure 6. No effects similar to those seen in Run I were observed; the data are quite consistent with expectations except for (ironically) a mild excess at low lepton . The probability of the data’s consistency with the SM in this phase space is in the range 1.0–4.5%; a detailed look at the low- events that drive this result point to a fluctuation of SM top as a likely interpretation.
6.5 W helicity measurements
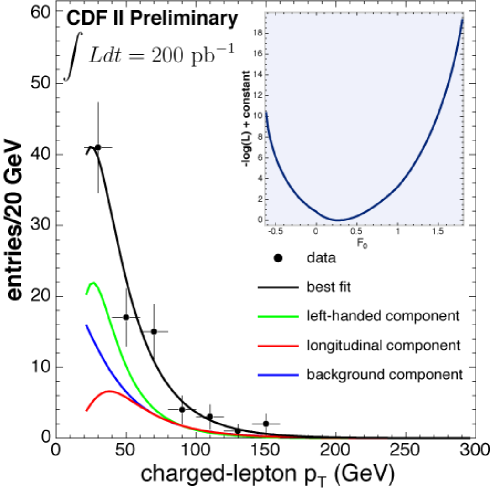
Measuring the helicity of the W in top decays allows one to test the structure of the electroweak interaction at high energies. Due to angular momentum conservation, tops decay only into left-handed (negative helicity) or longitudinally-polarized (zero helicity) W bosons. The fraction of longitudinally-polarized W bosons () is determined by the ratio of the top and W masses; the SM prediction is . The helicity of the W manifests itself in the kinematics of its decay products. There are several ways to exploit this; for example, the different helicity amplitudes give rise to different distributions in , where is the angle in the W rest frame made by the charged lepton direction and the W flight direction. D0 has measured from Run I lepton+jets data using a technique similar to that used to measure the top mass; for each event an -dependent probability is formed based on the event’s compatibility with the leading order matrix element expressed as a function of . The combined probability for the data sample is then maximized to extract . CDF has measured in Run II exploiting the tendency for the charged leptons to be thrown parallel to right-handed W bosons and anti-parallel to left-handed W bosons. This method allows one to use both the lepton+jets and dilepton samples in a fit to the lepton spectrum; see Figure 7. The measured is , about below the SM value. One expects this result given the observed excess of low- leptons in the dilepton channel noted above.
7 Search for single top
Top quarks can also be produced singly at the Tevatron via the electroweak interaction through the - and -channel processes shown in Figure 8. This production mechanism is of considerable interest since the rate is directly proportional to . However, the lepton+jets final states that characterize single top have lower jet multiplicities than for , and hence considerably more W+jets background. That coupled with the smaller cross section for single top (a factor of 2–3 less than [6]) has precluded observation of single top production so far. The cross section could be considerably enhanced, however, by the existence of a heavy or an anomalous tWb coupling. Therefore searches for single top are well underway at Run II.


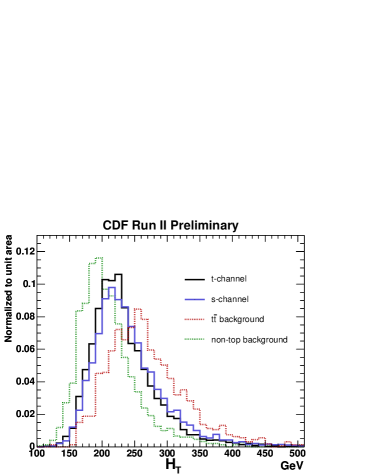
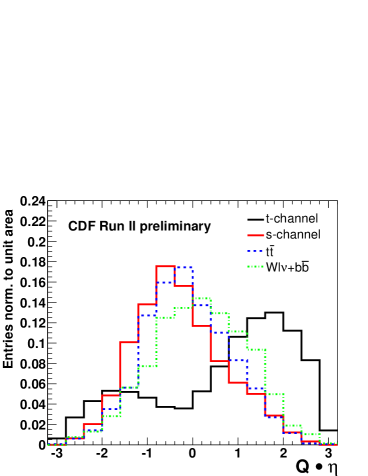
CDF has searched for - and -channel production of single top at Run II by selecting events with an energetic lepton, large , and two jets with at least one b-tag. These events are “sandwiched” between events at higher jet multiplicities and W+jets events at lower jet multiplicities, making a counting experiment extremely challenging. Therefore the strategy adopted is to fit the data to a distribution with some discriminating power between single top, , and other backgrounds. The scalar sum of all objects in the event () is one such distribution. The -channel provides an additional handle for separating out single top production; the direction of the forward jet in the event is highly correlated with whether a t or is produced, and hence with the sign of the charged lepton in the event. Therefore the product of the pseudorapidity of the forward jet and the sign of the lepton charge () tends to peak at large positive values for real -channel single top production. The expected distributions of these two discriminating variables are shown in Figure 9.
The CDF Run II data are shown along with the fitted contributions from single top and background in Figure 10. No significant single top signal is evident. From the fit, a 95% CL upper limit on the total - and -channel cross section can be set at 13.7 pb. Similarly, the fit yields an upper limit of 8.5 pb on the -channel cross section alone. Current projections estimate that 2 of data will be necessary to report observation of single top, if there is no enhancement of the cross section from new physics.


8 Conclusions
The Run II top physics program is well underway at the Tevatron. Many measurements have been re-established and there is much activity directed toward improving upon the techniques developed for Run I. Measurements of production cross sections, mass, and decay properties do not yet reveal any deviations from Standard Model expectations for the top quark; however, uncertainties on these measurements are still large and leave plenty of room for new physics processes to be uncovered. The anticipated large Run II datasets will allow for far more stringent tests of the top sector in the years to come.
9 Acknowledgments
The author would like to thank all the people in the CDF and D0 top groups (too many to name) whose work went into the results presented, and especially Arnulf Quadt for the assistance he provided in pulling together the D0 results.
References
-
[1]
F. Abe et al, Phys. Rev. D50, 2966 (1994)
F. Abe et al, Phys. Rev. Lett. 74, 2626 (1995)
S. Abachi et al, Phys. Rev. Lett. 74, 2632 (1995) -
[2]
R. Bonciani et al, Nucl. Phys. B529, 424 (1998),
updated in arXiv:hep-ph/0303085
N. Kidonakis and R. Vogt, Phys. Rev. D68, 114014 (2003) - [3] The LEP EW Working Group (http://lepewwg.web.cern.ch/LEPEWWG/)
- [4] V.M. Abazov et al, Nature 429, 638 (2004)
- [5] M. Barnett and L. Hall, Phys. Rev. Lett. 77, 3506 (1996)
- [6] B.W. Harris et al, Phys. Rev. D66, 054024 (2002)