TOP QUARK PRODUCTION CROSS SECTION AT THE TEVATRON
Preliminary results obtained by the CDF and DØ Collaborations on the top quark pair production cross-section in collisions at a center-of-mass energy of =1.96 TeV are presented. The measurements are obtained using various final states from top quark pair production and decays, and are based on data collected during years 2002-2004 of the Tevatron Run II.
1 Introduction
Since the discovery of the top quark by the CDF and DØ Collaborations , Tevatron remains the world’s only experimental facility where it’s properties can be investigated. In collisions top quarks are dominantly produced in pairs via strong interaction. Depending on the decay modes of the -bosons, one expects three distinctive event topologies from the signal: a di-lepton final state with 2 high- isolated leptons, 2 jets, and missing () from escaping neutrinos; a lepton+jets final state with a high- lepton, 4 jets and ; and an all-jets final state consisting of 6 jets. While the di-lepton channel gives the cleanest signal, it amounts to only 5% of the sample (considering only e and ), whereas the all-jets state constitutes 44% of the total fraction, but suffers from a huge QCD multijet background. The lepton+jets final state, forming 30% of events, is the best compromise between purity and the statistics.
At the Tevatron the top quark can also be produced singly, via electroweak interaction This mechanism has not been observed yet, and remains subject of active searches at the Tevatron .
a) b)
2 Di-lepton channel
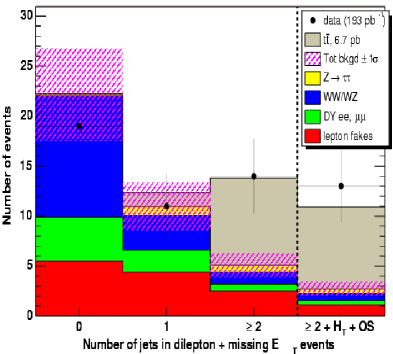
An unique signature of arises when both W’s decay leptonically producing a pair of high- leptons, large and two high- jets. The potential physics backgrounds to such a signature come from and events. Each of these can be produced with 2 associated jets and constitute significant background. Instrumental backgrounds arise from mismeasured in production and from fake lepton in events.
a) b) c)
CDF has used 200 pb-1 of data to select candidates in two complementary analysis. In one of the analysis both leptons are explicitly identified as either electron or muon. Events are selected applying basic kinematic cuts of GeV, 25 GeV, 20 GeV and total transverse energy of event GeV. Figure 1a) shows jet multiplicity distribution in the di-lepton events. Number of expected signal in 2 jets bin is 10.9 with 2.7 events expected from background processes, while 13 candidates are observed in data. The measured cross-section is pb. In another analysis, no explicit identification is required for one of the lepton. Instead, an isolated track is considered as a lepton candidate. Although this leads to a higher background contamination, it also gives higher signal acceptance. Furthermore, the selection is efficient for events with , - decays. The estimated cross-section in this analysis is pb.
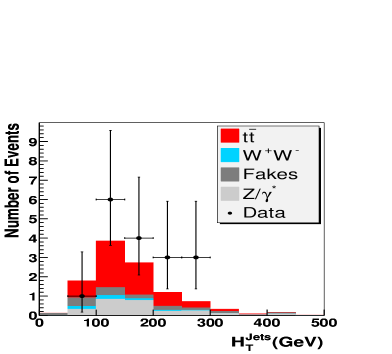
DØ has analyzed 156, 140 and 143 pb-1 integrated luminosities of data to select di-electron, electron-muon and di-muon events. Expected signal/background ratios in the three channels are 1.16, 0.32 and 3.96, respectively. 5 , 8 and 4 events have been observed in data. Figure 1b) shows distribution of the total sum of the jet transverse momenta in the selected events along with the signal and background contributions. The combined measurement for the three channels is pb.
3 Lepton plus jets channel
When one of the Ws from decays leptonically and the other to hadrons, the resulting final state contains a high- lepton, large and 3 or 4 high- jets. The background is dominated by and QCD multijet productions, with one of the jets faking an isolated lepton.
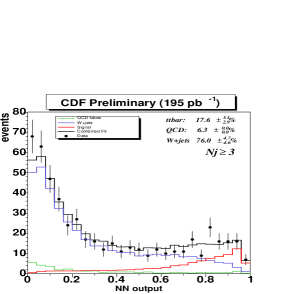
In 195 pb-1 of data CDF has selected 519 events with GeV, 20 GeV and three jets with 15 GeV. In order to separate signal from the background, various kinematic quantities have been combined into a Neural Network discriminant, and its distribution for the selected data events has been fitted to the signal and background shapes, Figure 2a). The extracted cross-section measurement is pb.
a) b) c)
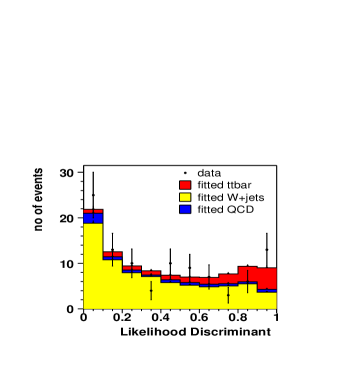
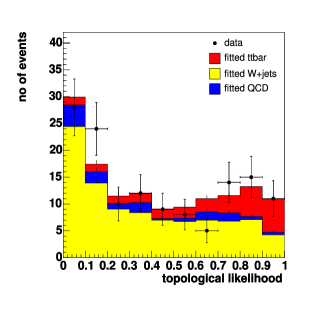
In a similar manner, DØ has combined topological variables into an event likelihood discriminant. The distribution of the discriminant for the 100 selected and 136 events are shown in Figure 2b) and c), together with the fitted contributions from the signal and background processes. The analyzed event samples correspond to luminosities of 144 pb-1, and 141 pb-1 for the two channels, respectively. The cross-section is estimated to be pb.
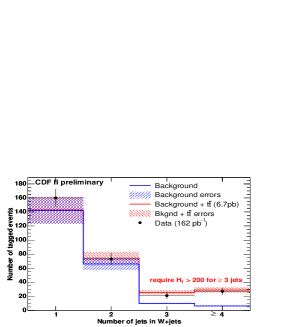
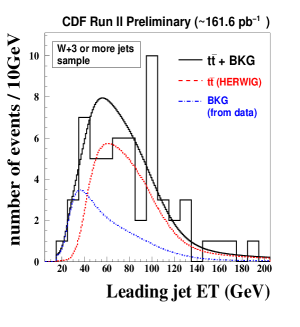
The decays contain two high- b-jets. B-hadrons are long lived, and when coming from top decays, they typically travel long distance, 3mm, which can be effectively resolved thanks to new Silicon Microvertex sub-detectors in both, CDF and DØ experiments. Applying b-tagging requirement in events substantially reduces contamination from and multijet processes. Figure 3a) shows jet multiplicity distribution in events obtained by CDF using 162 pb-1 of data. At least 1 jet is tagged as a b-jet. It can be seen that contribution from signal becomes dominant already in events with 3 jets. The measured cross-section in this analysis is pb. CDF has also devised separate analysis which makes use of event kinematic variables in order to extract the cross-section in b-tagged sample of events. Figure 3b) shows distribution of the leading jet . The fraction of events is extracted by fitting distribution of observed events to the expected shapes from signal and background processes. The obtained cross-section is pb.
In DØ two b-tag analyzes have been performed using 40 pb-1 of data. The analyzes use different techniques to identify displaced vertices from B-hadrons. They yield consistent cross-sections measurements of pb. and pb. Updated analyzes with much higher luminosity will become available in the nearest future.
Another way to identify b-jet is to make use of semileptonic decays of B-hadrons. The b-jet can be identified by presence of ‘soft’ muon inside a jet. While this is an efficient way of suppressing background, it also leads to relatively modest efficiency for signal events. Both, CDF and DØ have performed analysis applying soft muon tagging, and have extracted cross-sections of pb and pb, respectively.
4 All jets channel
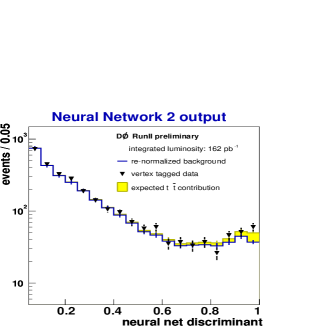
The most challenging of the three considered signatures from events is the one arising from Ws decaying to hadrons, and thus leading to events with 6 jets. Here the dominant background is QCD multijet production. The only efficient way to suppress this background is to employ b-tagging. DØ has used secondary vertex b-tagging and combined topological variables in 3 different Neural Networks at various stages of analysis. While outputs of 1st and 2nd Neural Networks are used to cut on, and thereby enrich sample in signal, the distribution of the 3rd NN discriminant is fitted to extract fraction of the events. Figure 3c) shows the distribution of the 3rd Neural Network discriminant for the selected 220 events from 162 pb-1 of data, together with the expected contribution from the signal and background processes. The obtained cross-section is pb.
5 Summary
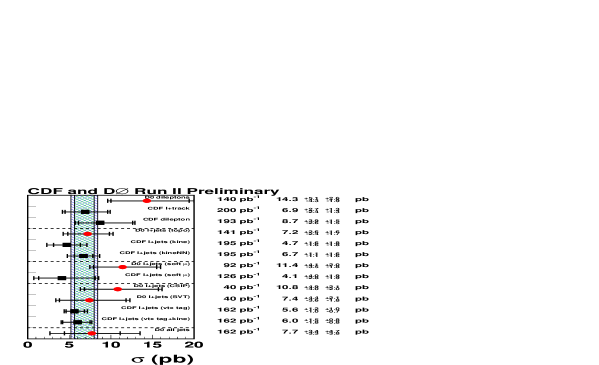
At the Tevatron Run II the top pair production cross-section has been measured by CDF and DØ Collaborations in a variety of final states. The datasets for most of the analysis are larger than those at the Tevatron Run I. The compilation of the results is given in Fig. 4, along with the recent theoretical calculations for at TeV. The measurements, while still limited in the statistics, are consistent with the Standard Model expectations.
References
References
- [1] CDF Coll., Phys. Rev. Lett. 74, 2626 (1995); DØ Coll., Phys. Rev. Lett. 74, 2632 (1995).
- [2] A. Juste, “Search for Single Top Quark Production and Measurements of Top Quark Decay Properties at the Tevatron”, This Conference.
- [3] N. Kidonakis, Int. J. Mod. Phys. A19, 1793-1822 (2004).
- [4] M. Cacciari et al, JHEP 0404, 068 (2004).