A Detector for Forward Physics at eRHIC
Feasibility Study
![[Uncaptioned image]](/html/hep-ex/0407053/assets/x1.png)
1 Introduction
Quantum Chromodynamics is now widely acknowledged to be the correct theory to describe strong hadronic interactions. Knowing the correct Lagrangian for the theory does not, however, imply that we know everything we want to know about the strong interactions. Experimental observations such as the confinement of color or the energy dependence of scattering cross sections cannot today be predicted from the QCD Lagrangian. These are striking results which should be calculable from first principles if we are to claim to understand our universe.
It has been proposed to build an electron accelerator at the Brookhaven National Laboratory [1] to allow electron-proton and electron-ion collisions. The electron beam would intersect the existing RHIC accelerator at one or more locations. The research program which would be made possible with such an eRHIC facility is of great scientific interest, and it would certainly push our understanding of strong interactions to a completely new level.
The world of small-x physics has been opened up by the HERA accelerator in Hamburg, Germany, and it is clearly fascinating and full of surprises. We now know that understanding electron-proton collisions is dependent on an understanding of the gluon sea. Unexpected effects such as large diffractive cross sections were observed, which can only be understood as the correlated exchange of multiple gluons. With eRHIC, it will be possible to study the role of gluons in electron-ion collisions, and to understand whether hadronic matter and its interactions at high energies is fundamentally described by a gluon condensate (the Color Glass Condensate [2]). The CGC is expected to provide a universal description of hadronic matter at small distances, and its discovery would revolutionize particle physics.
The large-x measurements will open up completely new territory. In this regime the electron scatters off the valence quarks of the proton. The distribution of valence quarks has not been measured above x=0.75 at large and new surprises may await us.
The fundamental measurements mentioned here require the extraction of inclusive cross sections (the details of the hadronic final state are not analyzed), i.e., structure functions. This document describes studies of a detector optimized for structure function measurements in the small-x and large-x regimes. The same detector would obviously be capable of making very precise measurements of semi-exclusive and exclusive reactions, but these processes have not been studied in detail. Rather, we refer to a Letter of Intent submitted to the DESY PRC for further experiments with the HERA accelerator where these topics are covered in more detail [3].
The outline of this document is as follows: we first review the structure function measurements which have motivated the new detector design and follow this with a description of the resulting detector. Detailed simulations of the performance of the detector are presented, and, finally, we show the range and precision of structure function measurements which could be extracted with moderate amounts of luminosity. The studies were all performed for electron-proton scattering, but the results carry over to electron-ion collisions as well.
2 Precision structure function measurements
111We would like to thank Halina Abramowicz for providing most of the text in this section.The measurements of the , and structure functions of the nucleon were instrumental in discovering the point-like nature of hadron constituents, quarks and gluons, in establishing QCD as the theory of strong interactions and in determining the value of the strong coupling constant.
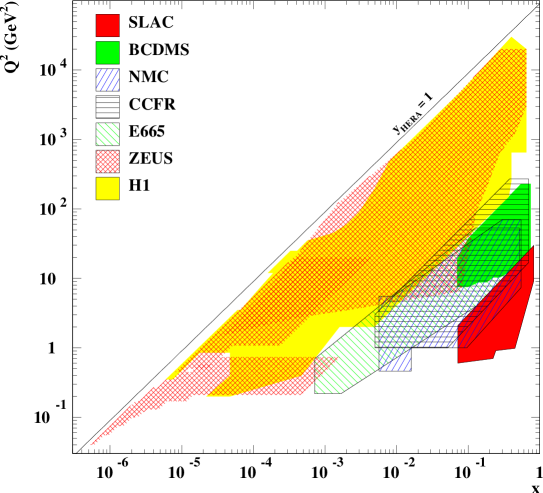
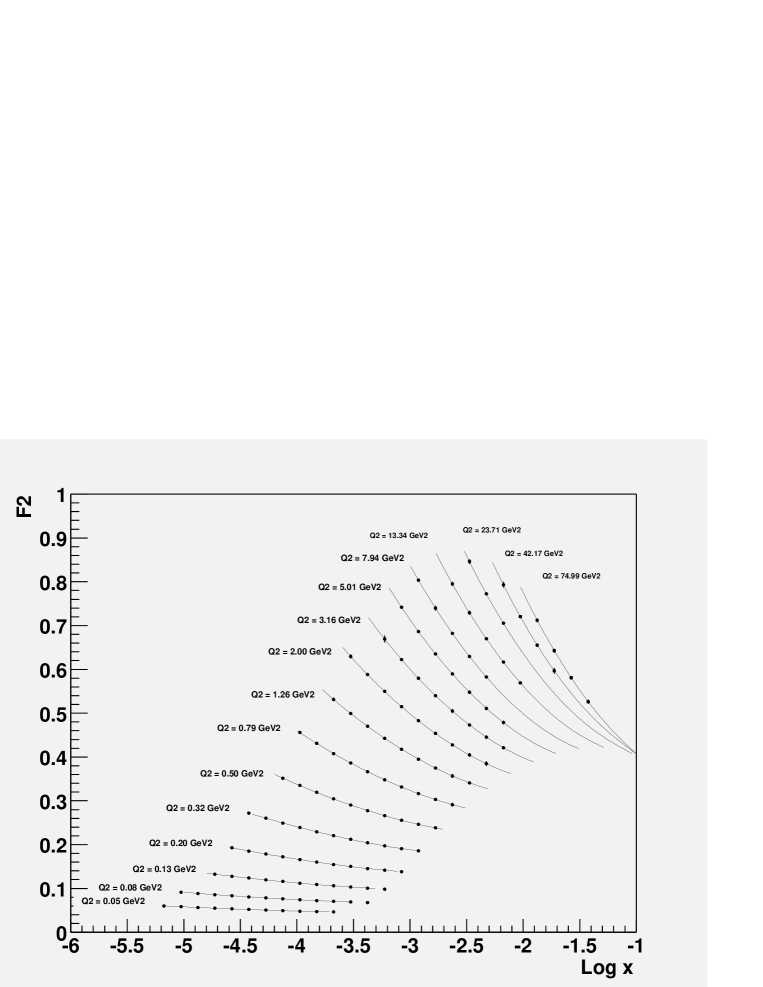
Today, the measurements of cover a large phase space in Bjorken and , as shown in Fig. 1, and are used to determine a universal set of parton densities to be used for predicting and calculating processes in phase space regions within and beyond the probed space. The conventional approach is to postulate the dependence of parton densities at some fixed and to fit the shape parameters, so that the parton densities evolved through the DGLAP evolution equations reproduce best the data. There are many unknowns in this procedure. In particular
-
•
the shape of the parton densities cannot be derived from first principles,
-
•
the scale at which the perturbative evolution can be safely applied is not known,
-
•
there is no prior knowledge when to stop the perturbative expansion of the splitting functions and the corresponding coefficient functions entering the DGLAP formalism.
Using the NLO DGLAP evolution equations, the shape parameters can be fitted very well to the data, down to values as low as [4, 5, 6]. However, at low values, the solution [4, 5] requires a negative gluon density at low . While it may be disputed whether unobservable gluon densities can be negative, , as a physical observable, has to be positive. For DGLAP fits which include measurements of high transverse momentum jets at the Tevatron [7, 8], and therefore require larger gluon content at high , negative values for appear already at . This puts in doubt the validity of the DGLAP formalism in this low and low region. Moreover, it becomes apparent that a good fit to the data does not guarantee the applicability of the DGLAP evolution equations, at least in NLO. This is especially true in the low region, where the lever arm in is small.
One striking experimental result from HERA is the observation of a transition in the behavior of at GeV2. The dependence of at fixed can be directly related to the energy dependence of the photon-proton cross section. Below GeV2 the virtual photon-proton cross section has a very similar energy dependence to that seen in hadron-hadron scattering. Above this , the cross sections show a steeper energy dependence. The location of this transition is particularly interesting, as it is near the perturbative regime, and far from the scale set by the dimensions of the proton.
At the other end of the scale, , higher twist effects are known to play an important role. At higher twist contamination plays a role up to of about and is simply parameterized in the fit procedure. The large region is important in the momentum balance of the parton densities, and, via sum rules, affects the densities extracted at small . This interplay affects the determination of from the evolution of . The region of large is important in the calculation of moments of parton distributions which can be directly compared to lattice calculations.
Importance of
At low and relatively low , there are various dynamical arguments why the NLO DGLAP conventional approach may fail. At low , higher order perturbative corrections may become important and possibly the fixed-order perturbative expansion in the strong coupling constant may become inadequate [9, 10]. Present measurements alone are not sufficient to address these issues. One of the main reasons is that in the analysis there are only two experimental inputs, and . They allow to determine quark and gluon densities, provided the theoretical framework is fixed. The latter can only be checked if other observables are available. Such an observable is the longitudinal structure function.
The effect of using the DGLAP evolution equation at LO, NLO and NNLO for extraction of the gluon density and for the calculation of the corresponding [10] is shown in Fig. 2.
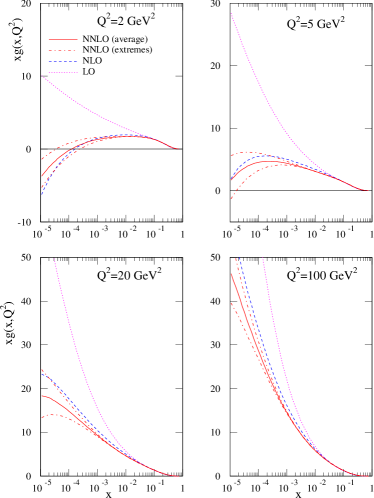
The effects are quite dramatic especially at low .
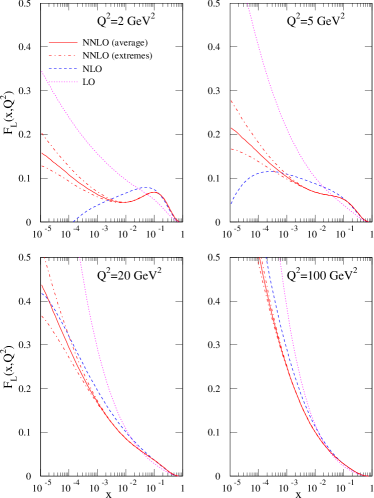
The proper treatment of heavy flavor production in the low regime is very important [11]. Various schemes have been proposed and their predictions for the charm contribution to , , agree to within few percent. However, the variations for the expected are very large, as shown in Fig. 3.


In the region where rises steeply with decreasing , the parton densities are large and one might expect coherent effects, such as multi-parton interactions, leading to saturation (shadowing) effects in the interaction cross section of the virtual photon with the proton. The observed copious presence of diffractive events in the DIS regime could be one of the manifestations [12]. There are theoretical arguments for the presence of higher twist effects, positive for and negative for (), that would approximately cancel for [13], invalidating however the leading twist DGLAP approach. The dipole model of DIS [14], in which the photon fluctuates into a pair before interacting with the proton, in a realization proposed by Golec-Biernat and Wuesthoff [15], seems to have all these dynamical properties and will be used as a reference. The comparison between the NLO calculations of and the calculation of in the dipole model is shown in Fig. 4. Also shown are the present measurements of by the H1 experiment [16].
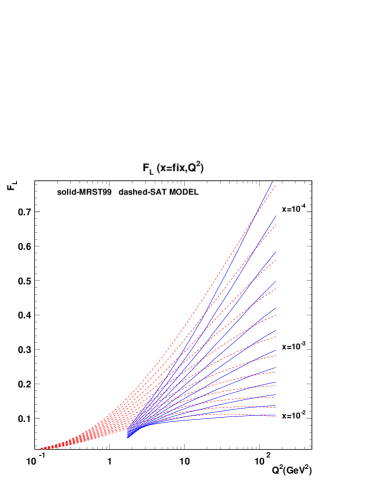
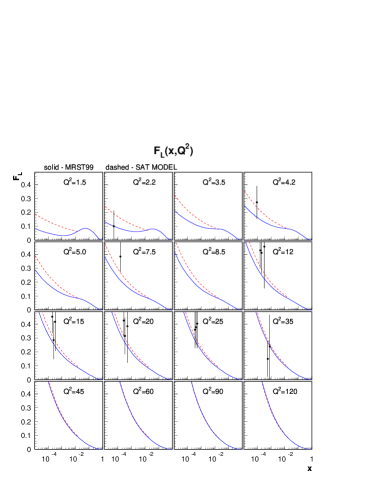
The differences are indicative of the contribution of positive higher twists in . The most striking difference is in the dependence of at fixed , where with adequate measurement precision, it should be possible to distinguish even between the NNLO and the dipole model expectations.
at small and large
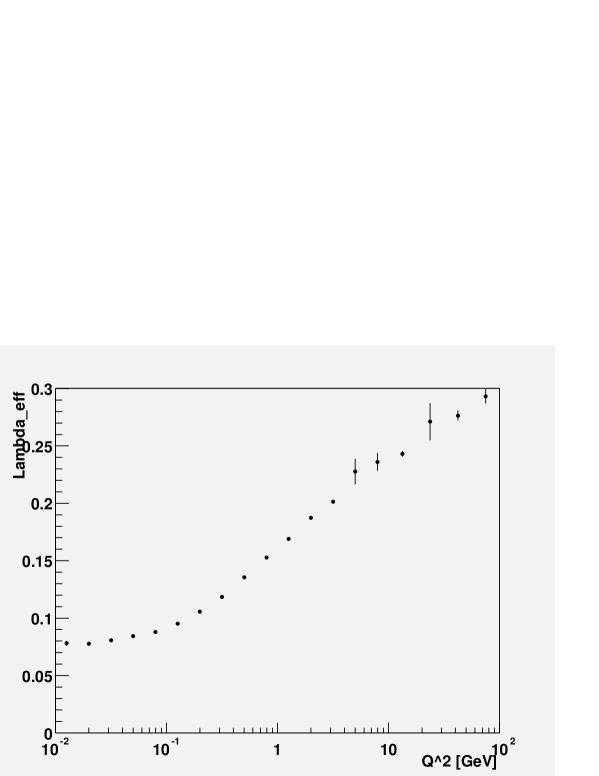
One of the important parameters in the study of high energy processes is the logarithmic derivative of , defined as
Its value is related to the contribution of soft and hard dynamics in the (virtual) photon-proton interactions. The value of extracted from the small () HERA data is shown in Fig. 5. The present data point to a transition around , where, for smaller values of , the data are compatible with the equivalent quantity measured in hadron-hadron scattering. The energy dependence of hadron-hadron scattering is dominated by non-perturbative physics and has never been satisfactorily explained. On the other hand, the high HERA data follows the expectations from perturbative QCD calculations using the DGLAP formalism. The HERA data therefore span the kinematic region where a transition from a partonic description to a hadronic description of photon-proton collisions is observed. A detailed study of this transition region could lead us to an understanding of fundamental non-perturbative QCD phenomena at work in hadrons.
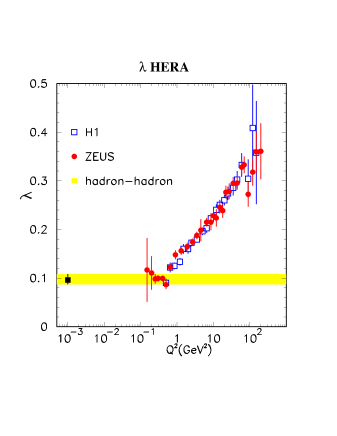
The quality of the existing data in the transition region is not as high as in other regions, because this corresponds to a geometrical location for the scattered electron where the H1 and ZEUS detectors have very limited acceptance. A detector dedicated to this region could make much higher precision measurements in an extended kinematic range.
No measurements of are available for in the large region, where higher twist effects are likely to disappear. The non-perturbative corrections to at large are expected to scale like [17]. If this claim can be verified by performing measurements up to the highest values, this would give a very important handle on the parton densities at large . The current H1 and ZEUS detectors are only able to measure large-x events at very high , i.e., with small statistics. The main limitation is the acceptance of the detector to very forward jets. A new detector, designed with this physics in mind, would be capable of extending the large-x measurements to much lower , thus allowing for significant event rates and the ability to extract precision cross sections.
Structure Functions and the Color Glass Condensate
The Color Glass Condensate [2], CGC, represents a new way to look at hadronic matter. It is known that QCD predicts the gluon density to increase steeply at small-x as increases. However, it is not possible to calculate the gluon density in a hadron from the QCD Lagrangian. The CGC approach starts from the concept that hadrons are represented by collections of gluons in a saturated (maximal number density) state. The number density defines a distance scale, and thereby a saturation scale, . The variation of this scale with is predicted by the CGC, and the current excitement lies in the belief that the saturation scale may have already been seen in the HERA data. The HERA results are consistent with a CGC with GeV for , but the existence of the CGC is not proven [19]. What is needed are data beyond that which HERA has delivered, either in an extended range or with different targets. Of greatest importance are inclusive cross section data for ep and eA scattering. The CGC makes predictions on the behavior of the structure functions as A varies, and these could be tested with an electron-ion collider. Other important tests of the presence of the CGC would come from semi-inclusive and exclusive measurements.
An example of a semi-inclusive measurement is the study of hadron production and correlations among hadrons as a function of momentum and rapidity for fixed electron kinematics (). The presence of the CGC would yield different patterns than expected from standard fragmentation approaches. These studies require large rapidity acceptance and good momentum resolution for the hadronic final state.
Exclusive measurements, such as or , where represents a vector meson, allow to test the radial profile of hadronically interacting matter. A full three-dimensional reconstruction of the nucleon (nucleus) is then possible. Extracting the scattering amplitude for virtual photons on nuclear targets would directly test whether the saturation regime has been reached. These types of measurements require the maximum rapidity coverage for the outgoing vector meson or photon, good momentum and energy resolution, and the means to verify that the scattered proton remains intact.
Required precision
To validate the universality of parton densities derived from the HERA data, has to be measured in the region of with a precision of about . This would allow to distinguish between the various theoretical approaches at a level.
The precision achieved in the measurements of at HERA has reached about . This leads to an error of of about for . In the transition region of interest, . Therefore, all efforts should be made to measure at low with a precision better than .
At large , the goal is to push the measurement beyond for values in the DIS regime. The accuracy should be better than % to be sensitive to novel effects.
For more detailed tests of our understanding of QCD and the possible presence of the CGC, it is important to measure the hadronic final state over the largest possible rapidity range. We set as a goal to have momentum analysis of particles in the range .
3 Summary of measurements and requirements
3.1 Summary of measurements
In summary, the following measurements are seen as the highlights of the proposed program:
-
•
The high precision measurement of at low x from GeV2 to GeV2 to better understand the observed transition of the cross sections from hadronic to partonic behavior.
-
•
The measurement of the longitudinal structure function, , particularly at values below GeV2, where present theoretical and experimental uncertainties are very large.
-
•
The measurement of forward jets and forward particle production up to pseudorapidities of at least to test in a direct way our understanding of parton branching in strong interactions and to see the onset of collective phenomena. Acceptance for forward jets will also allow the measurement of to at moderate .
-
•
The measurement of diffractive and exclusive reactions (VM production and DVCS) over the full range, and to values of GeV2, with no proton dissociation background, to perform a three dimensional mapping of the proton and perform first extractions of generalized parton distributions.
All of the above measurements should be performed with protons and with at least two nuclear targets to search for the gluon condensate, and understand nuclear effects in parton distributions.
3.2 Accelerator requirements
The luminosity requirements for the e p program are set by exclusive cross section measurements at high , measurements near , and by the measurement. For the latter we anticipate requiring data sets with at least two different proton energy settings (e.g., GeV), and preferably with three or four. A luminosity requirement of approximately pb-1 at each energy is anticipated. The measurements near will be statistics limited for luminosities below 100 . First interesting measurements in a new kinematic domain will already be possible with pb-1. High- exclusive processes have not been studied in detail with this detector design. However, using a parametrization of exclusive meson production at HERA [20], it was determined that fb-1 would yield elastic rho events in the interesting kinematic range GeV, GeV2 and GeV2. This would be a minimum requirement for an extraction of a three dimensional cross section (in ) at high , which corresponds to small proton (nucleus) impact parameters. Summarizing these requirements, we find that a luminosity at the level of cm-2s-1 with an active time of s/year would satisfy the minimum requirements for all the measurements above except for structure function measurements at the very highest .
The luminosity required for the e A program has been estimated at pb-1 per nucleon [21]. We have not investigated eA measurements in this study, and so take this figure at face value. Finally, we do not anticipate needing positron beams - electron beams will suffice - since we are concerned primarily with the region where photon exchange dominates.
This study does not focus on beam polarization. However, it would of course be very desirable and allow for a broadened physics program.
3.3 Detector requirements
The main focus of the detector design is large angle coverage. Emphasis is put on forward/backward physics, which distinguishes the design from typical HEP experiments such as the existing H1 and ZEUS detectors. The measurement of FL and F2 at small Q2 ( GeV2) requires the tracking and identification of scattered electrons with energies between 1 GeV and 10 GeV up to high rapidities.
The rapidity range is extended by a dipole field that separates lower energy scattered electrons from the beam. In the electron hemisphere tracking and identification require
-
•
high precision tracking with
-
–
p/p of 2 %
-
–
angular coverage down to a pseudo-rapidity of -6 over the full energy range
-
–
-
•
em calorimetry with
-
–
an energy resolution of better than 20 %
-
–
e- separation with a pion rejection factor of at least 20 at 90 % efficiency over the electron energy range from 1 GeV to the beam energy of 10 GeV.
-
–
Another focus of the program is the study of forward jets, high- events, and exclusive processes. This leads to the following additional requirements for the proton hemisphere:
-
•
high precision tracking with
-
–
similar precision in the proton hemisphere as in the electron hemisphere
-
–
similar angular coverage up to a pseudo-rapidity of 6
-
–
-
•
em and hadronic calorimetry in the proton hemisphere with
-
–
an em energy resolution of better than 20 %
-
–
a hadron energy resolution of better than 50 %
-
–
e- separation with a pion rejection factor of at least 10 at 90 % efficiency above GeV energy.
-
–
4 A detector designed for forward/backward physics at eRHIC
4.1 Detector concept
The main idea is to build a compact detector with tracking and central em calorimetry inside a magnetic dipole field and calorimetric end-walls outside. To keep the magnetic volume of reasonable size, the design limits the detector radius inside the magnet[s] to a radius of 80 cm. The coordinate system has the z-axis parallel to the proton beam, the x-axis horizontal and the y-axis vertical. The electrons thus point towards negative z.
The tracking focuses on forward and backward tracks. The calorimetry is to show the best performance in the central region where momentum measurements are intrinsically less precise due to the field configuration and thus e- separation is more difficult. Tracking for is currently not foreseen.
The detector presented here is an adaption and optimization of the detector which was proposed for an extension of the HERA program [3].
4.2 Interaction region
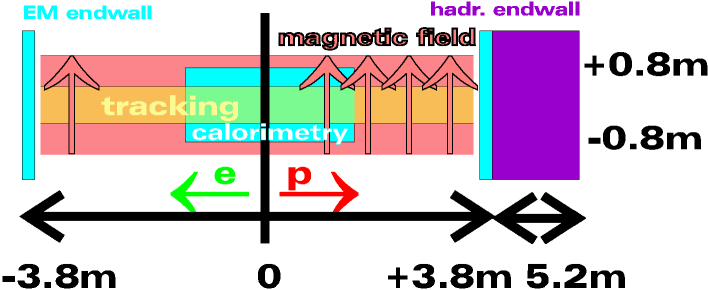
The interaction region is characterized by the presence of the detector dipole field which has to become part of the machine lattice. Other machine elements cannot be incorporated inside the detector, because they would reduce the acceptance for scattered particles. Fig. 6 shows a block diagram of the interaction zone. The first machine elements are placed outside the area from -3.8 m to +5.2 m. Longitudinal space for cabling and support is included in each block. In x and y there are a priori no restrictions, so that the endwalls can have their complete infrastructure outside.
The dipole magnet causes the electron beam to create a strong synchrotron radiation fan. This is reduced by a longer magnet with a weaker field. However, the distance between the interaction point and the first quadrupole cannot be arbitrarily large, as the quadrupole aperture has to contain the synchrotron fan. The current machine studies for eRHIC envision an electron ring or an electron linear accelerator as the source of leptons. For the ring option also luminosity considerations limit the distance to the first quadrupoles.
The 7 m long field indicated in Fig. 6 requires a large aperture quadrupole in the electron direction. The width of the radiation fan could be significantly reduced by a split field. The magnetic field orientation would be opposite in the electron and proton hemispheres. A small area around the interaction point would be “field free”. This solution was chosen for the proposed detector at HERA, because the higher electron energy at HERA required a substantially longer magnetic field of 9 m. For eRHIC the single field option would, however, be easier to integrate into the machine lattice. A single dipole field is also favorable from the analysis point of view, because a split field magnet would add significant complications to the reconstruction process.
The integration of the detector and its field into the machine lattice will be a crucial point in future studies. The synchrotron radiation fan will require excellent masking. In addition detailed studies of beam-gas backgrounds will be needed.
4.3 Beam-Pipe
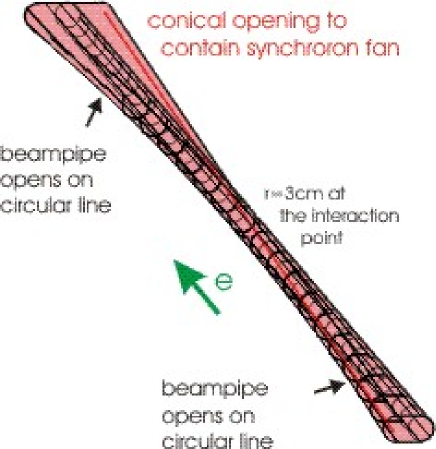
The beam-pipe currently envisioned is depicted in Fig. 7. Vertically the radius is fixed to 3 cm. Horizontally it follows the circular path of the electron beam on one side and opens up conically on the other. The electron beam follows an orbit with a radius of 110 m inside the dipole field. At a distance of 350 cm from the interaction point this requires and additional opening of the beam-pipe by 5.6 cm, adding to a total radius of 8.6 cm.
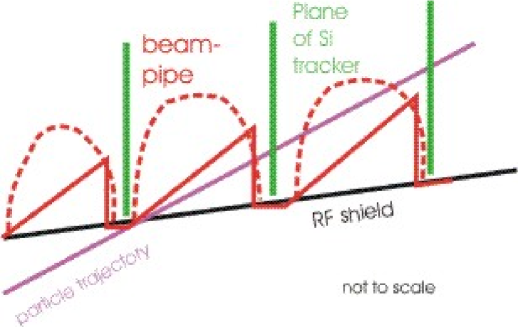
At the moment the material assumed is aluminum with a wall thickness of 0.5 mm. This is not quite realistic for such a large beam-pipe, but it serves as a reasonable start for the optimization of the design and is used in performance studies. The central part of the beam-pipe could be manufactured in beryllium to reduce material. The forward parts where particles traverse the pipe at shallow angles can undergo geometric optimization. Two possible design options are depicted in Fig. 8. These types of designs introduce the additional complication of RF-shielding. It is also possible to integrate a full Roman pot system like the one used in HERA-B [22]. This would, however, make the construction significantly more complicated and expensive.
As beam-gas events will be a severe background, the quality of the vacuum will be of utmost importance. Therefore we envision to integrate ion-getter-pumps into the beam-pipe. In case of a split field magnet configuration the beam-pipe would not need an extra conical opening for the synchrotron fan. The smaller volume would reduce the pumping capacity needed.
4.4 Tracking System
The precision tracking required translates into hit resolutions of less than about 50 m. This makes silicon strip detectors an obvious choice of technology. As the material budget will be important, double-sided detectors are desirable. A read-out-pitch between 50 m and 100 m will be adequate. Two double-sided detectors with appropriate stereo angle design can yield unambiguous space-points. For the baseline design we assume silicon tracking stations with two double-sided, 300 m thick silicon strip detectors and support structures with material equivalent to 1.2 mm of carbon fiber. This results in stations with a material budget equivalent to 1 % of a radiation length X0.
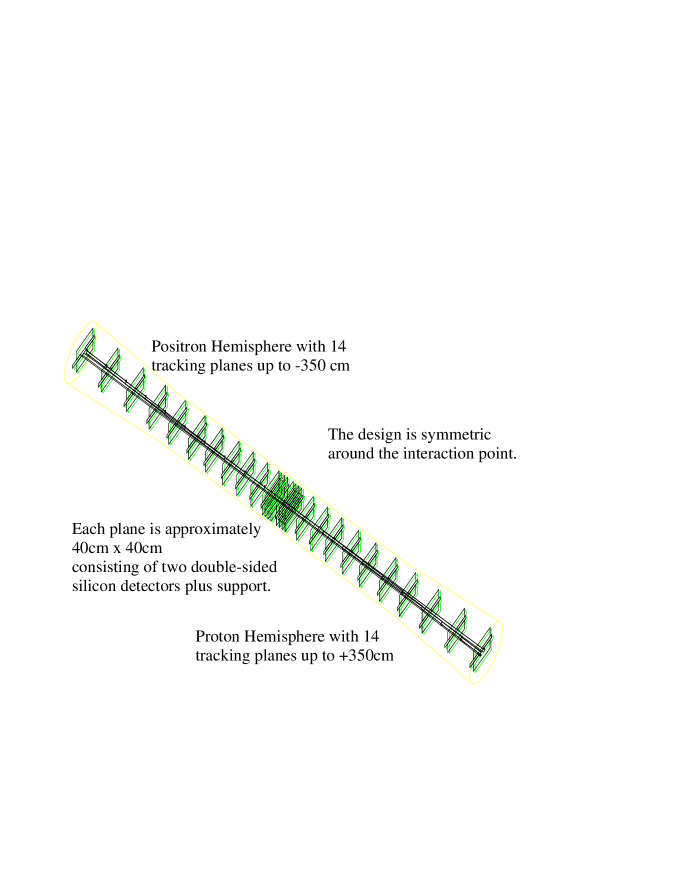
Figure 9 gives an overview over the design. The complete tracker is composed of planes oriented perpendicularly to the beam. The planes are centered around the proton beam line and measure approximately 4040 cm2. They have a central cut-out that follows the beam-pipe design. Each plane is composed of a top and a bottom half and two horizontal plugs that are adjusted to the required cut-out. The positioning of the planes was optimized for acceptance and momentum resolution. Each hemisphere features 14 silicon planes. The silicon plane furthest from the interaction point starts at z = 3.5 m. Close to the interaction point the planes are relatively densely packed; they are used to track low momentum tracks with a large curvature and tracks with pseudo-rapidities less than 1. Further out the planes have larger distances to enhance the lever arm for tracking particles with higher momenta.
4.5 Calorimetry
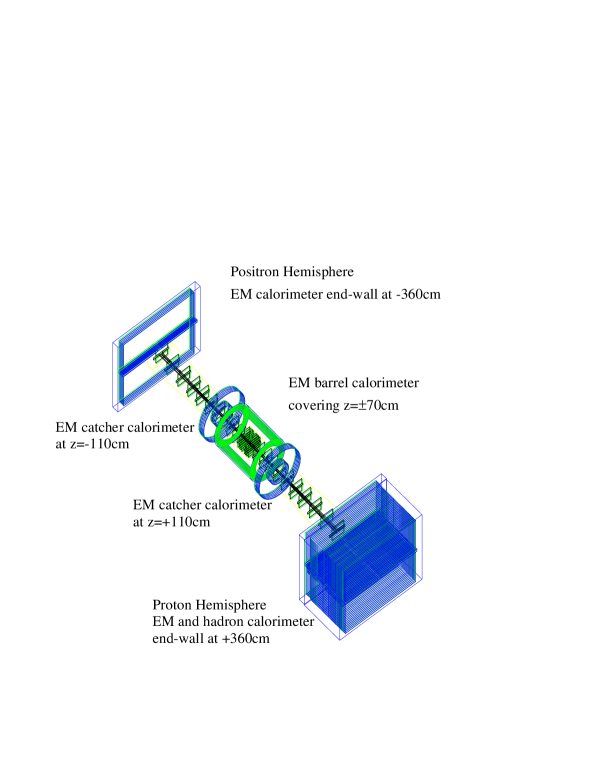
Over most of 4 only electromagnetic calorimetry is required. The goal of a compact detector leads to silicon-tungsten as the choice of technology. It is assumed that the magnet starts at r = 80 cm and in order to leave sufficient space for support and cabling any barrel structure inside is confined to a tube with a radius of 60 cm. In order to cover 4 in an elongated design, multiple structures have to be adapted. Figure 10 shows an overview over the full detector, Fig. 11 depicts the side view of the central region.
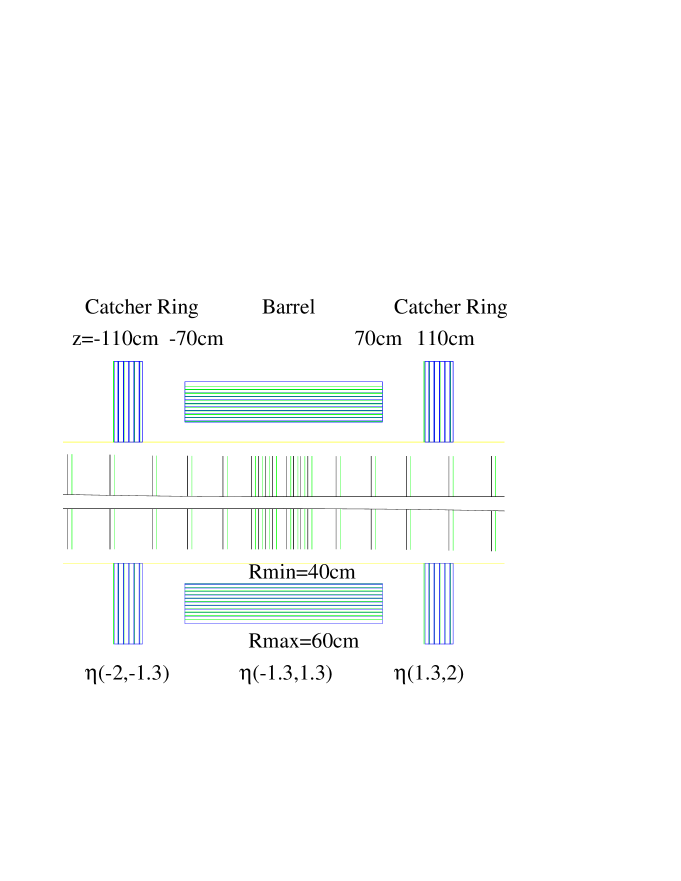
The central region in pseudo-rapidity [] is covered by a barrel structure with an inner radius of 40 cm. It extends to 70 cm in z. For a simple, non pointing layer geometry this results in a doubling of the path-length through a layer for a particle coming from the interaction point and hitting the end of the barrel, as compared to a particle impacting the calorimeter at 90o. The tungsten layers have a thickness of 1.75 mm, which is equivalent to half a radiation length [X0] per layer. For particles hitting the end of the barrel the effective layer thickness is 1 X0. There are 50 layers resulting in an overall thickness of 25-50 X0. The active medium consists of 500 m thick silicon pads. The pad [cell] size will be 1 cm1 cm and there will be three longitudinal sections. The segmentation will be discussed in the context of e- separation.
High pseudo-rapidities, , are covered by end-walls. The aperture of the dipole magnet limits rapidity coverage of the end-walls. Therefore, the intermediate range in rapidity is covered by “catcher rings”. Their absorber plates are perpendicular to the beam-line and cover radii from 30 cm to 70 cm. A catcher is placed on each side of the interaction point. They start at z=110 cm and cover the pseudo-rapidity ranges from 1.3 to 2.0 with some reasonable additional overlap of about 10 % of a unit in pseudo-rapidity. Both catchers and the end-walls have tungsten absorber plates of 3.5 mm, i.e.1X0, thickness. They have 25 layers and again silicon pads of 500 m thickness as active elements.
In the proton hemisphere an additional uranium-scintillator calorimeter is deployed to provide hadronic calorimetry. The design follows the hadronic part of the existing ZEUS calorimeter with 160 uranium absorber plates, each 3.3 mm thick, providing 5.3 interaction length. Each uranium plate has 0.4 mm steel cladding which provides and additional 0.4 interaction length. The lateral granularity is 10 cm 10 cm. The complete assembly is 1.4 m thick with 5.7 interaction length absorber strength. The uranium-scintillator option is chosen because of its compact design and its proven compensating nature. The combined use of a silicon-tungsten electromagnetic section and a uranium-scintillator hadronic calorimeter has not been studied in detail and may not be optimal. For the purposes of this study, the performance of the ZEUS calorimeter has been assumed.
4.6 Forward and backward detectors
Three devices along the electron and proton [ion] beam-line are foreseen:
-
•
a photon calorimeter along the electron beam direction,
-
•
a proton remnant tagger,
-
•
a zero degree neutron detector.
As the machine lattice for a possible eRHIC collider is not yet defined, it is impossible to precisely place the instruments or study their performance. In the letter of intent for an extension of the HERA program [3] more details can be found. Here only the basic requirements and usages are outlined.
The photon detector at zero angle with respect to the lepton beam direction will cover about 1 mrad of the polar angle. The purpose of the detector is:
-
•
measurement of the luminosity through the observation of bremsstrahlung photons,
-
•
lepton beam diagnostic,
-
•
tagging and measurement of events with initial state radiation (ISR).
The device will be an electromagnetic calorimeter placed well beyond the separation of the electron and proton [ion] beams. It will need a shield against the low energy Bremsstrahlung photons due to the dipole field and other bending magnets. A quartz-fiber calorimeter [23] is one possible solution for the high-radiation environment the device has to operate in.
The proton remnant tagger will cover the range between approximately 1 mrad and 10 mrad. The purpose of the device is:
-
•
tag events in e p collisions where the proton stays intact in order to measure cross-sections of diffractive and exclusive processes,
-
•
study proton dissociation.
The device will consist of a high density hadron calorimeter for energy measurements and a [silicon] tracker to study multiplicities and provide spatial information. It will be located beyond the electron and proton [ion] beam separation. The measured energy and multiplicity will be used to distinguish between proton-dissociative and elastic reactions at large . It is expected that for GeV2, the elastically scattered proton will enter the detector. The measurement of the impact point of the scattered proton will help in the reconstruction of the variable for DVCS and Vector Meson production with non-negligible values of .
The zero degree neutron detector compliments the proton remnant tagger by identifying neutrons below approximately 0.5 mrad. The purpose of the device is:
-
•
study proton dissociation.
-
•
tag spectator nucleons in e d collisions.
-
•
measure the centrality of interactions for eA collisions.
The device will consist of a hadron calorimeter placed at the location where the neutrons will leave the beam-pipe. This will most likely be further away from the interaction region than the location of the proton remnant tagger. It is foreseen to complement the neutron detection with a device to identify protons of low energy on the other side of the beam-line.
5 Monte Carlo
Detector simulation:
A full GEANT3 simulation of the detector described in the previous section was set up to study the detector performance and the physics reach of the experiment. Interactive GEANT was used embedded in “atlsim” [24], a tool developed for ATLAS 222Special thanks to Denis Salihagic and Pavel Nevski for their help setting up the simulation.. For historical reasons the simulation uses a positron beam and a split magnetic field without any field free region in the center. This is an unphysical field which is, however equivalent to the homogenous long field as decribed in section 4.2. The beam-pipe simulated does not have a conical opening, but follows the positron beam on both sides of the interaction point.
Three material budgets are used in the detector simulation. They are listed in tab. 1. These assumptions do not correspond to real technical designs; they are merely used to study the influence of material to guide later technical specifications. If not otherwise specified, the standard detector is used.
| Scenario | silicon | support | beam-pipe |
|---|---|---|---|
| standard | 600 m | 1.2 mm CF | 500 m Al |
| light | 600 m | 1.2 mm CF | none |
| extra-light | 600 m | none | none |
Event generation:
Two kinds of events were used to study the performance. Either positrons or pions were “injected” at the interaction point or full neutral current [NC] events were generated.
The following samples of injected particles were generated:
-
•
I1 1.000.000 positrons in a flat random distribution with energies from 0.5 GeV to 15 GeV, [0,2], and rapidities from 0 to -8. Only positrons kinematically possible in a collision between a 10 GeV positron and a 200 GeV proton were kept.
-
•
I2 1.000.000 positive pions in a flat random distribution with energies from 0.5 GeV to 100 GeV, [0,2], and rapidities from 0 to +8.
-
•
I3 Sets of 500000 electrons and pions at fixed = 0, -1 -1.7 and -3 and flat in energy between 0.5 and 15 GeV.
The particles were processed through the full detector simulation for all material budgets.
Two sets of NC events were generated for a proton energy of 200 GeV
-
•
NC1 1.6 million events with Herwig, version 5.9.
-
•
NC2 1.8 million events with DjangoH version 1.1.
For a proton energy of 100 GeV a MC data set NC1L was produced similar to NC1.
The NC1 and NC1a events have a Q2 between 0.01 GeV2 and 100 GeV2 and a y between 0.001 and 0.99. The events were reweighted according to the ALLM parton distribution functions [25].
The total luminosities generated were
-
•
NC1:
-
•
9 pb-1 for Q2 [0.01,0.10]
-
•
8 pb-1 for Q2 [0.10,1.00]
-
•
13 pb-1 for Q2 [1.00,10.0]
-
•
93 pb-1 for Q2 [10.0,100.]
-
•
NC1a:
-
•
10 pb-1 for Q2 [0.01,0.10]
-
•
9 pb-1 for Q2 [0.10,1.00]
-
•
14 pb-1 for Q2 [1.00,10.0]
-
•
230 pb-1 for Q2 [10.0,100.]
The events were processed through the full detector simulation for all material budgets.
The NC2 events have a Q2 between 4 GeV2 and 1000 GeV2, and an x between 0.1 and 1.0. The total luminosities generated were
-
•
150 pb-1 for Q2 [4,10]
-
•
4.8 106 pb-1 for Q2 [10,100]
-
•
1.5 108 pb-1 for Q2 [100,1000]
As described in section 6.3 the full GEANT simulation of the forward hadronic detector suffers from large uncertainties. Therefore, the jet response of the detector was simulated by assuming perfect pattern recognition and fixed resolutions. The energy of all charged particles within the tracker acceptance is smeared by 3.5 %. The energy of all remaining particles is smeared by 35%/.
6 Detector performance
The detector performance was studied using the MC events described in the previous section, i.e. either positrons or pions injected at the center or full neutral current events.
6.1 Acceptance
The calorimeter has full acceptance for tracks with 5.0. For higher it follows the acceptance of the tracker.
The geometrical acceptance of the tracker was studied using MC sample I1, i.e. positrons injected at the interaction point. A minimum of three space-points is needed to reconstruct a track. Tracks which penetrate three silicon planes are thus called accepted.
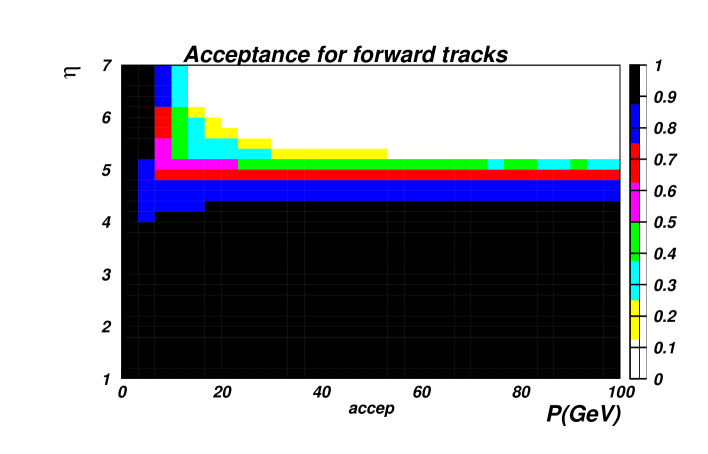
Figure 12 shows the acceptance binned in and for several energy bins. Although three space-points are sufficient it is desirable to have redundancy. For and E GeV 90% of the accepted tracks have 4 or more space points.
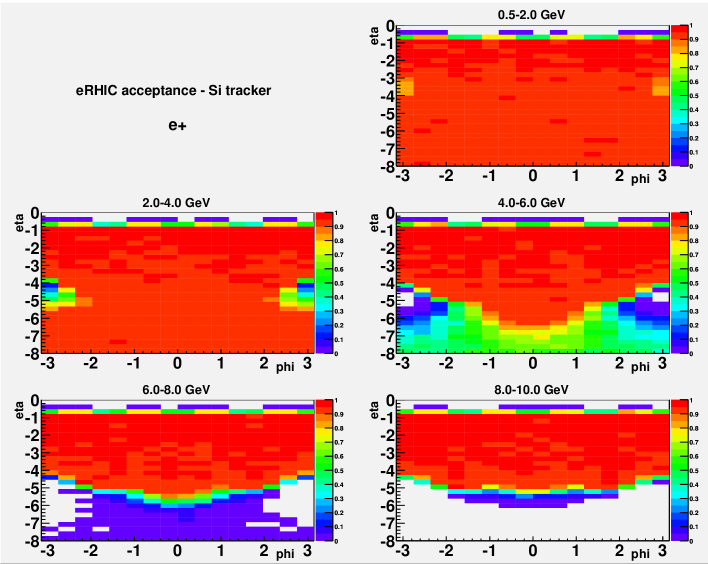
Up to an energy of about 6 GeV good acceptance is obtained up to the maximum pseudo-rapidity studied, . For larger energies and , the magnetic field is not able to separate the positrons sufficiently from the beam to produce enough hits in the tracking stations.
The system is not designed for independent tracking in the central region, . Full acceptance is achieved for . For the acceptance is 57 %. However, in this range 100 % of the tracks have at least 2 hits; in this is still 50 %. This information can be combined with calorimeter information which is best in this region. We do not pursue this further at this stage.
The dependence of the acceptance is purely geometrical due to the field configuration and the shape of the beam-pipe. The acceptance in the +z direction (proton hemisphere) is similar.
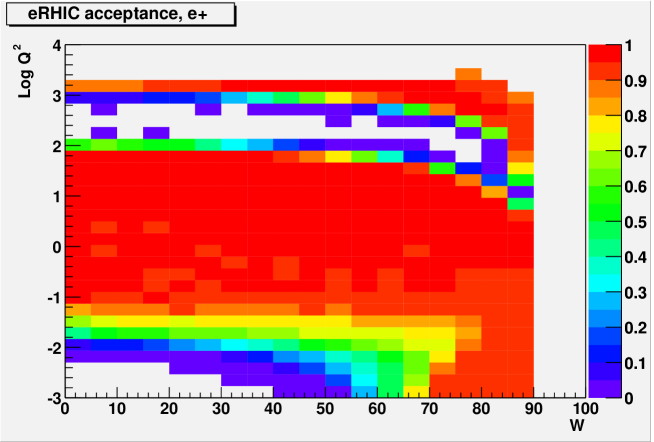
The acceptance of the tracker in the physics variables and was studied with electrons of the NC event sample NC1. It is shown in Fig. 13 for the requirement of at least three reconstructable space-points. There is an acceptance gap for events with between 100 GeV2 and 1000 GeV2 due to the lack of tracking in the central region. This gap can be closed by using calorimetry in this region. This study focuses on the low region where good acceptance is provided down to GeV2 over the complete W range.
6.2 Momentum Resolution
The momentum resolution is studied using the MC event sets I1 [electrons] and I2 [pions] for momenta up to 15 GeV and 30 GeV respectively. The tracks are simulated for the three material budgets described in sect. 5. In addition a hit resolution of 20 m is applied. Two physics processes directly influence the resolution. One is multiple scattering, the other one Bremsstrahlung. While multiple scattering changes the track in a random way, Bremsstrahlung always causes an energy loss and thus a bias. Some Bremsstrahlung photons convert and cause extra hits. In addition, some of the primary electrons/pions interact and create a shower.
In the following a perfect pattern recognition is assumed; i.e., all hits caused by the primary particle as well as those from secondary processes are handed to the reconstruction program for a particular track. As the magnetic field is parallel to the y-axis, a high-momentum track is a straight line in the y z-plane. For each track a 2 cm wide corridor is defined using the y-position of the first hit in z and the origin. In order to reject hits from secondary processes only hits falling into this corridor are handed to the fitting routine 333Special thanks to Volker Blobel who provided the routine and to Christian Kiesling for implementing it.. This procedure fails to provide enough points for fitting for approximately 0.3 % of the otherwise accepted electron tracks in the standard detector for [1,5]. For higher this number increases to the several percent level due to showering in the beam-pipe. The momentum fit is first performed in the x z-plane which is perpendicular to the magnetic field. The components perpendicular and parallel are then recombined.
| extra-light | light | standard | |||||||
|---|---|---|---|---|---|---|---|---|---|
| Energy | p/p | in peak | p/p | in peak | p/p | in peak | |||
| all | all | 1.30 % | 68 % | 1.87 % | 65 % | 3.28 % | 54 % | ||
| all | 3.1 | 1.11 % | 90 % | 1.61 % | 84 % | 2.69 % | 56 % | ||
| 5GeV | 3.1 | 1.14 % | 90 % | 1.66 % | 86 % | 2.95 % | 63 % | ||
| 5GeV | 3.1 | 1.07 % | 89 % | 1.56 % | 84 % | 2.59 % | 52 % | ||
| 0.5 | - | 2.0GeV | all | 1.42 % | 77 % | 2.06 % | 75 % | 3.45 % | 66 % |
| 2.0 | - | 4.0GeV | all | 1.16 % | 75 % | 1.66 % | 72 % | 3.30 % | 59 % |
| 4.0 | - | 6.0GeV | all | 1.15 % | 70 % | 1.63 % | 67 % | 3.39 % | 54 % |
| 6.0 | - | 8.0GeV | all | 1.36 % | 64 % | 1.96 % | 61 % | 3.29 % | 51 % |
| 8.0 | - | 10.0GeV | all | 1.40 % | 63 % | 2.02 % | 60 % | 3.11 % | 49 % |
| 10.0 | - | 15.0GeV | all | 1.40 % | 61 % | 2.03 % | 58 % | 3.15 % | 48 % |
| 0.5 | - | 2.0GeV | 3.1 | 1.31 % | 91 % | 1.92 % | 88 % | 3.21 % | 71 % |
| 2.0 | - | 4.0GeV | 3.1 | 1.07 % | 90 % | 1.54 % | 85 % | 2.81 % | 60 % |
| 4.0 | - | 6.0GeV | 3.1 | 1.04 % | 90 % | 1.51 % | 85 % | 2.73 % | 54 % |
| 6.0 | - | 8.0GeV | 3.1 | 1.07 % | 89 % | 1.55 % | 84 % | 2.63 % | 52 % |
| 8.0 | - | 10.0GeV | 3.1 | 1.09 % | 89 % | 1.59 % | 84 % | 2.48 % | 51 % |
| 10.0 | - | 15.0GeV | 3.1 | 1.10 % | 89 % | 1.60 % | 83 % | 2.45 % | 51 % |
| extra-light | light | standard | |||||||
|---|---|---|---|---|---|---|---|---|---|
| Energy | p/p | in peak | p/p | in peak | p/p | in peak | |||
| all | all | 1.24 % | 70 % | 1.73 % | 70 % | 2.92 % | 72 % | ||
| all | 3.1 | 1.08 % | 96 % | 1.51 % | 95 % | 2.53 % | 90 % | ||
| 5GeV | 3.1 | 1.18 % | 93 % | 1.66 % | 93 % | 2.80 % | 93 % | ||
| 5GeV | 3.1 | 1.02 % | 96 % | 1.42 % | 95 % | 2.56 % | 92 % | ||
| 0.5 | - | 2.0GeV | all | 1.55 % | 78 % | 2.14 % | 79 % | 3.39 % | 83 % |
| 2.0 | - | 4.0GeV | all | 1.18 % | 80 % | 1.67 % | 79 % | 2.81 % | 82 % |
| 4.0 | - | 6.0GeV | all | 1.10 % | 79 % | 1.55 % | 78 % | 2.94 % | 81 % |
| 6.0 | - | 8.0GeV | all | 1.06 % | 77 % | 1.46 % | 76 % | 3.00 % | 79 % |
| 8.0 | - | 10.0GeV | all | 1.06 % | 74 % | 1.48 % | 74 % | 3.05 % | 76 % |
| 10.0 | - | 30.0GeV | all | 1.30 % | 65 % | 1.81 % | 65 % | 2.84 % | 66 % |
| 0.5 | - | 2.0GeV | 3.1 | 1.40 % | 91 % | 1.99 % | 92 % | 3.18 % | 93 % |
| 2.0 | - | 4.0GeV | 3.1 | 1.08 % | 96 % | 1.54 % | 95 % | 2.63 % | 94 % |
| 4.0 | - | 6.0GeV | 3.1 | 1.03 % | 96 % | 1.44 % | 95 % | 2.62 % | 94 % |
| 6.0 | - | 8.0GeV | 3.1 | 1.02 % | 96 % | 1.41 % | 95 % | 2.55 % | 92 % |
| 8.0 | - | 10.0GeV | 3.1 | 1.02 % | 96 % | 1.43 % | 95 % | 2.54 % | 91 % |
| 10.0 | - | 30.0GeV | 3.1 | 1.07 % | 97 % | 1.48 % | 95 % | 2.44 % | 89 % |
| [m] | 0 | 20 | 50 | 100 | 150 | 200 | 500 | |
|---|---|---|---|---|---|---|---|---|
| extra-light | p/p [%] | 1.10 | 1.11 | 1.14 | 1.24 | 1.35 | 1.47 | 2.17 |
| all energies | in peak [%] | 89.5 | 89.5 | 89.8 | 89.9 | 89.4 | 88.4 | 83.3 |
| E5GeV | p/p[%] | 1.06 | 1.07 | 1.10 | 1.20 | 1.33 | 1.48 | 2.54 |
| in peak [%] | 89.1 | 89.2 | 89.4 | 89.8 | 89.8 | 89.6 | 88.2 | |
| E5GeV | p/p[%] | 1.14 | 1.14 | 1.15 | 1.17 | 1.21 | 1.25 | 1.65 |
| in peak [%] | 90.3 | 90.4 | 90.4 | 90.6 | 90.8 | 90.9 | 91.7 | |
| standard | p/p[%] | 2.69 | 2.69 | 2.71 | 2.78 | 2.87 | 2.98 | 3.80 |
| all energies | in peak [%] | 55.9 | 55.9 | 56.0 | 56.4 | 56.8 | 57.2 | 59.8 |
| E5GeV | p/p[%] | 2.59 | 2.59 | 2.61 | 2.66 | 2.74 | 2.86 | 3.90 |
| in peak [%] | 52.0 | 52.0 | 52.1 | 52.3 | 52.7 | 53.2 | 57.6 | |
| E5GeV | p/p[%] | 2.94 | 2.95 | 2.95 | 2.96 | 2.98 | 3.00 | 3.33 |
| in peak [%] | 63.0 | 63.1 | 63.1 | 63.2 | 63.2 | 63.3 | 65.6 |
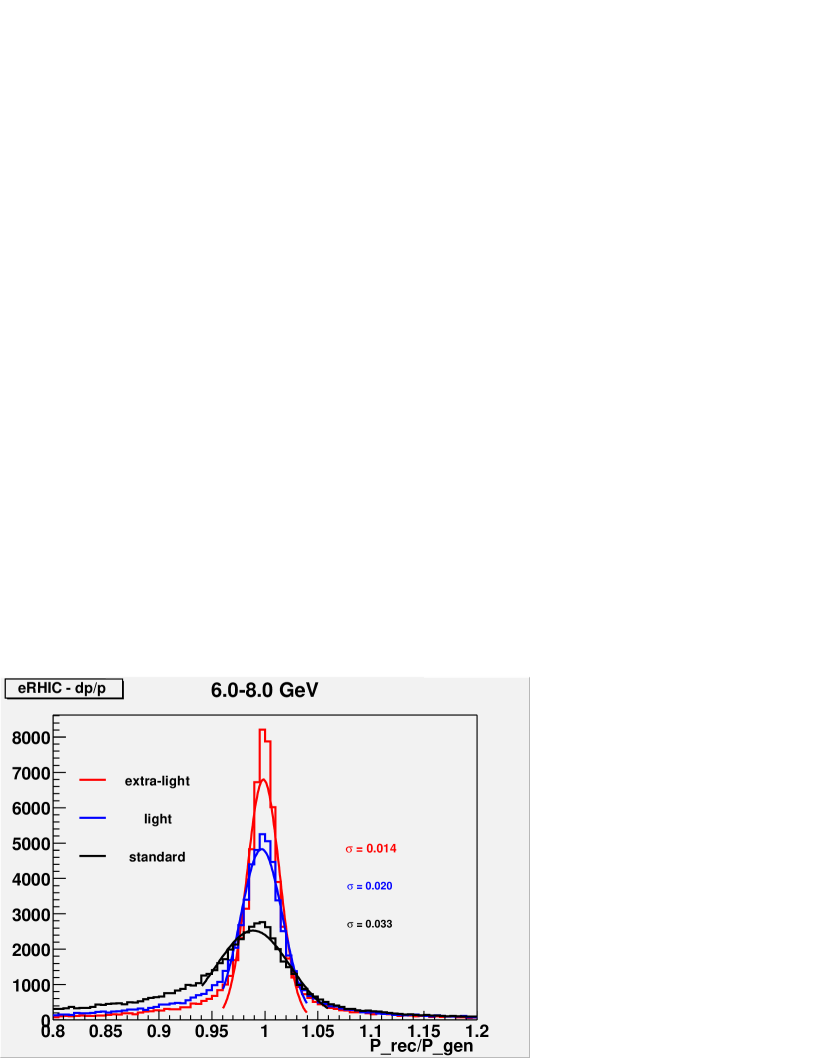
In Fig. 14 the overall distributions of the ratio between the reconstructed and generated momenta are shown for electrons and pions for the three detector scenarios (see sect. 5) under consideration. For each scenario the distribution for all energies and angles and for all energies and , i.e. is provided. For the forward tracks also a separation in energies below and above 5 GeV is shown. The central part of each distribution is fit with a Gaussian function. The resulting will always be quoted as the resolution p/p. Obviously the material is important for the central part of the distributions which are dominated by multiple scattering. However, for electrons it is even more important for the tails due to energy loss caused by Bremsstrahlung. Fig. 15 compares the results for the three detector scenarios for electrons of all angles with energies between 6 GeV and 8 GeV. The tail depicted for the standard detector contains 50 % of the tracks. This number is calculated by integrating the Gaussian over infinity and defining the tail as the total number of fitted tracks minus this integral. For pions, Bremsstrahlung does not present a problem and this tail basically does not occur even for the standard detector.
In Tables 2 and 3 the p/p values are given for the three scenarios. In addition the resolutions are quoted for different energy bins. The momentum resolution p/p for pions is a little better than for electrons, as they are less affected by multiple scattering. The difference is, however, not as striking as for the tails of the distribution. This is reflected in the much larger percentages of tracks contributing to the peaks of the distribution which are also listed in Tables 2 and 3. The biggest difference is naturally seen for the standard detector.
Comparing the three scenarios it becomes evident that the extra support material which distinguishes the light from the extra-light scenario has a much smaller effect on the performance than the introduction of a beam-pipe in the standard detector. This can be understood as the precision of any tracking is massively influenced by the amount of material in front of the first measurement. Thus, any technical development aiming to reduce the material in each tracking station is only useful if the beam-pipe is replaced with a Roman pot system.
Due to the geometrical layout of the detector the momentum resolution does not depend strongly on the momentum itself. Tracks with larger momenta have a higher probability to have more than three space-points seen and usually have a longer lever arm, thereby maintaining an approximately constant momentum resolution.
The influence of the hit resolution was also studied. Table 4 lists the influence of on p/p for the standard and extra-light detector in the forward phase-space region previously used. The hit resolution is obviously not critical below at least 50 m when reasonable amounts of material for a silicon tracker are assumed. This is understandable, as one tracking station with 1 % X0 causes distortions in the next station about 50 cm downstream of about 70 m from multiple scattering alone. However, hit resolution is also important for pattern recognition issues like double track separation and space-point reconstruction which are not addressed here. Alternative technologies like drift chambers, which could reduce the material in the tracker beyond the extra-light scenario, generally have hit resolutions above 100 m and would thus be limited by their resolution. A silicon tracker is a more robust solution and a hit resolution after alignment of 20 m is realistic.
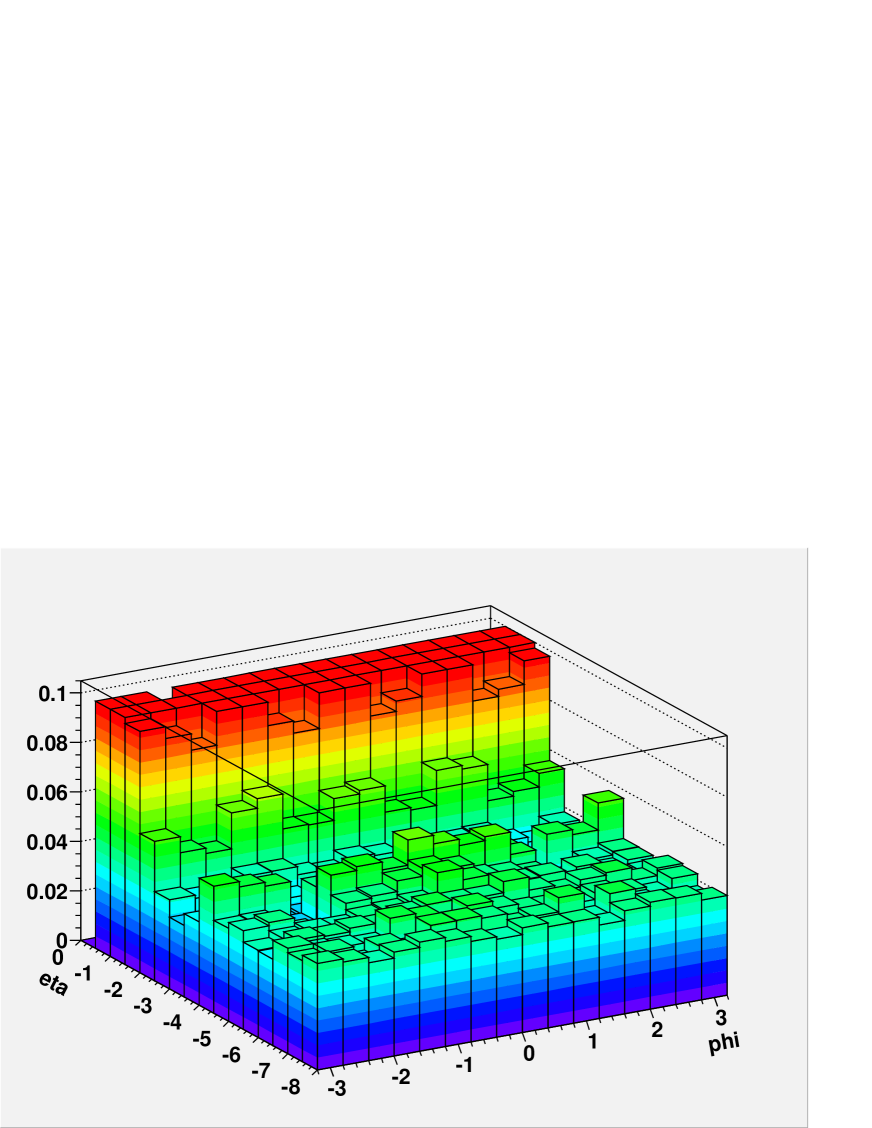
Due to the field configuration the momentum resolution depends on the angle and the pseudo-rapidity . This is demonstrated in Fig. 16. The effect is most pronounced at low . The plot is truncated at 10 % in the central region where the momentum fit is intrinsically bad due to the field configuration and orientation of the tracking planes.
Summary:
The material budget seriously affects the momentum resolution. A beam-pipe even as thin as is assumed in the standard scenario does not allow a momentum resolution of better than 3 % for electrons or pions. In addition it causes tails in the p/p distribution for electrons which can contain up to 50 % of the tracks. It thus seems advisable to consider the possibility of a Roman pot system for the electron hemisphere. This should allow for a momentum resolution around 2 % and managable tails in the distribution.
6.3 Energy Resolution
The energy resolution for electromagnetic showers was studied using the Monte Carlo data sets I3 with the standard detector simulation. The pattern recognition in the calorimeter is assumed to be perfect, i.e. all deposited energy is used, and no energy threshhold corresponding to the limitations of any read-out electronics is taken into account. The results are shown in Fig. 17.
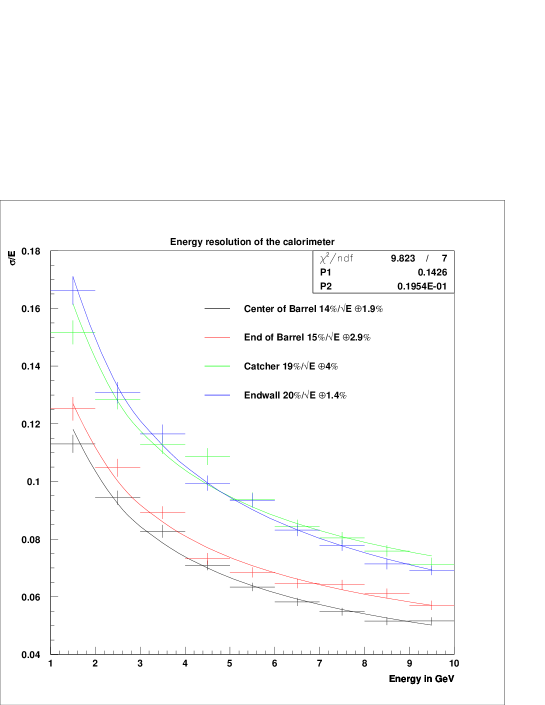
In the barrel the energy resolution depends on the pseudo-rapidity of the particle, i.e. on the impact angle. In Fig. 17 results are given for the center and the end of the barrel where the effective absorber and sampling layer thickness doubles. In the catcher and the endwall only the absorber thickness is doubled while the silicon thickness remains the same. Thus the resolution is worse. This is not a problem, as this phase space is completely covered by the tracker and thus is “only” needed for neutral particles and e- separation.
The energy resolution for electromagnetic showers in the barrel is
for the central and end part respectively. Here no correction is applied to adjust the calibration to the change in sampling fraction. This is reflected in the larger constant term for the end part.
The energy resolution in the catcher and end-wall is
The calibration is taken from the end-wall and also used for the catcher. The larger constant term reflects the different angular distribution of the showers and leakage in the catcher.
Hadronic calorimetry is only foreseen for the proton hemisphere end-wall. A full GEANT study of the set-up, i.e. the silicon-tungsten end-wall plus the hadronic part of the ZEUS uranium-scintillator calorimeter, was inconclusive. The resolution observed depends strongly on the hadronic shower simulation package and the cut-off energies used. Resolutions between 40 % and 80 % were “determined”. The ZEUS forward calorimeter has a measured hadronic energy resolution of 35 % . We assume that a similar resolution can be achieved, and in the following the ZEUS calorimeter performance for hadrons was put in by hand. The possible use of such a mixed technology for the forward calorimeter will require detailed simulation studies as well as test-beam data.
6.4 e- Separation
The Monte Carlo event sets I3 with = 0, -1 and -3 were used. The extralight detector was simulated to exclude radiative effects from the material in the beam-pipe. In order to define clusters the transverse segmentation of the calorimeter in 1 cm by 1 cm cells is used to build 5 cm by 5 cm towers. If a tower shows energy, the neighboring towers are checked and added to the cluster, if they too contain energy. The cluster with the highest energy is analysed. For electrons this procedure can result in the loss of energy if a radiated photon creates a second cluster. For pions it is possible that non-contiguous parts of a shower are neglected.
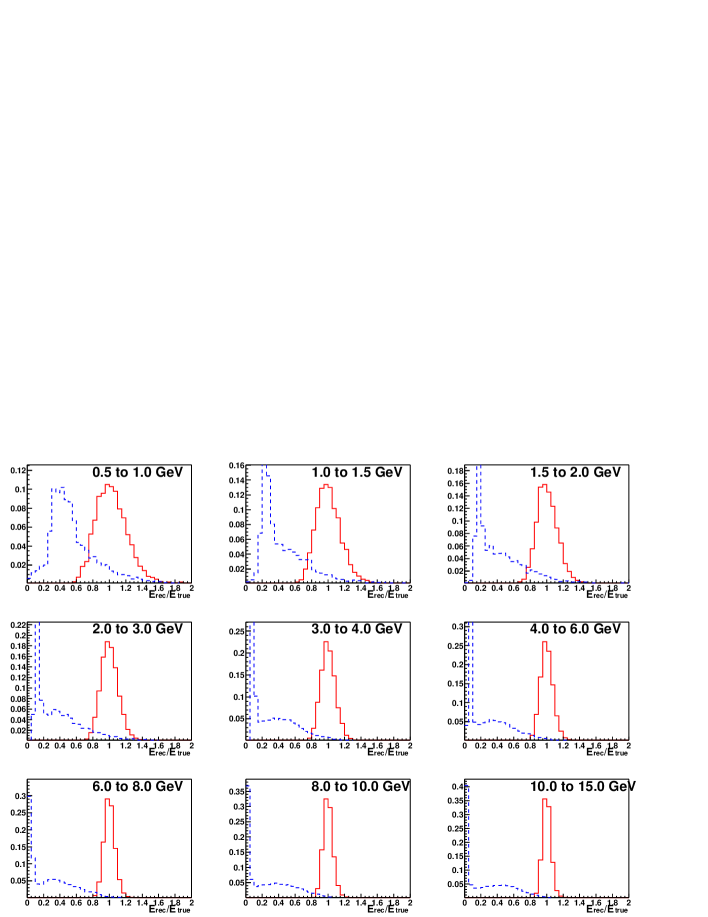
As a first step the energy response is studied. For positrons the simulation confirms an energy independent response over the range of 1 GeV to 15 GeV. The calibration constant needed to adjust the visible energy to the generated energy changes by 5.5 % over the length of the barrel calorimeter. In contrast the calibration in the end-wall only differs by 0.2 % from the central barrel. This can be explained by the same thickness of the silicon in the two devices. All shifts in calibration constants are corrected for from now on.
The calibrated visible energy in the central part of the barrel calorimeter for positrons and positive pions is depicted in Fig. 18 for energies between 0.5 and 15 GeV. The energy response for the pions clearly shows the peak at very low energies associated with non interacting pions. For higher energies pion showers are not contained and thus the visible energy also for interacting pions is lowered.
Assuming knowledge of the particle momenta from the tracker an e- separation solely based on the energy response is possible. Figure 19 shows the result for a cut on the ratio for the central [] and the end part [] of the barrel as well as the end-wall []. The binning in energy is the same as in Fig. 18.
The separation is significantly worse for the end part of the barrel than for the center. At low energies this is caused by the cruder sampling due to the geometry. At high energies the result just reflects the fact that pion showers are better contained in the end part due to the larger effective depth. The end-wall has the same effective absorber plate thickness as the end of the barrel, but thinner silicon. This causes an even lower efficiency than in the end of the barrel, but the rejection power is slightly better. The end-wall has the same overall thickness as the central barrel so the differences are only caused by the different sampling fraction. However, the results from this simple approach show that an efficient and powerful e- separation is rather easy at energies above 3 GeV. Therefore the focus of further studies is on the low energies.
Electromagnetic and hadronic showers are different in longitudinal and in transverse development. Both aspects are studied.
The barrel calorimeter has 50 layers, the end-wall has 25. Both add up to 25 radiation length and in both cases a grouping into three longitudinal segments is assumed. The optimization of the longitudinal segments was done for 2 GeV showers, as this provides a good compromise between optimization for low and high energy showers. The segment borders were chosen to correspond to 50 % and 150 % of the depth of the shower maximum. In the barrel the grouping of layers changes with z in order to keep the conditions for e- separation similar.
The following cuts on the ratios of the longitudinal segment energies , and are used:
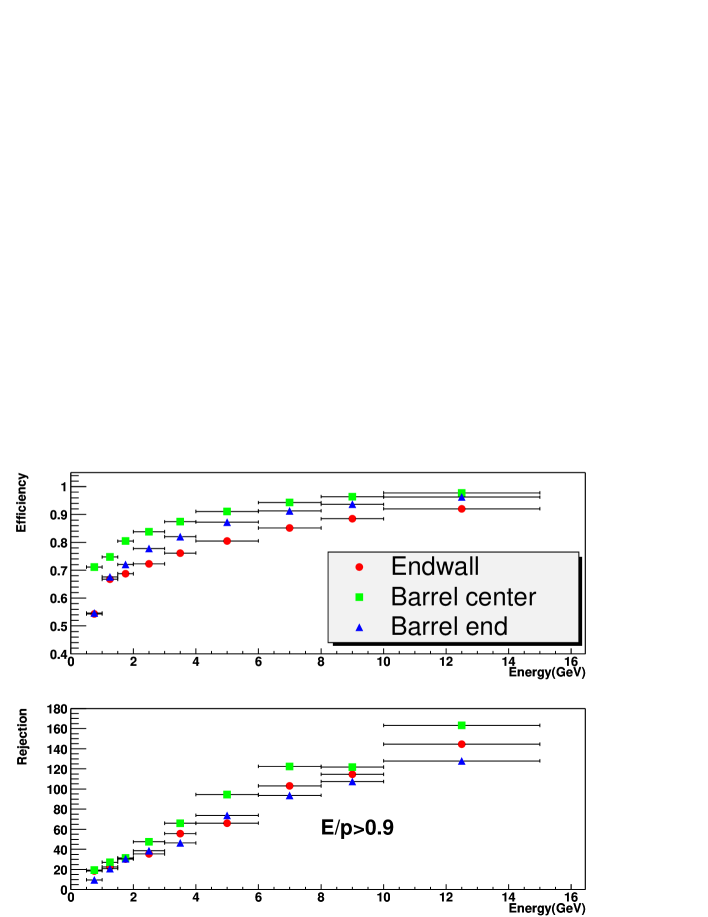
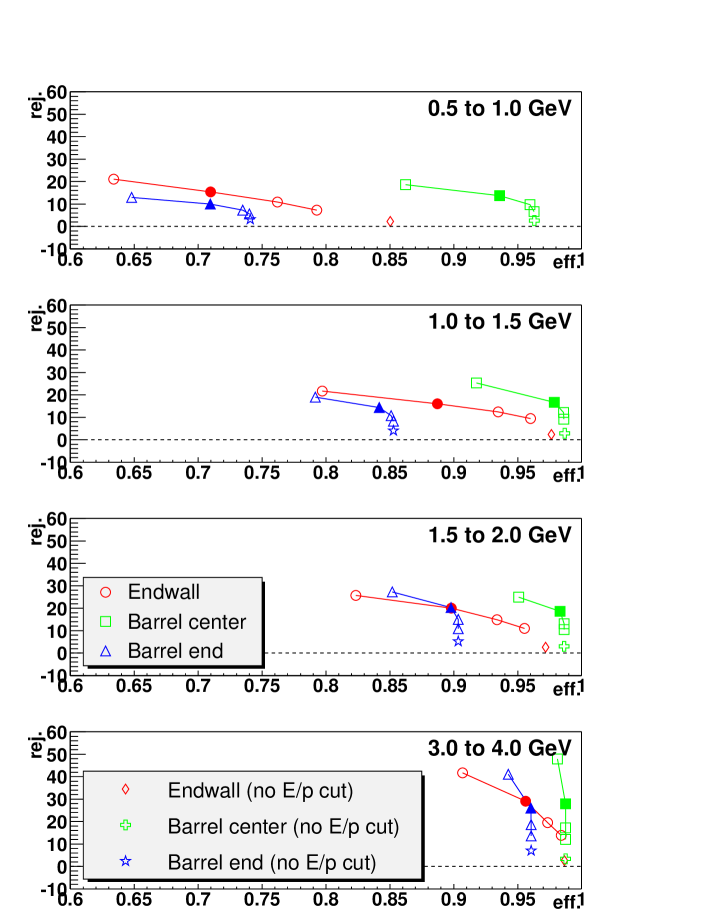
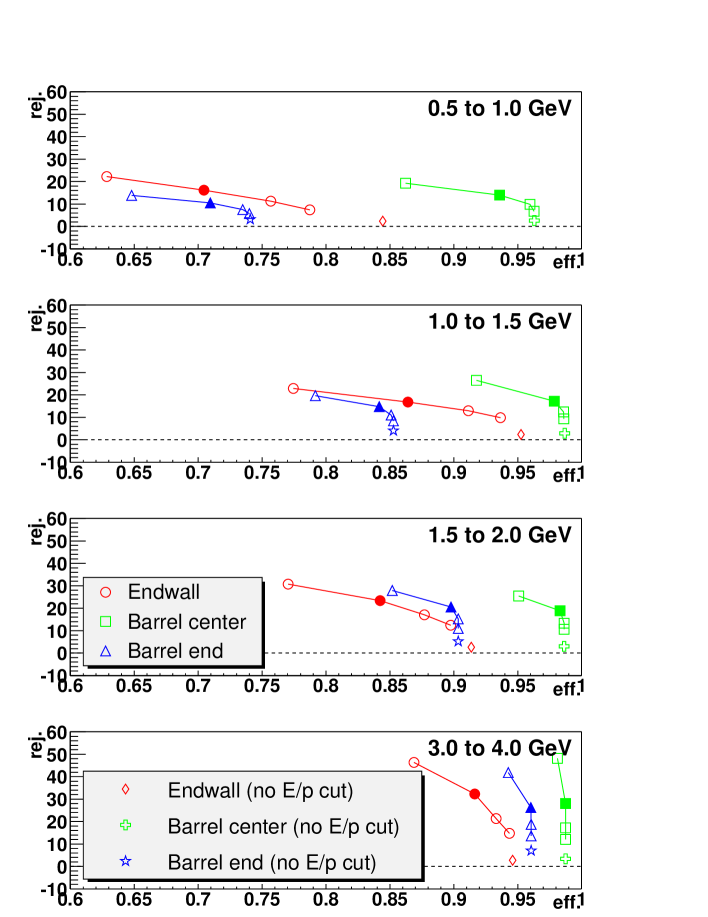
These cuts are combined with a varying cut on . It starts at 0.5, yielding the maximum electron finding efficiency, and is increased in steps of 0.1 up to 0.8. Figure 20 shows the results for the three regions under study and 4 energy bins.
Above 1.5 GeV a rejection power of 20 is reached with efficiencies above 90 %. Above 3 GeV the efficiency increases to 95 %. It is clear that below 1 GeV a separation between electrons and pions becomes very difficult. For reasonable rejection power very low efficiencies are achieved. Only the central barrel with its fine granularity might support e- separation at such low energies. The preferred cut is . It is used for all energies. The corresponding points are printed as filled symbols in Fig. 20.
We also determined the e- separation without a cut on . This reflects the situation where a track cannot be found. In this case events with GeV are identified as non-interacting pions. This is justified, as in subsequent analysis no attempt is made to identify particles with an energy of less then 1 GeV. The result is also shown in Fig. 20. The longitudinal cuts are not optimized for this case. They would have to be made dependent on the visible energy to be more effective. This is not done for this study.
The transverse cell size of the calorimeter was chosen to be 1 cm 1 cm, i.e. close to the Moliere radius. For the moment a non-pointing geometry with a stable cell size is assumed over the whole barrel and also the end-wall has the same cell size. The development of the transverse size of the shower in the three longitudinal sections reveals that after cluster finding the transverse sizes in the three longitudinal compartments look very similar. Thus, the overall transverse size is defined as
where i runs over all calorimeter cells. is the energy in the cell, and define its center. The baricenter of the cluster is denoted by and .
The cut in to identify electrons is
Figure 21 depicts the results when this cut is combined with the cuts used in Fig. 20. The increase in rejection power is not convincing while the loss in efficiency is quite significant, especially in the end-wall. This is due to the widening of electromagnetic showers due to the addition of a Bremsstrahlungs-photon. For all further analysis presented in this study the transverse shower development is not used.
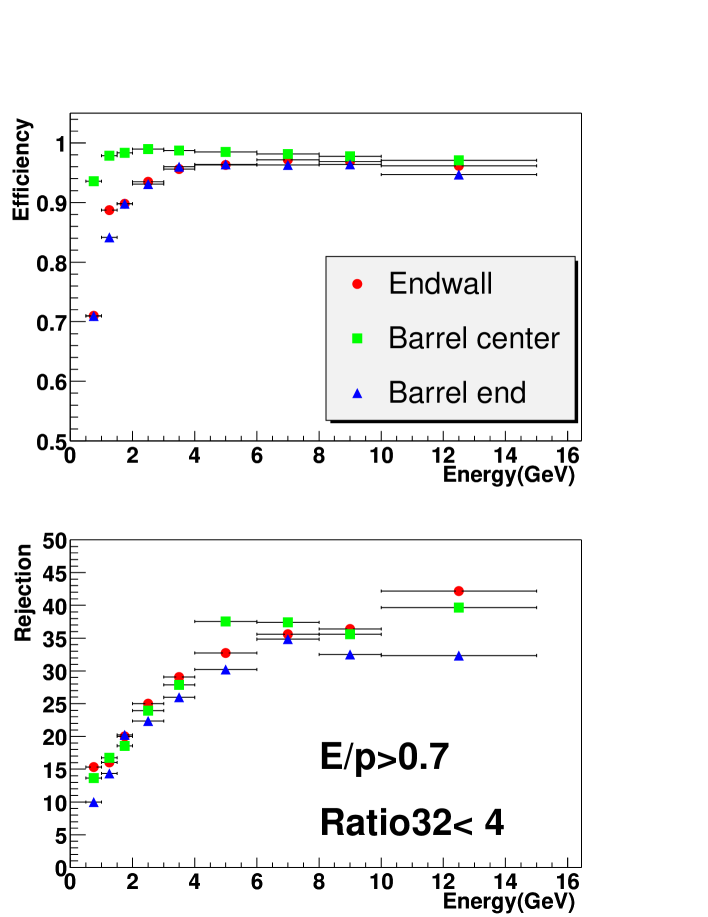
The final result using a cut and the longitudinal energy cuts decribed above is given in Fig. 22. Above 2 GeV a 90 % efficiency to identify positrons with a rejection factor above 20 for pions is achieved. Between 1 GeV and 2 GeV the efficiency stays above 85 % while the rejection factor is between 15 and 20. Below 1 GeV only the good sampling of the central barrel would support e- separation with good efficiency, if additional tracking was added.
The question of transverse shower development should be revisited after further refinement of the clustering procedure. In addition the total number of three dimensional cells with energy deposition could be considered. Also a neural network analysis using full cell information might be very useful.
More design optimization for the various parts of the calorimeter is deferred to the actual design phase of the detector. A projected geometry for the barrel and finer sampling in the end-wall could support e- separation down to 0.5 GeV everywhere. The barrel calorimeter could also have a number of layers varying with z. The effective depth would always be kept at 25 X0. The 25 inner layers would extend to 70 cm and the 25 outer layers would gradually be reduced in length to 20 cm. This would reflect the change in longitudinal segmentation described earlier and not degrade the overall performance. However, it would save a substantial amount of silicon and tungsten and the placement of read-out electronics and support mechanics would become easier. Another possibility is to implement a digital instead of an analogue readout. This would allow for very fine longitudinal and transverse segmentation. The small three dimensional cells would reveal the shower structure. The number of holes within the shower volume would be one of the observables to separate hadronic and electromagnetic showers.
Clearly more studies are advisable to optimize e- separation before a calorimeter is actually constructed. However, it seems feasible to meet the requirements to efficiently find and identify electrons down to an energy of 1 GeV.
6.5 Background rejection
There will be several types of backgrounds to deal with in the detector design discussed here:
-
•
Beam related background, such as synchrotron radiation, off-momentum electrons and secondaries from upstream proton interactions. We do not expect these events to be mistaken for real events, as they can easily be removed with timing and vertex constraints. However, if the rate is too high, overlay or even radiation damage problems could occur. A detailed study of these backgrounds has not yet been performed, but would clearly be an important issue in future studies of this type of detector design.
-
•
Background from Bethe-Heitler overlays. There will be a high rate of electrons in the detector from the e p e p Bethe-Heitler reaction. The expected rate approaches 2 MHz for a luminosity of
cm-2 s-1. These extra electrons will need to be properly treated in the analysis procedure. As the electrons are produced under fixed zero degree angle, their identification should be feasible. This also allows a high precision luminosity measurement with the main detector. -
•
Photoproduction events ( GeV2) mistakenly reconstructed as DIS events ( GeV2) are a source of background at HERA. This is particulary true at high , where the scattered electron has low energy and a photon or in the hadronic state can be misreconstructed as the scattered electron. As the acceptance of this detector allows the reconstruction of the true scattered electron down to very low Q2 values, the background from smaller events is naturally reduced. Furthermore, at high , the scattered electron always enters the detector and will be reconstructed.
The low W photoproduction background, where the scattered electron carries a large fraction of the beam energy and therefore remains in the beampipe, can be suppressed by a minimum requirement on the quantity observed in the detector. The resolution was studied with Monte Carlo events from set NC1 which have identified electrons in the standard detector. Fig. 23 gives the result for two bins and [0.32,1] GeV2. The resolutions of 0.7 GeV [left] and 1.6 GeV [right] and shifts of 0.3 GeV [left] and 1.0 GeV [right] should be compared to = 20 GeV. A cut of about 15 GeV to suppress photoproduction is clearly feasible, especially for the low W region which corresponds to the left picture.
Given the ability to reject low W photoproduction background and the containment of high W events, photoproduction will not be a major source of background with this detector.
-
•
Events with initial state photon radiation. These events can be controlled both by measuring the radiated photon (see section 4.6) or by measuring E-Pz in the central detector.
7 Physics reach
In this section, the kinematic limits of the set-up are discussed and compared with the physics reach determined by full MC studies.
7.1 Structure function
Detailed studies of the low and the high regime are presented in later sections. Here we discuss the basic kinematic limitations.
In the low regime only the scattered electrons are used to reconstruct the kinematic variables x and Q2. The acceptance for the electron in the tracking system has already been shown in Fig. 13. The scattered electron can be momentum analyzed over the full (or ) range for down to 0.05 GeV2, since the electron scattering angle is large enough for it to enter the detector independent of momentum. Below this , the acceptance is limited to the larger values of where the magnetic field is used to extract the scattered electron out of the beampipe. The detector has 100 % acceptance for GeV down to GeV2.
The resolution is given by
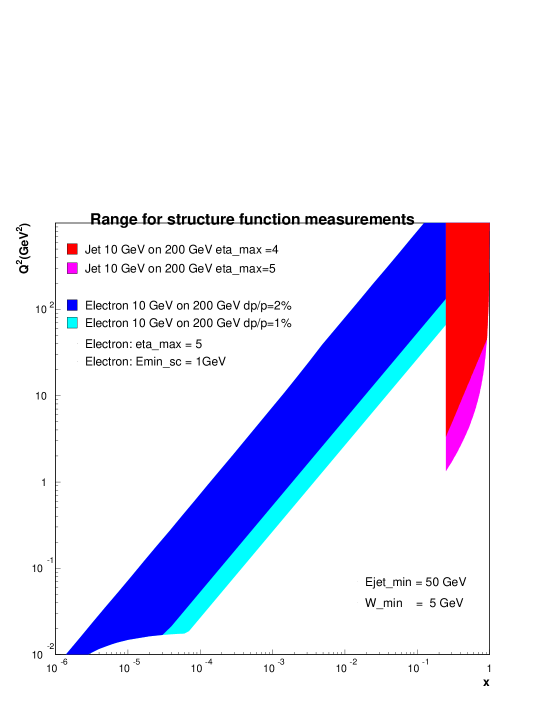
where are the scattered electron momentum and angle, respectively. At the smallest values of for a given , the electron energy is small and the kinematic quantities will be measured with high precision. However, as increases, decreases (for a fixed ) and the electron method rapidly loses resolution in the measurement of (or ). The kinematic range yielding 30 % for the electron method assuming a momentum resolution of % or 2 % is shown in Fig 24. The standard detector including a beam-pipe cannot quite reach that level, see sect. 6.2. However, for a Roman pot system without a beam-pipe a 2 % momentum resolution is realistic. The low edge is determined by the minimum energy required for the electron. The cut of 1 GeV is a result of the choice of silicon-tungsten calorimetry, as e/ separation becomes impossible at lower energies.
In the high regime the electron is used to calculate and the jet energy is used to calculate . Thus the minimum energy required for a jet determines the left edge of the accessible area. The acceptance in limits the reach towards low . In addition the minimum required cuts into the -reach at extremely high . The resulting kinematic coverage using this mixed method is also shown in Fig 24.
For intermediate values, where neither the electron nor electron+jet methods work, other techniques such as the double angle method must be employed. It is expected that these methods will fill the gap between low and high seen in Fig. 24. This region has not been studied in detail, but experience at HERA indicates that it should be possible to perform high precision measurements also in this kinematic range.
This study focuses on the low and high regime, for which the detector was optimized and which are the most interesting.
7.2 Structure function at low
In the last section the kinematic range in principle accessible to the device was discussed including the key role of momentum resolution. The experimental situation is, however, more complicated, as not only the Gaussian part of the momentum resolution, but also the tails as discussed in sect. 6.2 are of importance. In addition e/ separation is crucial in identifying the scattered electron.
The study uses the events from MC sample NC1 as described in sect. 5. It should be noted that this sample contains only events with 100 GeV2.
7.2.1 Event reconstruction
The event reconstruction assumes perfect pattern recognition in the tracker and uses the fit method described in sect. 6.2. The calorimeter cell information is used to identify clusters which are subsequently matched to tracks.
The cluster finding algorithm does not use the longitudinal segmentation of the calorimeter. The cells are grouped into 5 by 5 cell towers. If a tower shows energy, the neighboring towers are checked and added to the cluster, if they too contain energy. The barycenter of the cluster is calculated using the full cell granularity of the calorimeter.
A track is matched to a cluster if its distance of closest approach to the barycentre of the cluster is less than 10 cm. If more than one cluster are within the cut the track is matched to the closest cluster.
The electron is identified by ordering the tracks in the electron hemisphere and central tracker according to momentum. Descending in momentum the corresponding cluster is analyzed for its electron probability. The cuts described in sect. 6.4, with performance as shown in Fig. 22, are used. If no cluster could be assigned, the track is assumed to be a pion. If no electron can be identified in the list of tracks, clusters in the catcher and the barrel which do not have a track are analyzed. As only events with 100 GeV2 are considered, there is no need to search for electrons in the proton hemisphere.
7.2.2 Efficiency and purity
The resolution in x and was used to determine the binning for the analysis. These resolutions are shown in Fig. 25 for both the standard material budget and the extra-light material budget. As is clear from the figure, the resolution is very good for GeV2 and degrades as increases. This is because the electron scattering angle increases, resulting in both a smaller and fewer planes crossed. Also, at higher values of , no track is available and only calorimeter information can be used, resulting in poorer resolution.
As described above, good resolution in is only possible with the electron method for the smallest values of for a fixed . This is clearly seen in Fig. 25, where the resolution in is given as a function of and . Only those areas are shaded where the resolution is better than 50 %. The resolution again degrades at the larger values of where the tracking is less effective or absent. These is a marked difference in the resolutions determined for the standard and extra-light material budgets, adding emphasis to the point that minimizing the material budget will be a crucial design consideration.
The resolutions determined with the extra-light material budget were used to define bins in which cross sections were evaluated. Efficiency and purity for a given bin are defined as
and
Fig. 26 gives the results for two different material budgets in the detector in the chosen bins. The standard detector has tracker support structures and a beam-pipe, the extra-light detector does not (see also sect. 5 table 1). It is obvious that the material in the standard detector reduces the range of good efficiency and purity significantly. The better momentum resolution of the extra-light detector is reflected in better efficiency and purity at higher x and down to lower . At high the electron is frequently only seen in the calorimeter. As the energy resolution in the calorimeter is worse then the momentum resolution in the tracker and e/ separation less effective without a track, the range in x is reduced in this region.
7.2.3 Systematic errors
The goal is to measure to better than 2 %. The statistical errors will be negligible for all the bins considered here for the expected luminosities. Thus all systematic errors should be controlled to 1 %. Sources of systematic error are studied by shifting the relevant variables in the reconstruction and monitoring the shift in . The result is that it is required to control
-
•
the energy scale to 1 %,
-
•
the momentum scale 0.1 %,
-
•
the hit efficiency to 1 %,
-
•
the tracking efficiency to 1 % .
These requirements are well within achievable bounds. For the measurement of , tighter requirements must be set as described below.
The energy scale of the calorimeter acts through the e/ separation and affects mostly the low region. The momentum scale affects, via error propagation, mostly the high region. Systematic uncertainties in the hit and tracking efficiency shift as a whole.
7.2.4 Results
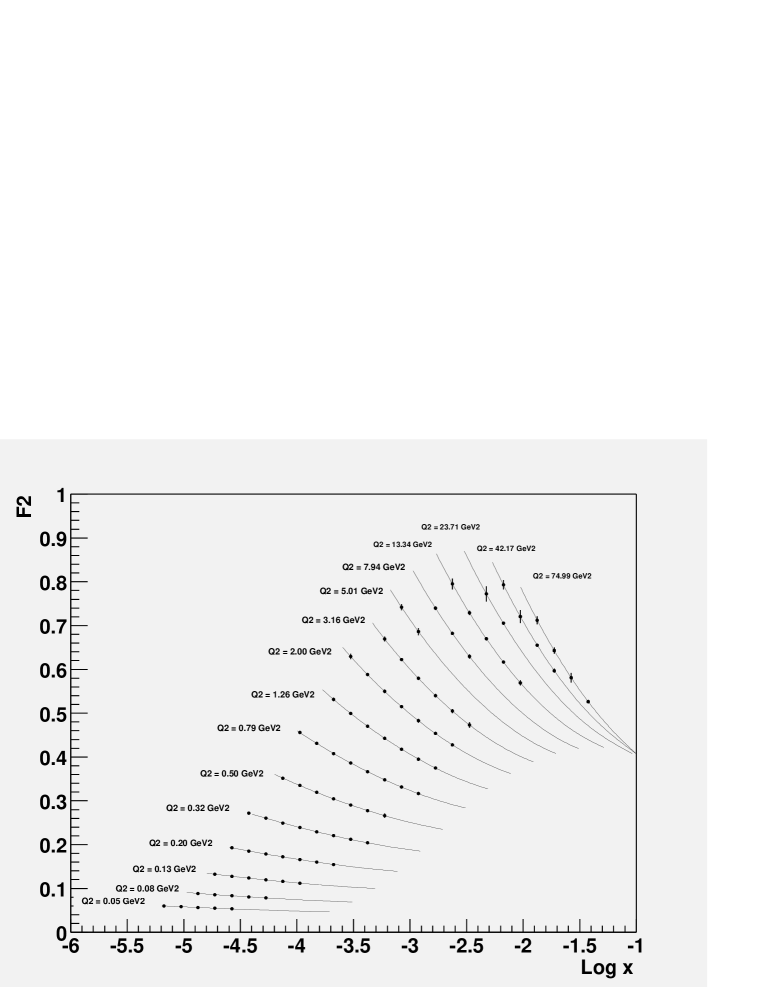
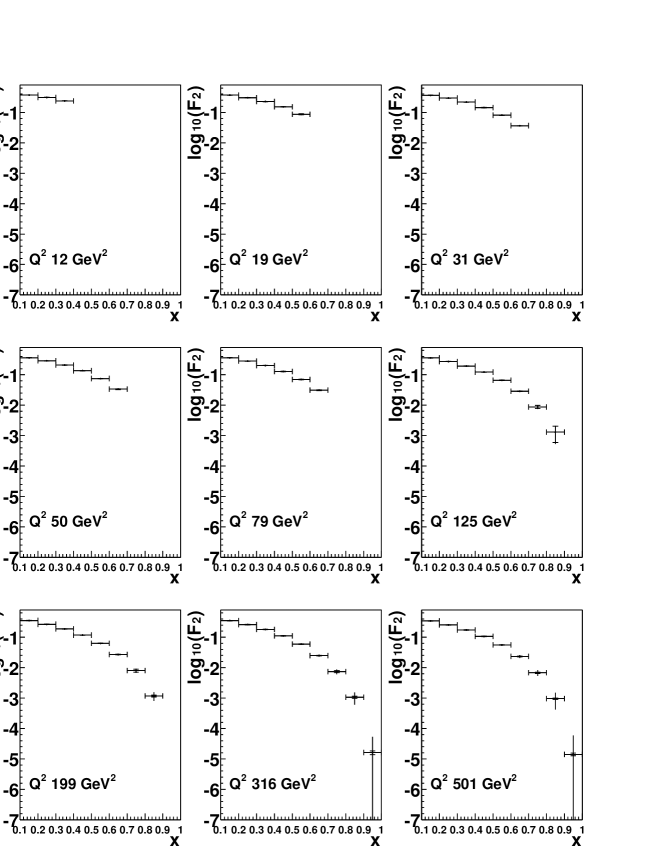
Bins where the efficiency and the purity are above 20 % are considered useful for the physics analysis. This is a lower cut than normally used in structure function analyses. It was chosen this way in order to have the same binning for the different material budgets. As the bins were set using the higher resolutions of the extra-light scenario, we use a low cut to allow also a significant number of measured bins with the standard material budget. The binning would be changed in a more complete analysis, but this was not attempted here. The extracted for the standard and the extra-light detector are depicted in Figs. 27 and 28. An integrated luminosity of 100 pb-1 is assumed.
The error bars containing statistical and systematical errors are smaller than the size of the symbols for most of the points. The advantage of the extra-light detector is that a larger kinematic range is accessible. The reduction in errors as seen in some points is less significant.
7.3 Structure function at low
The measurement of requires running at different center-of-mass energies and comparing cross sections for a given but different , as is clear from the cross section formula
where , and has been neglected.
The reach in was studied by using the two Monte Carlo event sets NC1 and NC1L (see sect. 5) using proton energies of 200 GeV and 100 GeV. In both cases the analysis described in sect. 7.2 was applied. The usable overlap was determined by requiring both the efficiency and the purity for both energies to be above 20 % for a given bin. The statistical error on was calculated from the cross sections measured with the different center-of-mass energies for a given bin. A luminosity of 100 pb-1 for each proton energy was assumed. The systematic error on was then evaluated by repeating the cross section extraction and calculation for each systematic test. The systematic uncertainties clearly dominate, even for luminosities of pb-1. The errors are minimized by having the maximum y range for a given and x. This implies the maximum possible spread in the beam energies. A factor 2 was assumed for this study, and a larger range would yield improved results. It is also important to measure as high in y as possible, i.e., as low in electron energy as possible. We have assumed that electron measurement and identification down to GeV is possible. Only two beam energies were used in the study; more energy points would help in reducing some of the systematic errors.
The resulting values of for the standard detector are given in Fig. 30 along with two different sets of predictions. The central value of was arbitrarily chosen to lie on the curve from the saturation model. Of importance here is the size of the error bars. The inner error bars are statistical only, while the outer bars combine statistical and systematical errors. Only points with errors on less than are shown. The predictions come from DGLAP evolution [full line] and the saturation dipole model [dashed line]. The biggest difference is in the low and low regime.
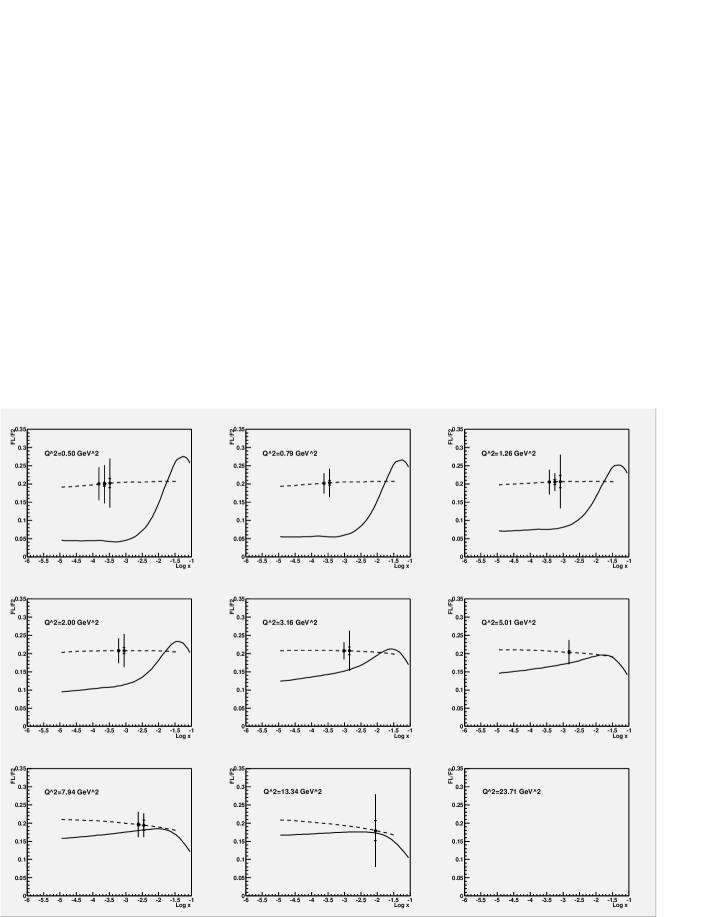
Fig. 30 demonstrates that the standard detector is indeed able to provide a good measurement at low and . Such a measurement can distinguish between models, but it is desirable to extend the range to higher . This can be done by reducing the systematic errors. It can be realistically assumed that
-
•
the energy scale is controlled to 0.3 % ,
-
•
the momentum scale to 0.05 %,
-
•
the hit efficiency to 0.2 %,
-
•
the tracking efficiency to 0.2 %.
This extends the range of the measurement in and reduces the systematic errors. The result is depicted in the top plot of Fig. 31 The extra-light detector enlarges the range in the measurement of , and therefore also the range in . The result for the extra-light detector is given in bottom plot of Fig. 31. As only points with a relative error of less than 10 % are shown, statistical fluctuations in the MC sample sometimes cause a point to disappear. This effect can be seen for the extra-light detector in the lowest bin.
As is clear from Figs. 30 and 31, it is possible to measure with the required precision in the kinematic region of highest interest. Even the standard detector with the standard systematic errors can distinguish between the predictions in an interesting area of phase-space. With lower systematic errors and with an extra-light detector the measurement is further improved.
7.4 Forward jets and particle production
One of the principal features of the detector is the possibility to track particles over a very wide rapidity range. The tracking acceptance in the proton direction is shown in Fig. 32. It extends to for all momenta. This acceptance is to be contrasted with the maximum pseudo-rapidity coverage of the currently operating e p detectors H1 and ZEUS of . The vastly increased rapidity coverage allows the measurement of particle production and particle correlations from the current jet region into the target fragmentation region, thereby allowing detailed studies of radiation patterns in QCD.
The situation for forward jet production is also extremely advantageous, since the calorimetric coverage extends also to very high rapidities. Jet reconstruction should be possible out to , again allowing for sensitive tests of parton splitting processes. At this time it was impossible to find a Monte Carlo generator which can reliably produce events at such high for the eRHIC kinematics (see also next section). The jets in Monte Carlo sample NC2 fill the pseudo-rapidity space up to approximately =4.
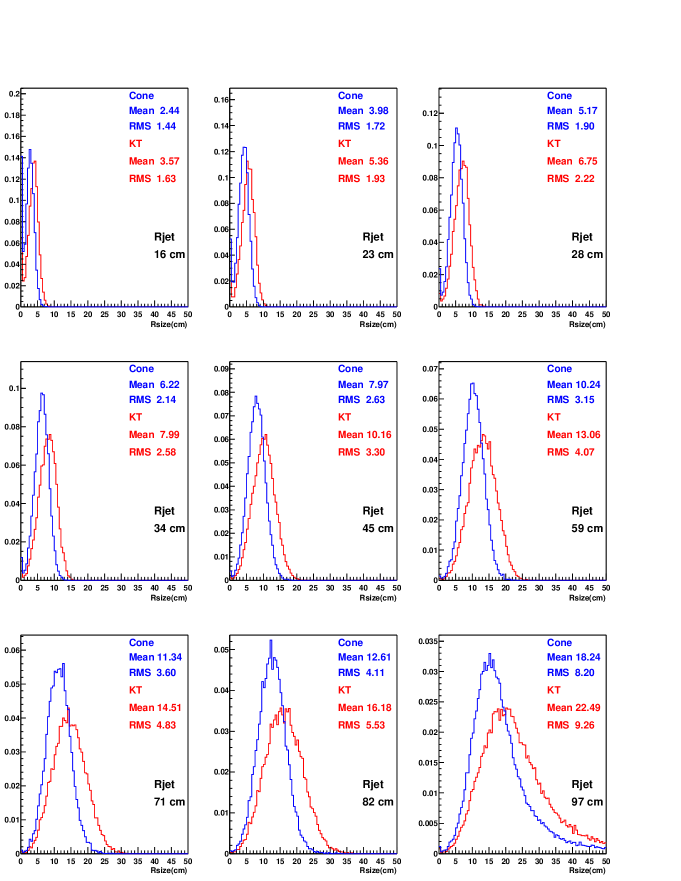
The jet sizes were studied using the KT and the cone jet-finding algorithms. The jet size is defined as
where the sum runs over the cells in the jet, is the cell energy, is the cell position, and is the jet centroid. The KT algorithm was used in the standard 3212 mode. The cone algorithm was used with a radius cut of 0.7 in phase-space.
Fig. 33 gives the distribution of for the two different algorithms for different radial distances of the jet axis to the proton beam axis at the face of the calorimeter [z=360 cm]. The KT algorithm results in wider jets which are, as further studies showed, pulled towards the remnant jet. They also contain in average 3 % too much energy. The cone algorithm is much better in separating the jet from the proton remnant.
The actual ability to measure the properties of these very forward jets will certainly have to be complemented by the development of appropriate MC generators which extend jet production to larger pseudo-rapidities.
7.5 Structure function at high
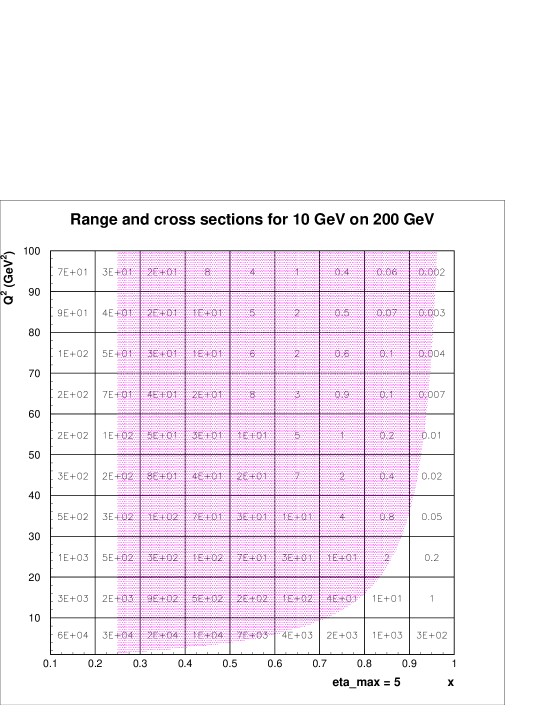
An expanded view of the high- coverage, along with expected cross sections calculated with the ALLM parameterization [25], is shown in Fig. 34. The large rapidity coverage of this detector yields full jet acceptance at high- already for moderate values. As the scattered electrons are seen in the detector up to , an integrated measurement of the cross section is possible beyond the limit where jets can be used to measure . This allows the measurement of the integral of from the edge of the phase space coverage shown in Fig. 34 to .
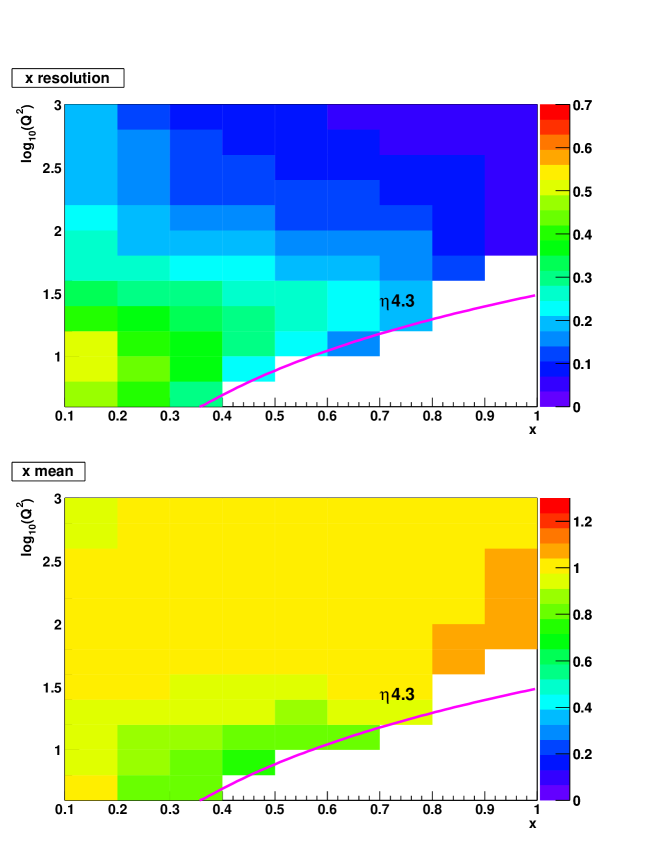
The Monte Carlo sample NC2 is used to study the high regime in more detail. Unfortunately DjangoH cannot produce events with sufficiently high and low to fill the complete phase space indicated in Fig. 34. Fig. 35 shows the MC accessible part of the phase-space while depicting the resolution and the accuracy of the reconstructed . As was pointed out in the previous section, the KT algorithms suffers from substantial contamination from the proton remnant jet. Therefore the cone algorithm is used to find the jet in this analysis.
The resolution from the jet energy improves for high and . As described in sect. 5 the jet response is not fully simulated, but approximated assuming perfect pattern recognition and a calorimetric resolution of 35%/. As the main factor is the finding of the jet, assuming a worse calorimetric resolution of 50%/ does not alter the results much at this point. However, this needs further study before the requirements on the calorimeter can be relaxed.
The mean of the ratio between reconstructed and generated as given in the lower plot of Fig. 35 shows the effectiveness of the cone jet algorithm over a wide range in and . At large and the jet energy and thus is underestimated. However, the effect is small compared to the overestimation that would result from the use of the KT jet-finding algorithm. The latter would destroy a possible measurement without systematic corrections and in any case limits the range of a possible measurement in a much more stringent way.
The resolutions in and x were used to define bins for the extraction of . was reconstructed using the electron method, and the binning was therefore chosen to be the same as for the small-x analysis given earlier. The binning in x was fixed to be . This was possible since the resolution in x is approximately constant at large .
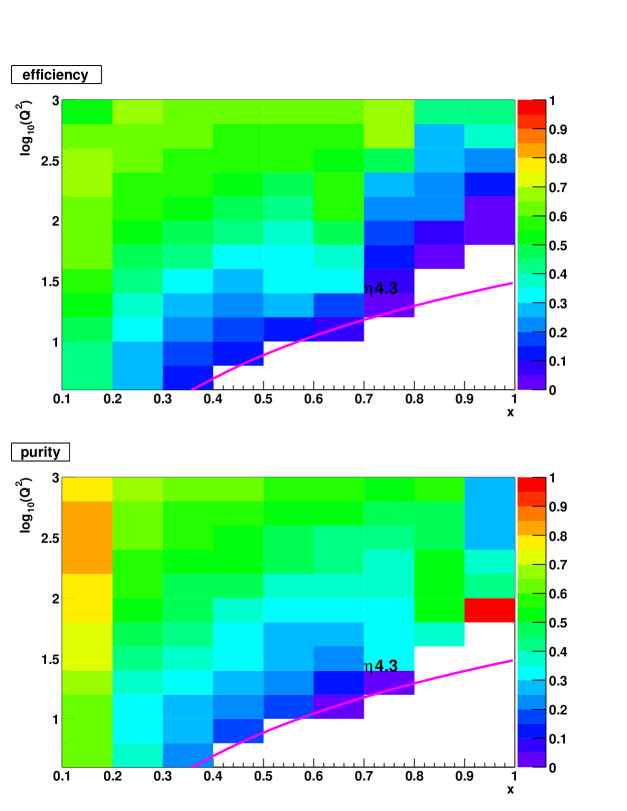
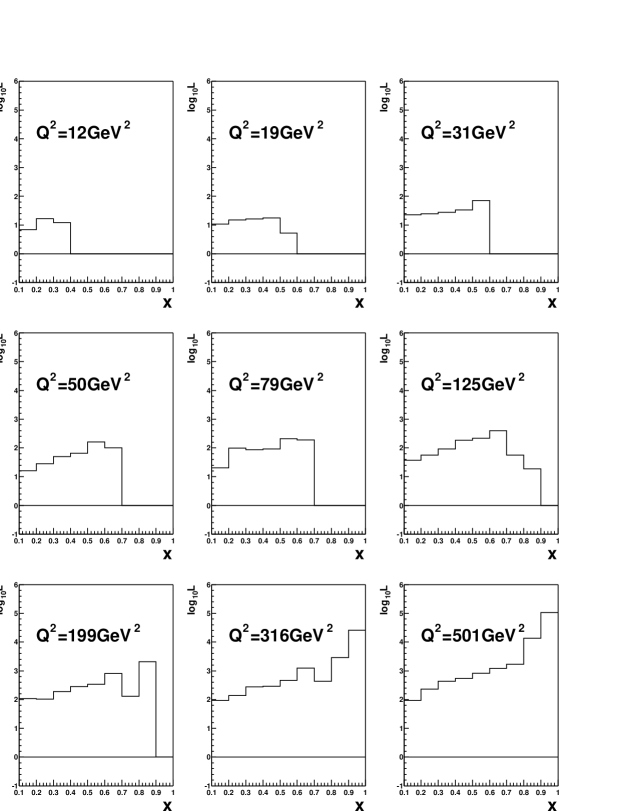
The efficiencies and purities are computed and depicted in Fig. 36. We consider bins with efficiency and purity above 20 % as usable. The systematic errors considered are the same ones as used at low in sect. 7.2.3 plus an additional uncertainty in the transverse alignment of the forward calorimeter of 1 cm. The extracted is given in Fig. 37. A total luminosity of 100 pb-1 is assumed. The extension in range to larger as increases follows the limitations due to the lack of available MC events at above 4. The detector is able to use the full MC accessible phase-space. At high and the measurement is limited by the luminosity, not by systematic errors. Fig. 38 shows the luminosity required to bring down the statistical errors to level of the systematic ones. For medium [middle plots] the 100 pb-1 assumed in this study are quite sufficient. For higher [bottom plots] and a tenfold luminosity of 1 fb-1 would be required. For an additional one or two orders of magnitude increase in luminosity are needed depending on .
7.6 Summary
Beam energies of 10 GeV for the electrons and 200 GeV for the protons allow an interesting measurement of the structure function in the transition region of around 1 GeV2 and down to very low and . An integrated luminosity of 100 pb-1 is sufficient. The systematic errors can easily be controlled so that a 2 % measurement of is possible. The material budget in the detector is of utmost importance in this. It seems advisable to consider a roman pot system for the very backward part [electron hemisphere] of the tracker in order to enlarge the accessible part of the and plane.
Assuming an additional 100 pb-1 of integrated luminosity with a proton beam energy of 100 GeV a measurement of at low and low becomes possible. The precision is such that different models can be tested. The measurement can profit from a further reduction of the systematic errors and additional beam energies.
The detector has acceptance for jets with a pseudo-rapidity up to which is beyond the area currently accessible with Monte Carlo generators. The phase-space currently covered by Monte Carlo [4] yields measurements of at up to 0.6 for down to 15 GeV2. For of several hundred GeV2 it is possible to reach above 0.9. At these high x and values, the measurements will be limited by statistics up to about 100 fb-1. However, 1 fb-1 opens a wide range up to of 0.9 and GeV2.
8 Summary, scope and time scale
Physics summary
Building an electron accelerator to collide electrons with protons [ions] from the existing RHIC accelerator would yield valuable information on the high energy limit of strong interactions. The highlights of the program are seen as precision measurements of the structure functions and , measurements of forward jet and particle production in small events in an extended rapidity range and measurements of exclusive processes, in particular at high . These measurements should be performed for protons, deuterons, and at least one heavy nucleus. A new detector optimized for this physics program would greatly enhance the kinematic range covered today by H1 and ZEUS. Precision measurements of would be possible in a continuous way across the parton-to-hadron transition region, where current data are sparse but very interesting. would also be measureable with good statistics up to for GeV2, which to date is a completely unexplored region. would be measured directly in the region of greatest interest, GeV2, where we currently have large theoretical uncertainties. Exclusive vector meson production and DVCS could be studied across the full range and up to high , thereby allowing a much higher precision determination of the energy dependence of the cross sections, and a three-dimensional mapping of hadrons down to small impact parameters. The study of forward jet production and particle production over a wide range of pseudorapidities (up to , compared to at H1, ZEUS) would allow stringent tests of our understanding of radiation processes in QCD, as well as show us where collective phenomena become important. Performing these measurements for the first time on deuterons would allow us to test the universality of parton distributions at small , as well as allow an extraction of individual parton densities at high . Scattering on a heavy nuclei would test the onset of saturation effects, with the possible discovery of the color glass condensate. The data would also be invaluable for the interpretation of heavy ion scattering experiments. It is clear to us that this program is critical for the further development of our understanding of strong interaction physics.
New detector summary
The major subcomponents of the proposed detector are
-
•
the precision tracking system;
-
•
the electromagnetic calorimeter;
-
•
the forward hadronic calorimeter;
-
•
the dipole magnet and beampipe.
In addition, we foresee the need for a photon calorimeter downstream in the electron direction, and several small detectors in the proton beam direction:
-
•
a proton remnant tagger at m;
-
•
a forward neutron calorimeter;
-
•
a forward proton calorimeter.
The scale of the experiment is intermediate between a typical fixed target experiment and a typical collider experiment. A first, crude, estimate of the cost is MEuro, approximately evenly divided between the tracking system, the electromagnetic calorimeter, and the beamline (including the dipole). This estimate assumes the hadron calorimeter would come from other sources.
We would aim to complete the design and construction of the detector within six years. A possible schedule would therefore be as follows:
- T0+1 year
-
Letter of intent and technical proposal;
- T0+3 years
-
Detailed detector design and R&D;
- T0+5 years
-
Detector construction;
- T0+6 years
-
Detector commissioning and operation.
The small (or high energy) physics opened up by HERA should now be pursued with a new round of experiments. Many key measurements could not be carried out with H1 and ZEUS, as these detectors were designed for a different physics. Other important measurements require the addition of nuclei to be carried out. A dedicated experiment optimized for this physics would significantly enhance our understanding of QCD in its high energy limit, and possibly open the way to a complete revision of our ideas on the strong interactions. The eRHIC facility would be well suited for the measurement program described in this document.
References
- [1] see http://www.phenix.bnl.gov/WWW/publish/abhay/Home_of_EIC/
- [2] L. McLerran and R. Venugopalan, Phys.Rev.D59:094002, 1999.
- [3] H. Abramowitcz et al. A New Experiment for the HERA Collider, Expression of Interest, DESY-PRC-03-01, Apr 2003. 57pp, MPP-2003-62, MPI-PhE/2003-06.
- [4] A. D. Martin, R. G. Roberts, W. J. Stirling and R. S. Thorne, Eur. Phys. J. C 23 (2002) 73 [arXiv:hep-ph/0110215].
- [5] S. Chekanov et al. [ZEUS Collaboration], Phys. Rev. D 67 (2003) 012007 [arXiv:hep-ex/0208023].
- [6] C. Adloff et al., [H1 Collaboration], Eur. Phys. J. C21 (2001) 33.
- [7] B. Abbott et al. [D0 Collaboration], Phys. Rev. Lett. 86 (2001) 1707 [arXiv:hep-ex/0011036].
- [8] T. Affolder et al. [CDF Collaboration], Phys. Rev. D 64 (2001) 032001 [Erratum-ibid. D 65 (2002) 039903] [arXiv:hep-ph/0102074].
- [9] S. Catani, Z. Phys. C 70, 263 (1996) [arXiv:hep-ph/9506357] Z. Phys. C 75, 665 (1997) [arXiv:hep-ph/9609263].
- [10] R. Thorne, “Measurements of at HERA-III”, presentated at the HERA-III Workshop, “The New Frontier in Precision Lepton-Nucleon Physics”, Muenich, December 2003.
-
[11]
M. Gluck and E. Reya,
Phys. Lett. B 83 (1979) 98;
R. S. Thorne and R. G. Roberts, Phys. Rev. D 57 (1998) 6871 [arXiv:hep-ph/9709442]. - [12] E. Levin, Mini-rapporteur talk at EPS91, Geneva,DESY 91-110; Review talk at DIS94, Eilat, 1994, in the proceedings and Fermilab-conf-98/068-T.
- [13] J. Bartels and C. Bontus, Phys. Rev. D 61, 034009 (2000) [arXiv:hep-ph/9906308]; J. Bartels, K. Golec-Biernat and K. Peters, Eur. Phys. J. C 17, 121 (2000) [arXiv:hep-ph/0003042].
- [14] For a review see M. F. McDermott, arXiv:hep-ph/0008260, and references therein.
- [15] K. Golec-Biernat and M. Wusthoff, Phys. Rev. D 59 (1999) 014017 [arXiv:hep-ph/9807513].
- [16] H1 Collab., “A New Measurement of the Deep Inelastic Scattering Cross Section and of at Low and Bjorken- at HERA “, H1prelim-01-041.
- [17] E. L. Berger and S. J. Brodsky, Phys. Rev. Lett. 42 (1979) 940; Y. L. Dokshitzer, G. Marchesini and B. R. Webber, Nucl. Phys. B 469 (1996) 93 [arXiv:hep-ph/9512336]; E. Stein, M. Maul, L. Mankiewicz and A. Schafer, Nucl. Phys. B 536 (1998) 318 [arXiv:hep-ph/9803342].
- [18] J.-R. Cudell, K. Kang and S.K. Kim, Phys. Lett. B395 (1997) 311.
- [19] For recent discussions, please see the Proceedings of the DIS04 Workshop.
- [20] Arik Kreisel, Private communication. See also, Arik Kreisel, PhD Thesis, Tel Aviv University (2004), in preparation.
- [21] M.W. Krasny contribution to “Future Physics at HERA”, Proc. Workshop, DESY 1996/97, Ed.s G. Ingelman, A. De Roeck and R. Klanner.
- [22] C. Bauer et al. The HERA-B Vertex Detector System, Nucl. Inst.& Meth. A453(2000) 103-108
- [23] P. Gorodetzky et al., NIM A361 (1995) 161; N. Akchurin et al., NIM A399 (1997) 202.
- [24] P.Nevski An interactive tool for GEANT ATLAS software note 002, 1994
- [25] H. Abramowicz and A. Levy, DESY Report 97-251 (1997).