Quarkonia production with the HERA   B experiment

Joachim Spengler for the HERA   B collaboration111Talk given at the Quark Matter 2004 Max-Planck-Institut für Kernphysik, Postfach 103989, 69029 Heidelberg, Germany joachim.spengler@desy.de
Abstract

Measurements of the dependence of the J/ψJ𝜓\mathrm{J}\mskip-2.0mu/\mskip-2.0mu\psi production cross section on its kinematic variables as well as on the target atomic numbers for 920 GeV/c protons incident on different targets have been made with the HERA   B  detector. The large collected di-lepton sample allows to study the production ratio of ψ(2S)𝜓2S\mathrm{\psi(2S)} to J/ψJ𝜓\mathrm{J}\mskip-2.0mu/\mskip-2.0mu\psi  and of χcsubscript𝜒c\mathrm{\chi_{c}}  to J/ψJ𝜓\mathrm{J}\mskip-2.0mu/\mskip-2.0mu\psi. We also report on measurements of the bb¯b¯b\mathrm{b\overline{b}} and ΥΥ\mathrm{\Upsilon} production cross section.

pacs:
25.40.Ep, 13.20.Gd, 13.85.Qk, 12.39.-x
: J. Phys. G: Nucl. Phys.

1 Introduction

HERA   B is a fixed-target experiment which studies collisions of protons with the nuclei of atoms in target wires positioned in the halo of HERA’s 920 GeV proton beam. The large acceptance of the HERA   B spectrometer coupled with high-granularity particle-identification devices and a precision vertex detector allow for detailed studies of complex multi-particle final states. HERA   B’s sophisticated di-lepton trigger is capable of finding rare interactions containing two leptons coming, for example, from the decay of a J/ψJ𝜓\mathrm{J}\mskip-2.0mu/\mskip-2.0mu\psi amidst an overwhelming background of more ordinary proton-nucleus interactions. By using target wires made from a variety of materials (carbon, aluminum, titanium and tungsten) HERA   B is able to study the dependence of various properties of proton-nucleus interactions as a function of atomic number.

Analysis of modest data samples which had been taken in the commissioning run of year 2000 was completed by early 2003 and led to publications on the bb¯b¯b\mathrm{b\overline{b}} cross section [1], the ratio of χcsubscript𝜒c\mathrm{\chi_{c}} to J/ψJ𝜓\mathrm{J}\mskip-2.0mu/\mskip-2.0mu\psi production cross sections [2] and on the production cross sections of Λ0superscriptΛ0\Lambda^{0} and Ks0subscriptsuperscriptK0𝑠\mathrm{K}^{0}_{s} [3].

During the HERA run which began in Summer 2002 and ended in March 2003, HERA   B accumulated 150 million events with its di-lepton trigger. The di-lepton sample includes 300,000 events with a J/ψJ𝜓\mathrm{J}\mskip-2.0mu/\mskip-2.0mu\psi in the final state, roughly equally divided between di-muon and di-electron decays. This sample is more than 50 times larger than the sample accumulated in the 2000 run, but thanks to the large number of improvements in detector and trigger systems could be recorded in a similar amount of beam time. Thanks to improvements in the data acquisition system, recording rates of a 1000 events per second (more than 1 Terabyte per day) for minimum bias data were achieved which allowed collection of a 200 million events minimum bias sample in just one week of calendar time. This represents an increase in sample size by more than a factor of 100 with respect to the 2000 run. Having successfully accumulated these interesting data samples, the HERA   B Collaboration decided in early 2003 to definitively finish data-taking activities at the end of running period and to concentrate on analyzing the accumulated data. Several studies are in progress on both the di-lepton and the minimum bias samples.

2 Preliminary results

2.1 The Di-lepton sample
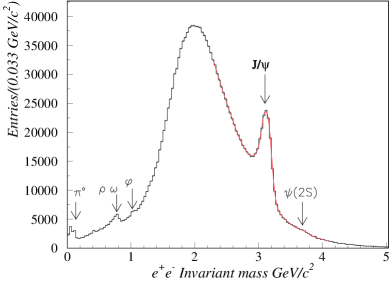
The μ+μsuperscript𝜇superscript𝜇\mu^{+}\mu^{-} invariant mass plot from 80% of the full sample is shown in Fig. 1. A prominent peak containing 150,000 di-muon pairs at the mass of the J/ψJ𝜓\mathrm{J}\mskip-2.0mu/\mskip-2.0mu\psi is seen. Other features of the plot include peaks at the masses of the ψ(2S)𝜓2S\mathrm{\psi(2S)} , the ϕ(1020)italic-ϕ1020\phi(1020), the ω(782)𝜔782\omega(782) and the ρ(770)𝜌770\rho(770). The same features, although at lower resolution due to the bremsstrahlung emitted by the electrons, can be seen in the e+esuperscriptesuperscripte\mathrm{e}^{+}\mathrm{e}^{-} mass plot shown in Fig. 1. The J/ψJ𝜓\mathrm{J}\mskip-2.0mu/\mskip-2.0mu\psi \mskip 3.0mu\rightarrow\mskip 5.0mu e+esuperscriptesuperscripte\mathrm{e}^{+}\mathrm{e}^{-} peak contains 100,000 events.

Refer to caption
Refer to caption
Figure 1: The μ+μsuperscript𝜇superscript𝜇\mu^{+}\mu^{-} (left) and e+esuperscriptesuperscripte\mathrm{e}^{+}\mathrm{e}^{-} (right) invariant mass spectrum.

2.2 Differential distributions of J/ψJ𝜓\mathrm{J}\mskip-2.0mu/\mskip-2.0mu\psi 

The large data sample in connection with the large acceptance of the HERA   B  spectrometer allows for a precise determination of the kinematical distributions of J/ψJ𝜓\mathrm{J}\mskip-2.0mu/\mskip-2.0mu\psi. The pTsubscript𝑝Tp_{\mathrm{T}}-distribution is plotted Fig. 3 for 80% of the e+esuperscriptesuperscripte\mathrm{e}^{+}\mathrm{e}^{-}sample. Note the wide range of up to 4.8 GeV/c in transverse momentum.
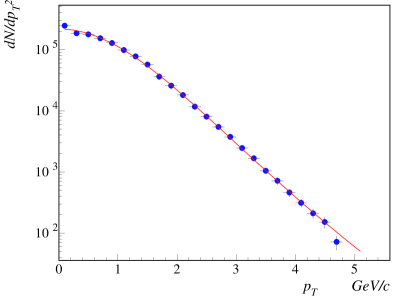
Refer to caption
Figure 2: The pTsubscript𝑝Tp_{\mathrm{T}} distribution of J/ψJ𝜓\mathrm{J}\mskip-2.0mu/\mskip-2.0mu\psi \mskip 3.0mu\rightarrow\mskip 5.0mu e+esuperscriptesuperscripte\mathrm{e}^{+}\mathrm{e}^{-}  .
Refer to caption
Figure 3: The xFsubscript𝑥Fx_{\mathrm{F}} distribution of J/ψJ𝜓\mathrm{J}\mskip-2.0mu/\mskip-2.0mu\psi \mskip 3.0mu\rightarrow\mskip 5.0mu e+esuperscriptesuperscripte\mathrm{e}^{+}\mathrm{e}^{-}  .

The average pTsubscript𝑝Tp_{\mathrm{T}}  is determined by fitting the following expression to the data

dσdpT2=β[1+(35πpT256<pT>)2]6.𝑑𝜎𝑑superscriptsubscript𝑝T2𝛽superscriptdelimited-[]1superscript35𝜋subscript𝑝T256expectationsubscript𝑝T26\frac{d\sigma}{d\mbox{$p_{\mathrm{T}}$}^{2}}=\beta\cdot\left[1+\left(\frac{35\cdot\pi\cdot\mbox{$p_{\mathrm{T}}$}}{256\;\cdot<\mbox{$p_{\mathrm{T}}$}>}\right)^{2}\right]^{-6}.

The outcome of this analysis can be found in Table 1. The HERA   B data confirm the well known trend of pTsubscript𝑝Tp_{\mathrm{T}}-broadening with increasing atomic number as it was reported during this conference for example by Phenix [4].
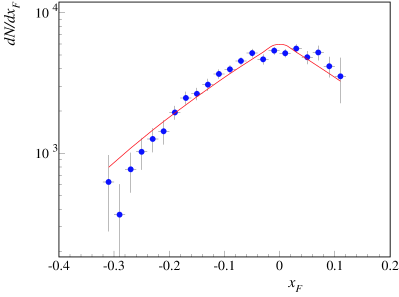
Table 1: Average transverse momentum of J/ψJ𝜓\mathrm{J}\mskip-2.0mu/\mskip-2.0mu\psi. For the HERA   B results only statistical errors are given.
  • Target Exp. Range in pTsubscript𝑝Tp_{\mathrm{T}} <pT>expectationsubscript𝑝T<p_{\mathrm{T}}>(e±superscripteplus-or-minus\mathrm{e}^{\pm}) <pT>expectationsubscript𝑝T<p_{\mathrm{T}}>(μ±superscript𝜇plus-or-minus\mu^{\pm}) error
    C 920 Hera-B \leq 4.8 1.22 1.22 0.01
    W 920 Hera-B \leq 4.8 1.29 1.29 0.01
    Si 800 E771 [5] \leq 3.5 1.20 0.01
    Au 800 E789 [6] \leq 2.6 1.29 0.009

The range in xFsubscript𝑥Fx_{\mathrm{F}}  of J/ψJ𝜓\mathrm{J}\mskip-2.0mu/\mskip-2.0mu\psi  which is accessible with the HERA   B  detector can be seen from Fig. 3. It is for the first time that J/ψJ𝜓\mathrm{J}\mskip-2.0mu/\mskip-2.0mu\psi-production can be measured in the backward region. However, due to still ongoing acceptance calculations, only a small fraction of about 10% of the e+esuperscriptesuperscripte\mathrm{e}^{+}\mathrm{e}^{-} sample is shown in this plot. In order to compare this distribution with other results, the expression

dσdxF=β(1|xF|)c𝑑𝜎𝑑subscript𝑥F𝛽superscript1subscript𝑥F𝑐\frac{d\sigma}{d\mbox{$x_{\mathrm{F}}$}}=\beta\cdot(1-|\mbox{$x_{\mathrm{F}}$}|)^{c}

was fitted to our data. For the time being, only a range for the slope c can be quoted (see Table 2).

Table 2: Exponent c of xFsubscript𝑥Fx_{\mathrm{F}}  distribution of J/ψJ𝜓\mathrm{J}\mskip-2.0mu/\mskip-2.0mu\psi. For the HERA   B  results only statistical errors are given.
  • Target Exp. Range in xFsubscript𝑥Fx_{\mathrm{F}} c(e±superscripteplus-or-minus\mathrm{e}^{\pm}) c(μ±superscript𝜇plus-or-minus\mu^{\pm}) error
    C, W 920 Hera-B -0.35 \leq xFsubscript𝑥Fx_{\mathrm{F}}\leq 0.15 5 - 6.5 0.3
    Si 800 E771 [5] -0.05 \leq xFsubscript𝑥Fx_{\mathrm{F}}\leq 0.25 6.54 0.23
    Au 800 E789 [6] -0.03 \leq xFsubscript𝑥Fx_{\mathrm{F}}\leq 0.13 4.91 0.18
    Cu 800 E789 [7] 0.30 \leq xFsubscript𝑥Fx_{\mathrm{F}}\leq 0.95 5.21 0.04

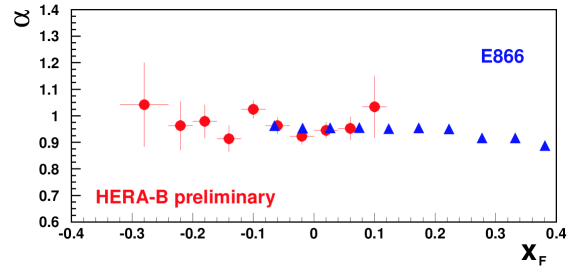
Due to the simultaneously recorded data sets with carbon and tungsten target, HERA   B is well suited to study the A-dependence of J/ψJ𝜓\mathrm{J}\mskip-2.0mu/\mskip-2.0mu\psi-production, which is usually parametrized as

σpA=σpNAα;α=1log(AW/AC)log(NWNCCWϵCϵW).formulae-sequencesubscript𝜎𝑝𝐴subscript𝜎𝑝𝑁superscript𝐴𝛼𝛼1𝑙𝑜𝑔subscript𝐴𝑊subscript𝐴𝐶𝑙𝑜𝑔subscript𝑁𝑊subscript𝑁𝐶subscript𝐶subscript𝑊subscriptitalic-ϵ𝐶subscriptitalic-ϵ𝑊\sigma_{pA}=\sigma_{pN}\cdot A^{\alpha};\;\;\alpha=\frac{1}{log(A_{W}/A_{C})}\cdot log\left(\frac{N_{W}}{N_{C}}\frac{\mathcal{L}_{C}}{\mathcal{L}_{W}}\frac{\epsilon_{C}}{\epsilon_{W}}\right).

Thus the measurement of α𝛼\alpha requires the ratio of the number of observed J/ψJ𝜓\mathrm{J}\mskip-2.0mu/\mskip-2.0mu\psi ’s, the ratio of luminosities (C,Wsubscript𝐶𝑊\mathcal{L}_{C,W}) and the ratio of the reconstruction efficiencies (ϵC,Wsubscriptitalic-ϵ𝐶𝑊\epsilon_{C,W}) for the two different target materials. Up to now, the absolute ratio of luminosities is still under evaluation. Therefore our data points, determined from 25% of the e+esuperscriptesuperscripte\mathrm{e}^{+}\mathrm{e}^{-} sample (see Fig. 4), were normalized to the E866 result [8] in the overlap region of the xFsubscript𝑥Fx_{\mathrm{F}}  distribution.

Refer to caption
Figure 4: α𝛼\alpha versus xFsubscript𝑥Fx_{\mathrm{F}}  for J/ψJ𝜓\mathrm{J}\mskip-2.0mu/\mskip-2.0mu\psi. The HERA   B  points were normalized to the E866 data in the region of overlap.

2.3 Production ratio of ψ(2S)𝜓2S\mathrm{\psi(2S)} to J/ψJ𝜓\mathrm{J}\mskip-2.0mu/\mskip-2.0mu\psi 

A precise measurement of the ψ(2S)𝜓2S\mathrm{\psi(2S)} cross section allows to test the importance of color octet production channels [9]. Analyzing 30% of the e+esuperscriptesuperscripte\mathrm{e}^{+}\mathrm{e}^{-}  data sample (Carbon target), a clear ψ(2S)𝜓2S\mathrm{\psi(2S)} peak can be seen in Fig. 6. In order to minimize systematic uncertainties, the following ratio
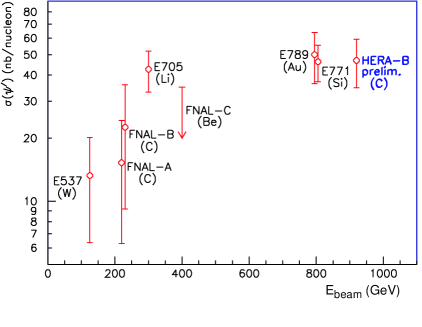
Rψ(2S)=σ(ψ(2S))σ(J/ψ)=n(ψ(2S))n(J/ψ)Br(J/ψe+e)Br(ψ(2S)e+e)ϵ(J/ψ)ϵ(ψ(2S))subscript𝑅𝜓2S𝜎𝜓2S𝜎J𝜓𝑛𝜓2S𝑛J𝜓𝐵𝑟J𝜓superscriptesuperscripte𝐵𝑟𝜓2Ssuperscriptesuperscripteitalic-ϵJ𝜓italic-ϵ𝜓2SR_{\mbox{$\mathrm{\psi(2S)}$}\ }=\frac{\sigma(\mbox{$\mathrm{\psi(2S)}$}\ )}{\sigma(\mbox{$\mathrm{J}\mskip-2.0mu/\mskip-2.0mu\psi$}\ )}=\frac{n(\mbox{$\mathrm{\psi(2S)}$}\ )}{n(\mbox{$\mathrm{J}\mskip-2.0mu/\mskip-2.0mu\psi$}\ )}\cdot\frac{Br(\mbox{$\mathrm{J}\mskip-2.0mu/\mskip-2.0mu\psi$}\ \mbox{$\mskip 3.0mu\rightarrow\mskip 5.0mu$}\ \mbox{$\mathrm{e}^{+}\mathrm{e}^{-}$}\ )}{Br(\mbox{$\mathrm{\psi(2S)}$}\ \mbox{$\mskip 3.0mu\rightarrow\mskip 5.0mu$}\ \mbox{$\mathrm{e}^{+}\mathrm{e}^{-}$}\ )}\cdot\frac{\epsilon(\mbox{$\mathrm{J}\mskip-2.0mu/\mskip-2.0mu\psi$}\ )}{\epsilon(\mbox{$\mathrm{\psi(2S)}$}\ )}

is determined. We obtain a result of Rψ(2S)=0.13±0.02subscript𝑅𝜓2Splus-or-minus0.130.02R_{\mbox{$\mathrm{\psi(2S)}$}\ }=0.13\pm 0.02 which is in good agreement with the result of the Muon channel. For the time being, no systematic error can be quoted because studies are ongoing. Based on results of E771 [10] and E789 [11], we use Rψ(2S)=(357±8±27)subscript𝑅𝜓2Splus-or-minus357827R_{\mbox{$\mathrm{\psi(2S)}$}\ }=(357\pm 8\pm 27) nb/nucleon [1] to determine the ψ(2S)𝜓2S\mathrm{\psi(2S)} production cross section σ(ψ(2S))=(46±12)𝜎𝜓2Splus-or-minus4612\sigma(\mbox{$\mathrm{\psi(2S)}$})=(46\pm 12) nb/nucleon. This preliminary value is shown in Fig. 6 together with results of other experiments.

Refer to caption
Figure 5: The e+esuperscriptesuperscripte\mathrm{e}^{+}\mathrm{e}^{-} invariant mass spectrum.
Refer to caption
Figure 6: The ψ(2S)𝜓2S\mathrm{\psi(2S)} cross section as function of the proton beam energy.

2.4 Production ratio of χcsubscript𝜒c\mathrm{\chi_{c}} to J/ψJ𝜓\mathrm{J}\mskip-2.0mu/\mskip-2.0mu\psi 

A measurement of the production ratio of χcsubscript𝜒c\mathrm{\chi_{c}} to J/ψJ𝜓\mathrm{J}\mskip-2.0mu/\mskip-2.0mu\psi will help to choose between models [12, 13, 14, 15] attempting to describe the production of quarkonium states. Using the year-2000 data set, HERA   B measured the fraction of J/ψJ𝜓\mathrm{J}\mskip-2.0mu/\mskip-2.0mu\psi coming from χcsubscript𝜒c\mathrm{\chi_{c}} decays

Rχc=i=12σ(χci)Br(χciJ/ψγ)σ(J/ψ)=n(χc)n(J/ψ)ϵ(J/ψ)ϵ(χc)ϵ(γ)subscript𝑅subscript𝜒csuperscriptsubscript𝑖12𝜎subscript𝜒ci𝐵𝑟subscript𝜒ciJ𝜓𝛾𝜎J𝜓𝑛subscript𝜒c𝑛J𝜓italic-ϵJ𝜓italic-ϵsubscript𝜒citalic-ϵ𝛾R_{\mbox{$\mathrm{\chi_{c}}$}\ }=\frac{\sum_{i=1}^{2}\sigma(\mbox{$\mathrm{\chi_{ci}}$}\ )\cdot Br(\mbox{$\mathrm{\chi_{ci}}$}\ \mbox{$\mskip 3.0mu\rightarrow\mskip 5.0mu$}\ \mbox{$\mathrm{J}\mskip-2.0mu/\mskip-2.0mu\psi$}\ \gamma)}{\sigma(\mbox{$\mathrm{J}\mskip-2.0mu/\mskip-2.0mu\psi$}\ )}=\frac{n(\mbox{$\mathrm{\chi_{c}}$}\ )}{n(\mbox{$\mathrm{J}\mskip-2.0mu/\mskip-2.0mu\psi$}\ )}\cdot\frac{\epsilon(\mbox{$\mathrm{J}\mskip-2.0mu/\mskip-2.0mu\psi$}\ )}{\epsilon(\mbox{$\mathrm{\chi_{c}}$})\cdot\epsilon(\gamma)}

based on 380±74plus-or-minus38074380\pm 74 reconstructed χcsubscript𝜒c\mathrm{\chi_{c}}  mesons to be Rχc=0.32±0.06±0.04subscript𝑅subscript𝜒cplus-or-minus0.320.060.04R_{\mbox{$\mathrm{\chi_{c}}$}}=0.32\pm 0.06\pm 0.04 [2] which is in good agreement with the NRQCD calculations [14]. The state χc0subscript𝜒c0\mathrm{\chi_{c0}}  was neglected due to its small branching ratio. Fig. 7 shows the mass difference Δm=m(l+lγ)m(l+l)Δmmsuperscriptlsuperscriptl𝛾msuperscriptlsuperscriptl\mathrm{\Delta m=m(l^{+}l^{-}\gamma)-m(l^{+}l^{-})} for 15% of the μ+μsuperscript𝜇superscript𝜇\mu^{+}\mu^{-}  data sample recorded during the 2002/03 period. For the full sample over 10,000 reconstructed χcsubscript𝜒c\mathrm{\chi_{c}} mesons are expected in both final states which will lead to a much more precise measurement.

Refer to caption
Refer to caption
Figure 7: Spectrum of the mass difference Δm=m(l+lγ)m(l+l)Δmmsuperscriptlsuperscriptl𝛾msuperscriptlsuperscriptl\mathrm{\Delta m=m(l^{+}l^{-}\gamma)-m(l^{+}l^{-})} before (left) and after subtraction (right) of the combinatorial background.

2.5 bb¯b¯b\mathrm{b\overline{b}} Cross Section

A precise measurement of the b cross section in hadronic interactions at fixed target energies would be welcome in part as a test of calculations, in part to give guidance for setting the parameters of the theory [16, 17].

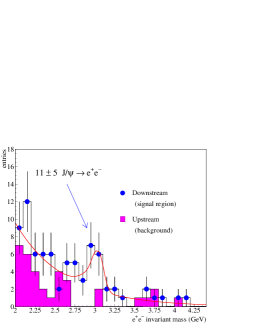
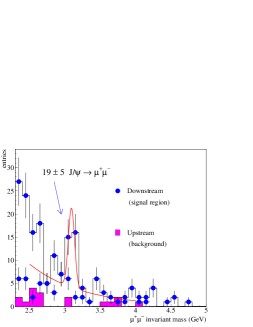
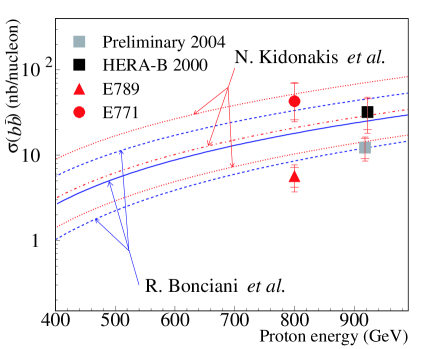
The principle of the HERA   B B cross section determination is to measure the rate of J/ψJ𝜓\mathrm{J}\mskip-2.0mu/\mskip-2.0mu\psi’s which originate typically 1 cm downstream of the target and compare it to the rate of directly produced J/ψJ𝜓\mathrm{J}\mskip-2.0mu/\mskip-2.0mu\psi’s. Using this technique and the data collected during the year-2000 running period, a total bb¯b¯b\mathrm{b\overline{b}}  production cross section of σ(bb¯)=(32±13±6)𝜎b¯bplus-or-minus32136\sigma(\mbox{$\mathrm{b\overline{b}}$})=(32\pm 13\pm 6) nb/nucleon was derived. The much larger new sample will allow a considerably more precise measurement. Fig. 8 shows the e+esuperscriptesuperscripte\mathrm{e}^{+}\mathrm{e}^{-} (left) and μ+μsuperscript𝜇superscript𝜇\mu^{+}\mu^{-} (right) invariant mass spectra from 35% of the data sample after applying vertex cuts to suppress the directly-produced J/ψJ𝜓\mathrm{J}\mskip-2.0mu/\mskip-2.0mu\psi’s. The downstream samples clearly show the J/ψJ𝜓\mathrm{J}\mskip-2.0mu/\mskip-2.0mu\psi but not the upstream samples. For the full sample we expect approximately 100 J/ψJ𝜓\mathrm{J}\mskip-2.0mu/\mskip-2.0mu\psi’s from b decay. Cut optimization and systematic studies are underway. A preliminary estimate of the cross section/nucleon, which is 1.5σ1.5𝜎1.5\sigma below the 2000 result, is shown in Fig. 10 together with the results of E771 [10] and E789 [11]. The latest QCD calculations [16, 17] are indicated by their central values as well as upper and lower bounds.

Refer to caption
Refer to caption
Figure 8: Invariant mass distribution of e+esuperscriptesuperscripte\mathrm{e}^{+}\mathrm{e}^{-}(left) and μ+μsuperscript𝜇superscript𝜇\mu^{+}\mu^{-}-pairs (right) after application of vertex cuts. Points with error bars: lepton pairs downstream of the vertex. Shaded histogram: lepton pairs which, due to finite measurement resolution, appear to originate upstream of the main interaction point.
Refer to caption
Figure 9: Comparison of the HERA   B results of 2000 and 2004 with other experiments and theoretical predictions.
Refer to caption
Figure 10: Brdσdy|y=0evaluated-at𝐵𝑟𝑑𝜎𝑑𝑦𝑦0Br\cdot\frac{d\sigma}{dy}|_{y=0} for ΥΥ\mathrm{\Upsilon} production as function of the center-of-mass energy. The fit to the data is described in the text.

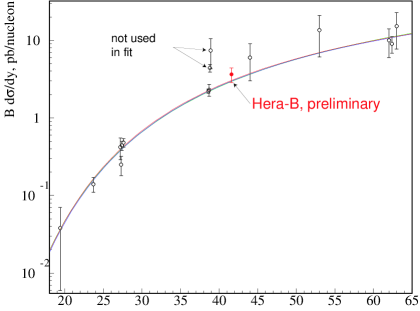
2.6 Production cross section of ΥΥ\mathrm{\Upsilon} 

In order to search for ΥΥ\mathrm{\Upsilon}-mesons, both C and W data samples were combined assuming an A-dependence of α=1𝛼1\alpha=1. As can be seen in Fig. 11, an ΥΥ\mathrm{\Upsilon}-signal is visible in both μ+μsuperscript𝜇superscript𝜇\mu^{+}\mu^{-} and e+esuperscriptesuperscripte\mathrm{e}^{+}\mathrm{e}^{-} final states. The shape of the signals was derived from a Monte Carlo simulation with the relative production rates of the three ΥΥ\mathrm{\Upsilon}-states fixed on E605 [18] data. The background is described by a term for the combinatorial background and a Drell-Yan term dominating at high invariant masses.

Refer to caption
Refer to caption
Figure 11: The μ+μsuperscript𝜇superscript𝜇\mu^{+}\mu^{-} (left) and e+esuperscriptesuperscripte\mathrm{e}^{+}\mathrm{e}^{-} (right) invariant mass spectrum.

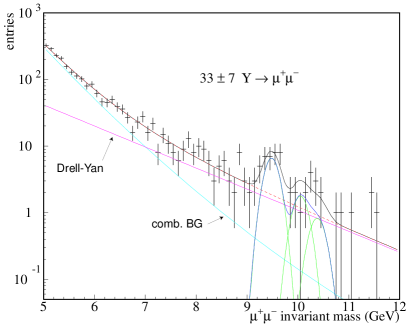
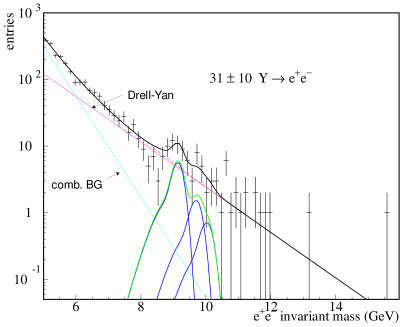
As for the previous analyses, the cross section is determined relative to the J/ψJ𝜓\mathrm{J}\mskip-2.0mu/\mskip-2.0mu\psi cross section:

σΥ=σ(J/ψ)n(Υ)n(J/ψ)Br(J/ψ+)Br(Υ+)ϵ(J/ψ)ϵ(Υ)subscript𝜎Υ𝜎J𝜓𝑛Υ𝑛J𝜓𝐵𝑟J𝜓superscriptsuperscript𝐵𝑟Υsuperscriptsuperscriptitalic-ϵJ𝜓italic-ϵΥ\sigma_{\mbox{$\mathrm{\Upsilon}$}\ }=\sigma(\mbox{$\mathrm{J}\mskip-2.0mu/\mskip-2.0mu\psi$}\ )\cdot\frac{n(\mbox{$\mathrm{\Upsilon}$}\ )}{n(\mbox{$\mathrm{J}\mskip-2.0mu/\mskip-2.0mu\psi$}\ )}\cdot\frac{Br(\mbox{$\mathrm{J}\mskip-2.0mu/\mskip-2.0mu\psi$}\ \mbox{$\mskip 3.0mu\rightarrow\mskip 5.0mu$}\ \mbox{$\ell^{+}\ell^{-}$}\ )}{Br(\mbox{$\mathrm{\Upsilon}$}\ \mbox{$\mskip 3.0mu\rightarrow\mskip 5.0mu$}\ \mbox{$\ell^{+}\ell^{-}$}\ )}\cdot\frac{\epsilon(\mbox{$\mathrm{J}\mskip-2.0mu/\mskip-2.0mu\psi$}\ )}{\epsilon(\mbox{$\mathrm{\Upsilon}$})}

The results of both subsamples are in good agreement. We obtain a combined production cross section times branching ratio at mid-rapidity of Brdσdy|y=0=(3.4±0.8)evaluated-at𝐵𝑟𝑑𝜎𝑑𝑦𝑦0plus-or-minus3.40.8Br\cdot\frac{d\sigma}{dy}|_{y=0}=(3.4\pm 0.8) pb/N. In Fig. 10 the HERA   B  measurement is compared to the results of other experiments. The new point from HERA   B  will help to clarify the experimental situation which is controversial in the energy regime of ssimilar-to𝑠absent\sqrt{s}\sim 40 GeV. The energy dependence of the cross section can be described with the parameterization [19] Brdσdy|y=0=σ0exp(m0s)evaluated-at𝐵𝑟𝑑𝜎𝑑𝑦𝑦0subscript𝜎0subscript𝑚0𝑠Br\cdot\frac{d\sigma}{dy}|_{y=0}=\sigma_{0}\cdot\exp(-\frac{m_{0}}{\sqrt{s}}).

3 Summary

The final data taking period of the HERA   B experiment was used to accumulate 150 million events with its di-lepton trigger. These events were produced in pC and pW interactions of the 920 GeV proton beam of Hera. The di-lepton sample includes 300,000 events with a J/ψJ𝜓\mathrm{J}\mskip-2.0mu/\mskip-2.0mu\psi decaying into electon- or muon-pairs. Studies of the dependence of the J/ψJ𝜓\mathrm{J}\mskip-2.0mu/\mskip-2.0mu\psi production cross section on its kinematic variables as well as on the target atomic number were shown which turn to advantage the large acceptance in pTsubscript𝑝Tp_{\mathrm{T}} and the backward hemisphere. Preliminary results of the ψ(2S)𝜓2S\mathrm{\psi(2S)} to J/ψJ𝜓\mathrm{J}\mskip-2.0mu/\mskip-2.0mu\psi as well as χcsubscript𝜒c\mathrm{\chi_{c}} to J/ψJ𝜓\mathrm{J}\mskip-2.0mu/\mskip-2.0mu\psi production cross section ratios were shown. New results on measurements of the bb¯b¯b\mathrm{b\overline{b}} and ΥΥ\mathrm{\Upsilon} production cross section were also discussed.

References

References

  • [1] HERA   B Collaboration 2003 Eur.Phys.J. C 26 345
  • [2] HERA   B Collaboration 2003 Phys.Lett. B 561 61
  • [3] HERA   B Collaboration 2003 Eur.Phys.J. C 29 181
  • [4] de Cassagnac R G 2004 to be published in J. Phys. G Proceedings of Quark Matter 2004
  • [5] Alexopoulos T et al 1997 Phys.Rev. D 55 3927
  • [6] Schub M H et al 1995 Phys.Rev. D 52 1307
  • [7] Kowitt M S et al 1994 Phys.Rev.Lett. 72 1318
  • [8] Leich M J et al 2000 Phys.Rev.Lett. 84 3256
  • [9] Beneke M and Rothstein I Z 1996 Phys.Rev. D 54 2005
  • [10] Alexopoulos T et al 1999 Phys.Rev.Lett. 82 41
  • [11] Jansen D M et al 1995 Phys.Rev.Lett. 74 3118
  • [12] Baier R and Rückl R 1981 Phys.Lett. B 102 364; 1983 Z. Phys. C 19 251
  • [13] Bodwin G T, Braaten E and Lepage G P 1995 Phys.Rev. D 51 1125
  • [14] Cho P and Leibovich A 1996 Phys.Rev. D 53 6203
  • [15] Vogt R 2002 Nucl.Phys. A 700 539
  • [16] Bonciani R et al 1998 Nucl.Phys. B 529 424
  • [17] Kidonakis N et al 2001 Phys.Rev. D 64 114001
  • [18] Moreno G et al 1991 Phys.Rev. D 43 2815
  • [19] Craigie N S 1978 Phys.Rep. 47 1