CERN–EP/2003-071
4 November 2003
DELPHI Collaboration
Abstract
These final results on production cross-section measurements at LEP2 use data collected by the DELPHI detector at centre-of-mass energies up to 209 GeV. Measurements of total cross-sections, angular differential distributions and decay branching fractions, and the value of the CKM element are compared to the expectations of the Standard Model.
These results supersede all values previously published by DELPHI.
(Accepted by Eur. Phys. J. C)
J.Abdallah,
P.Abreu,
W.Adam,
P.Adzic,
T.Albrecht,
T.Alderweireld,
R.Alemany-Fernandez,
T.Allmendinger,
P.P.Allport,
U.Amaldi,
N.Amapane,
S.Amato,
E.Anashkin,
A.Andreazza,
S.Andringa,
N.Anjos,
P.Antilogus,
W-D.Apel,
Y.Arnoud,
S.Ask,
B.Asman,
J.E.Augustin,
A.Augustinus,
P.Baillon,
A.Ballestrero,
P.Bambade,
R.Barbier,
D.Bardin,
G.Barker,
A.Baroncelli,
M.Battaglia,
M.Baubillier,
K-H.Becks,
M.Begalli,
A.Behrmann,
E.Ben-Haim,
N.Benekos,
A.Benvenuti,
C.Berat,
M.Berggren,
L.Berntzon,
D.Bertrand,
M.Besancon,
N.Besson,
D.Bloch,
M.Blom,
M.Bluj,
M.Bonesini,
M.Boonekamp,
P.S.L.Booth,
G.Borisov,
O.Botner,
B.Bouquet,
T.J.V.Bowcock,
I.Boyko,
M.Bracko,
R.Brenner,
E.Brodet,
P.Bruckman,
J.M.Brunet,
L.Bugge,
P.Buschmann,
M.Calvi,
T.Camporesi,
V.Canale,
F.Carena,
N.Castro,
F.Cavallo,
M.Chapkin,
Ph.Charpentier,
P.Checchia,
R.Chierici,
P.Chliapnikov,
J.Chudoba,
S.U.Chung,
K.Cieslik,
P.Collins,
R.Contri,
G.Cosme,
F.Cossutti,
M.J.Costa,
D.Crennell,
J.Cuevas,
J.D’Hondt,
J.Dalmau,
T.da Silva,
W.Da Silva,
G.Della Ricca,
A.De Angelis,
W.De Boer,
C.De Clercq,
B.De Lotto,
N.De Maria,
A.De Min,
L.de Paula,
L.Di Ciaccio,
A.Di Simone,
K.Doroba,
J.Drees,
M.Dris,
G.Eigen,
T.Ekelof,
M.Ellert,
M.Elsing,
M.C.Espirito Santo,
G.Fanourakis,
D.Fassouliotis,
M.Feindt,
J.Fernandez,
A.Ferrer,
F.Ferro,
U.Flagmeyer,
H.Foeth,
E.Fokitis,
F.Fulda-Quenzer,
J.Fuster,
M.Gandelman,
C.Garcia,
Ph.Gavillet,
E.Gazis,
R.Gokieli,
B.Golob,
G.Gomez-Ceballos,
P.Goncalves,
E.Graziani,
G.Grosdidier,
K.Grzelak,
J.Guy,
C.Haag,
A.Hallgren,
K.Hamacher,
K.Hamilton,
S.Haug,
F.Hauler,
V.Hedberg,
M.Hennecke,
H.Herr,
J.Hoffman,
S-O.Holmgren,
P.J.Holt,
M.A.Houlden,
K.Hultqvist,
J.N.Jackson,
G.Jarlskog,
P.Jarry,
D.Jeans,
E.K.Johansson,
P.D.Johansson,
P.Jonsson,
C.Joram,
L.Jungermann,
F.Kapusta,
S.Katsanevas,
E.Katsoufis,
G.Kernel,
B.P.Kersevan,
U.Kerzel,
A.Kiiskinen,
B.T.King,
N.J.Kjaer,
P.Kluit,
P.Kokkinias,
C.Kourkoumelis,
O.Kouznetsov,
Z.Krumstein,
M.Kucharczyk,
J.Lamsa,
G.Leder,
F.Ledroit,
L.Leinonen,
R.Leitner,
J.Lemonne,
V.Lepeltier,
T.Lesiak,
W.Liebig,
D.Liko,
A.Lipniacka,
J.H.Lopes,
J.M.Lopez,
D.Loukas,
P.Lutz,
L.Lyons,
J.MacNaughton,
A.Malek,
S.Maltezos,
F.Mandl,
J.Marco,
R.Marco,
B.Marechal,
M.Margoni,
J-C.Marin,
C.Mariotti,
A.Markou,
C.Martinez-Rivero,
J.Masik,
N.Mastroyiannopoulos,
F.Matorras,
C.Matteuzzi,
F.Mazzucato,
M.Mazzucato,
R.Mc Nulty,
C.Meroni,
E.Migliore,
W.Mitaroff,
U.Mjoernmark,
T.Moa,
M.Moch,
K.Moenig,
R.Monge,
J.Montenegro,
D.Moraes,
S.Moreno,
P.Morettini,
U.Mueller,
K.Muenich,
M.Mulders,
L.Mundim,
W.Murray,
B.Muryn,
G.Myatt,
T.Myklebust,
M.Nassiakou,
F.Navarria,
K.Nawrocki,
R.Nicolaidou,
M.Nikolenko,
A.Oblakowska-Mucha,
V.Obraztsov,
A.Olshevski,
A.Onofre,
R.Orava,
K.Osterberg,
A.Ouraou,
A.Oyanguren,
M.Paganoni,
S.Paiano,
J.P.Palacios,
H.Palka,
Th.D.Papadopoulou,
L.Pape,
C.Parkes,
F.Parodi,
U.Parzefall,
A.Passeri,
O.Passon,
L.Peralta,
V.Perepelitsa,
A.Perrotta,
A.Petrolini,
J.Piedra,
L.Pieri,
F.Pierre,
M.Pimenta,
E.Piotto,
T.Podobnik,
V.Poireau,
M.E.Pol,
G.Polok,
P.Poropat,
V.Pozdniakov,
N.Pukhaeva,
A.Pullia,
J.Rames,
L.Ramler,
A.Read,
P.Rebecchi,
J.Rehn,
D.Reid,
R.Reinhardt,
P.Renton,
F.Richard,
J.Ridky,
M.Rivero,
D.Rodriguez,
A.Romero,
P.Ronchese,
P.Roudeau,
T.Rovelli,
V.Ruhlmann-Kleider,
D.Ryabtchikov,
A.Sadovsky,
L.Salmi,
J.Salt,
A.Savoy-Navarro,
U.Schwickerath,
A.Segar,
R.Sekulin,
M.Siebel,
A.Sisakian,
G.Smadja,
O.Smirnova,
A.Sokolov,
A.Sopczak,
R.Sosnowski,
T.Spassov,
M.Stanitzki,
A.Stocchi,
J.Strauss,
B.Stugu,
M.Szczekowski,
M.Szeptycka,
T.Szumlak,
T.Tabarelli,
A.C.Taffard,
F.Tegenfeldt,
J.Timmermans,
L.Tkatchev,
M.Tobin,
S.Todorovova,
B.Tome,
A.Tonazzo,
P.Tortosa,
P.Travnicek,
D.Treille,
G.Tristram,
M.Trochimczuk,
C.Troncon,
M-L.Turluer,
I.A.Tyapkin,
P.Tyapkin,
S.Tzamarias,
V.Uvarov,
G.Valenti,
P.Van Dam,
J.Van Eldik,
A.Van Lysebetten,
N.van Remortel,
I.Van Vulpen,
G.Vegni,
F.Veloso,
W.Venus,
P.Verdier,
V.Verzi,
D.Vilanova,
L.Vitale,
V.Vrba,
H.Wahlen,
A.J.Washbrook,
C.Weiser,
D.Wicke,
J.Wickens,
G.Wilkinson,
M.Winter,
M.Witek,
O.Yushchenko,
A.Zalewska,
P.Zalewski,
D.Zavrtanik,
V.Zhuravlov,
N.I.Zimin,
A.Zintchenko,
M.Zupan
11footnotetext: Department of Physics and Astronomy, Iowa State
University, Ames IA 50011-3160, USA
22footnotetext: Physics Department, Universiteit Antwerpen,
Universiteitsplein 1, B-2610 Antwerpen, Belgium
and IIHE, ULB-VUB,
Pleinlaan 2, B-1050 Brussels, Belgium
and Faculté des Sciences,
Univ. de l’Etat Mons, Av. Maistriau 19, B-7000 Mons, Belgium
33footnotetext: Physics Laboratory, University of Athens, Solonos Str.
104, GR-10680 Athens, Greece
44footnotetext: Department of Physics, University of Bergen,
Allégaten 55, NO-5007 Bergen, Norway
55footnotetext: Dipartimento di Fisica, Università di Bologna and INFN,
Via Irnerio 46, IT-40126 Bologna, Italy
66footnotetext: Centro Brasileiro de Pesquisas Físicas, rua Xavier Sigaud 150,
BR-22290 Rio de Janeiro, Brazil
and Depto. de Física, Pont. Univ. Católica,
C.P. 38071 BR-22453 Rio de Janeiro, Brazil
and Inst. de Física, Univ. Estadual do Rio de Janeiro,
rua São Francisco Xavier 524, Rio de Janeiro, Brazil
77footnotetext: Collège de France, Lab. de Physique Corpusculaire, IN2P3-CNRS,
FR-75231 Paris Cedex 05, France
88footnotetext: CERN, CH-1211 Geneva 23, Switzerland
99footnotetext: Institut de Recherches Subatomiques, IN2P3 - CNRS/ULP - BP20,
FR-67037 Strasbourg Cedex, France
1010footnotetext: Now at DESY-Zeuthen, Platanenallee 6, D-15735 Zeuthen, Germany
1111footnotetext: Institute of Nuclear Physics, N.C.S.R. Demokritos,
P.O. Box 60228, GR-15310 Athens, Greece
1212footnotetext: FZU, Inst. of Phys. of the C.A.S. High Energy Physics Division,
Na Slovance 2, CZ-180 40, Praha 8, Czech Republic
1313footnotetext: Dipartimento di Fisica, Università di Genova and INFN,
Via Dodecaneso 33, IT-16146 Genova, Italy
1414footnotetext: Institut des Sciences Nucléaires, IN2P3-CNRS, Université
de Grenoble 1, FR-38026 Grenoble Cedex, France
1515footnotetext: Helsinki Institute of Physics, P.O. Box 64,
FIN-00014 University of Helsinki, Finland
1616footnotetext: Joint Institute for Nuclear Research, Dubna, Head Post
Office, P.O. Box 79, RU-101 000 Moscow, Russian Federation
1717footnotetext: Institut für Experimentelle Kernphysik,
Universität Karlsruhe, Postfach 6980, DE-76128 Karlsruhe,
Germany
1818footnotetext: Institute of Nuclear Physics,Ul. Kawiory 26a,
PL-30055 Krakow, Poland
1919footnotetext: Faculty of Physics and Nuclear Techniques, University of Mining
and Metallurgy, PL-30055 Krakow, Poland
2020footnotetext: Université de Paris-Sud, Lab. de l’Accélérateur
Linéaire, IN2P3-CNRS, Bât. 200, FR-91405 Orsay Cedex, France
2121footnotetext: School of Physics and Chemistry, University of Lancaster,
Lancaster LA1 4YB, UK
2222footnotetext: LIP, IST, FCUL - Av. Elias Garcia, 14-,
PT-1000 Lisboa Codex, Portugal
2323footnotetext: Department of Physics, University of Liverpool, P.O.
Box 147, Liverpool L69 3BX, UK
2424footnotetext: Dept. of Physics and Astronomy, Kelvin Building,
University of Glasgow, Glasgow G12 8QQ
2525footnotetext: LPNHE, IN2P3-CNRS, Univ. Paris VI et VII, Tour 33 (RdC),
4 place Jussieu, FR-75252 Paris Cedex 05, France
2626footnotetext: Department of Physics, University of Lund,
Sölvegatan 14, SE-223 63 Lund, Sweden
2727footnotetext: Université Claude Bernard de Lyon, IPNL, IN2P3-CNRS,
FR-69622 Villeurbanne Cedex, France
2828footnotetext: Dipartimento di Fisica, Università di Milano and INFN-MILANO,
Via Celoria 16, IT-20133 Milan, Italy
2929footnotetext: Dipartimento di Fisica, Univ. di Milano-Bicocca and
INFN-MILANO, Piazza della Scienza 2, IT-20126 Milan, Italy
3030footnotetext: IPNP of MFF, Charles Univ., Areal MFF,
V Holesovickach 2, CZ-180 00, Praha 8, Czech Republic
3131footnotetext: NIKHEF, Postbus 41882, NL-1009 DB
Amsterdam, The Netherlands
3232footnotetext: National Technical University, Physics Department,
Zografou Campus, GR-15773 Athens, Greece
3333footnotetext: Physics Department, University of Oslo, Blindern,
NO-0316 Oslo, Norway
3434footnotetext: Dpto. Fisica, Univ. Oviedo, Avda. Calvo Sotelo
s/n, ES-33007 Oviedo, Spain
3535footnotetext: Department of Physics, University of Oxford,
Keble Road, Oxford OX1 3RH, UK
3636footnotetext: Dipartimento di Fisica, Università di Padova and
INFN, Via Marzolo 8, IT-35131 Padua, Italy
3737footnotetext: Rutherford Appleton Laboratory, Chilton, Didcot
OX11 OQX, UK
3838footnotetext: Dipartimento di Fisica, Università di Roma II and
INFN, Tor Vergata, IT-00173 Rome, Italy
3939footnotetext: Dipartimento di Fisica, Università di Roma III and
INFN, Via della Vasca Navale 84, IT-00146 Rome, Italy
4040footnotetext: DAPNIA/Service de Physique des Particules,
CEA-Saclay, FR-91191 Gif-sur-Yvette Cedex, France
4141footnotetext: Instituto de Fisica de Cantabria (CSIC-UC), Avda.
los Castros s/n, ES-39006 Santander, Spain
4242footnotetext: Inst. for High Energy Physics, Serpukov
P.O. Box 35, Protvino, (Moscow Region), Russian Federation
4343footnotetext: J. Stefan Institute, Jamova 39, SI-1000 Ljubljana, Slovenia
and Laboratory for Astroparticle Physics,
Nova Gorica Polytechnic, Kostanjeviska 16a, SI-5000 Nova Gorica, Slovenia,
and Department of Physics, University of Ljubljana,
SI-1000 Ljubljana, Slovenia
4444footnotetext: Fysikum, Stockholm University,
Box 6730, SE-113 85 Stockholm, Sweden
4545footnotetext: Dipartimento di Fisica Sperimentale, Università di
Torino and INFN, Via P. Giuria 1, IT-10125 Turin, Italy
4646footnotetext: INFN,Sezione di Torino, and Dipartimento di Fisica Teorica,
Università di Torino, Via P. Giuria 1,
IT-10125 Turin, Italy
4747footnotetext: Dipartimento di Fisica, Università di Trieste and
INFN, Via A. Valerio 2, IT-34127 Trieste, Italy
and Istituto di Fisica, Università di Udine,
IT-33100 Udine, Italy
4848footnotetext: Univ. Federal do Rio de Janeiro, C.P. 68528
Cidade Univ., Ilha do Fundão
BR-21945-970 Rio de Janeiro, Brazil
4949footnotetext: Department of Radiation Sciences, University of
Uppsala, P.O. Box 535, SE-751 21 Uppsala, Sweden
5050footnotetext: IFIC, Valencia-CSIC, and D.F.A.M.N., U. de Valencia,
Avda. Dr. Moliner 50, ES-46100 Burjassot (Valencia), Spain
5151footnotetext: Institut für Hochenergiephysik, Österr. Akad.
d. Wissensch., Nikolsdorfergasse 18, AT-1050 Vienna, Austria
5252footnotetext: Inst. Nuclear Studies and University of Warsaw, Ul.
Hoza 69, PL-00681 Warsaw, Poland
5353footnotetext: Fachbereich Physik, University of Wuppertal, Postfach
100 127, DE-42097 Wuppertal, Germany
1 Introduction
The cross-section for the doubly resonant production of W bosons has been measured with the data sample collected with the DELPHI detector during the high-energy operation phase of the LEP collider (LEP2), at centre-of-mass energies from 161 GeV up to 209 GeV. Measurements of total cross-sections, W angular differential distributions and decay branching fractions, and the value of the CKM element are presented. They are compared to the Standard Model including most recent theoretical predictions [4].
The cross-sections determined in these analyses correspond to W pair production, defined through the three doubly resonant tree-level diagrams (“CC03 diagrams” [5] in the following) involving -channel and exchange and -channel exchange, as shown in Figure 1. Depending on the decay mode of each W, fully hadronic, mixed hadronic-leptonic (“semi-leptonic”) or fully leptonic final states are obtained.
This paper is organised as follows: after a brief description of the DELPHI detector in Section 2, a summary of the analysed data and simulation samples is provided in Section 3. Track selection and particle identification are briefly illustrated in Section 4 and in Section 5 the selection of WW events is described and the performance of the analysis reported; Section 6 is devoted to the discussion of the systematic error assessment. In Sections 7 and 8, results in terms of differential cross-sections, total cross-section and W branching ratios are presented. In Section 9 the results are compared to the theoretical predictions and conclusions follow in Section 10.
2 The DELPHI detector in the LEP2 phase
The DELPHI detector configuration for LEP1 running was described elsewhere [6]. For operation at LEP2, changes were made to the subdetectors, the trigger system [7], the run control and the algorithms used in the offline reconstruction of charged particles, which improved the performance compared to LEP1.
The major changes were the extension of the Vertex Detector (VD) and the inclusion of the Very Forward Tracker (VFT) [8], which enlarged the coverage of the silicon tracker out to 111The DELPHI coordinate system has the -axis collinear with the incoming electron beam. indicates the polar angle with respect to the -axis, indicates the plane perpendicular to the axis.. Also the Inner Detector, both the Jet Chamber and Trigger Layers, were extended to cover the polar angle region . Together with improved tracking algorithms, alignment and calibration procedures optimised for LEP2, these changes led to an improved track reconstruction efficiency in the forward regions.
Changes were made to the electronics of the trigger and timing system which improved the stability of the running during data taking. The trigger conditions were optimised for LEP2 running, to give high efficiency for Standard Model two-fermion and four-fermion processes and also give sensitivity to events which may be signatures of new physics. In addition, improvements were made to the operation of the detector during the LEP cycle, to prepare the detector for data taking at the very start of stable collisions of the beams, and to respond to adverse background conditions from LEP were they to arise. These changes led to an overall improvement of in the efficiency for collecting the delivered luminosity, from at the start of LEP2 in 1995 to at the end in year 2000.
During the operation of the detector in year 2000 one of the sectors representing 1/12 of the acceptance of the central tracking device, the Time Projection Chamber (TPC), failed. This problem affects about a quarter of the data collected in that year. Nevertheless, the redundancy of the tracking system meant that charged particles passing through the sector could still be reconstructed from signals in other tracking detectors. A modified track reconstruction algorithm was used in this sector, which included space points reconstructed in the Barrel RICH detector, helpful in the determination of the polar angle of charged particles. As a result, the track reconstruction efficiency was only slightly reduced in the region covered by the broken sector. The impact of the failure of this part of the detector on the analyses is discussed further in Section 6.1.
3 Data and simulation samples
A summary of the data samples used for the WW cross-section measurement is reported in Table 1, where the luminosity-weighted centre-of-mass energies and the amount of data analysed at each energy are shown. The luminosity is determined from Bhabha scattering measurements making use of the very forward electromagnetic calorimetry [9]. The total integrated luminosity for the LEP2 period corresponds approximately to 670 pb-1. The luminosities used for the different selections correspond to those data for which all elements of the detector essential to each specific analysis were fully functional; tighter requirements on the detectors used for lepton identification were applied for the data samples used in the semi-leptonic and fully leptonic channel analyses. The luminosity in year 2000 was delivered in a continuum of energies, thus data taken during this period are divided into two centre-of-mass energy ranges, above and below 205.5 GeV, referred to as 205 GeV and 207 GeV in the following.
All the data taken from the year 1997 onwards have been reprocessed with an updated version of the DELPHI reconstruction software, using a consistent treatment for all the samples. Larger simulation samples were realised with more up-to-date Monte Carlo programs, interfaced to the full DELPHI simulation program DELSIM [6] and reconstructed with the same reconstruction program as the real data.
The cross-section analyses on these data are updated with respect to the previously published ones [10] and supersede them. The data taken in year 1996 have not been reanalysed, because possible improvements were negligible compared to the large statistical errors of those measurements; these results correspond to the publications in [12], with a revised determination of the luminosity [11].
| Year | -weighted (GeV) | Hadronic (pb-1) | Leptonic (pb-1) |
|---|---|---|---|
| 1996 | 161.31 | 10.07 | 10.07 |
| 172.14 | 10.12 | 10.12 | |
| 1997 | 182.65 | 52.51 | 51.63 |
| 1998 | 188.63 | 154.35 | 153.81 |
| 1999 | 191.58 | 25.16 | 24.51 |
| 195.51 | 76.08 | 71.99 | |
| 199.51 | 82.79 | 81.82 | |
| 201.64 | 40.31 | 39.70 | |
| 2000 | 204.81 | 82.63 | 74.93 |
| 206.55 | 135.82 | 123.66 |
Four-fermion simulation samples were produced with the WPHACT [13] generator, interfaced with the PYTHIA 6.156 [14] hadronisation model. In order to perform checks on hadronisation effects, the same generator was also interfaced to the ARIADNE [15] and HERWIG [16] hadronisation models.
The generation was complemented with two-photon collision generators BDK [17], BDKRC [18] and PYTHIA. The most recent () electroweak corrections, via the so-called Leading Pole Approximation (LPA), were included in our generation of the signal via weights given by the YFSWW program [19], according to the scheme described in [20].
The selection efficiencies were defined with respect to the CC03 diagrams only, by reweighting each event to the CC03 contribution according to the ratio of the squared matrix elements computed with these diagrams only and with the full set of diagrams.
4 Charged particle selection and lepton identification
To improve the event reconstruction and reject contributions from either cosmic ray events, beam-gas interactions or noise from electronics, the reconstructed charged particles were required to fulfil the following criteria:
-
-
momentum 0.1 GeV/c p 1.5 Pbeam;
-
-
momentum error p/p 1;
-
-
impact parameter 4 cm;
-
-
impact parameter 4 cm/.
Tracks seen by only the central tracking devices (Vertex Detector (VD) and Inner Detector (ID)) were rejected if no coordinate measurement was available.
Neutral clusters of energy in the barrel (HPC), forward (FEMC) and very forward (STIC) electromagnetic calorimeters were required to have an energy of at least 300, 400 and 300 MeV respectively. In addition, off–momentum electrons in the STIC were rejected by a cut on the polar angle of a shower at 3∘. Noise from the hadron calorimeter (HCAL) was reduced by rejecting showers which had activity in only one layer and failed a selection based on energy, number of hits and longitudinal position.
Muon identification was performed by extrapolating tracks through the entire detector, and associating nearby HCAL energy deposits and muon chamber hits to the tracks. The errors on track parameters, on the energy deposits and on the position of chamber hits were taken into account when making this association. Particles were identified as muons if there was at least one muon chamber hit associated to a track or if the size and longitudinal profile of the HCAL energy deposits associated to a track were consistent with a minimum ionizing particle.
Electron identification was based on the reconstructed showers in the electromagnetic calorimeters associated to charged particle tracks. The barrel photons in a conic region close to the direction of the track were reassociated to the candidate electron, also accounting for the bending caused by the magnetic field. A particle was identified as an electron if the associated calorimetric energy was larger than 50% of the momentum reconstructed in magnetic field. For tracks below 30 GeV/c, the identification algorithm was based on a combination of the energy-momentum ratio, the measurement of the energy loss in the TPC, the matching of the track to the shower in the and directions and on the shower profile. FEMC electromagnetic deposits close in space were clustered together and the association with reconstructed tracks was used for electron/photon discrimination. Care was taken in excluding those tracks which were likely to come from the development of a shower outside the calorimeter. In addition, the ratio between the electromagnetic energy and the total energy (electromagnetic and hadronic) was required to be above 90%. For energetic and isolated tracks in the regions not covered by electromagnetic calorimetry, the measurement of the energy loss in the TPC was used. The estimate of electron energy was obtained from a combination of the track momentum and the calorimetric deposition.
5 Event selection and partial cross-sections
5.1 Fully hadronic final state
5.1.1 Selection of fully hadronic final state events
For the selection of , the charged and neutral particles in each event were forced into a four-jet configuration with the DURHAM algorithm [25]. A preselection of events was performed to select well reconstructed hadronic events without missing energy and momentum. The following conditions were imposed:
-
•
reconstructed effective centre-of-mass energy [26] of the nominal centre-of-mass energy;
-
•
total and transverse energy for charged particles, and , where is the momentum component of the particle perpendicular to the beam axis, each of nominal centre-of-mass energy;
-
•
total particle multiplicity for each jet;
-
•
for the migration from 4 to 3 jets when clustering with the DURHAM algorithm;
-
•
convergence of a four-constraint (4C) fit of the measured jet energies and directions imposing four-momentum conservation.
A feed-forward neural network was then used to improve the rejection of two-fermion (mainly ) and four-fermion background (mainly ). The network, based on the JETNET package [27], uses the standard back-propagation algorithm and consists of three layers with 13 input nodes, 7 hidden nodes and one output node.
The following jet and event observables were chosen as input variables, taking into account previous neural network studies [28] to optimise input variables for the WW and two-fermion separation:
-
•
the difference between the maximum and minimum jet energies after the 4C fit;
-
•
the minimum angle between two jets after the 4C fit;
-
•
the value of from the DURHAM algorithm for the migration of 4 jets into 3 jets;
-
•
the minimum particle multiplicity of any jet;
-
•
the reconstructed effective centre-of-mass energy ;
-
•
the maximum probability, amongst the three possible jet pairings, for a 6C fit (imposing 4-momentum conservation and the invariant mass of each jet pair equal to the W-mass);
-
•
the thrust;
-
•
the sphericity;
-
•
the transverse energy;
-
•
the sum of the cubes of the magnitudes of the momenta of the 7 highest momentum particles ;
-
•
the minimum jet broadening [25];
-
•
the Fox-Wolfram-moment H3 [29];
-
•
the Fox-Wolfram-moment H4.
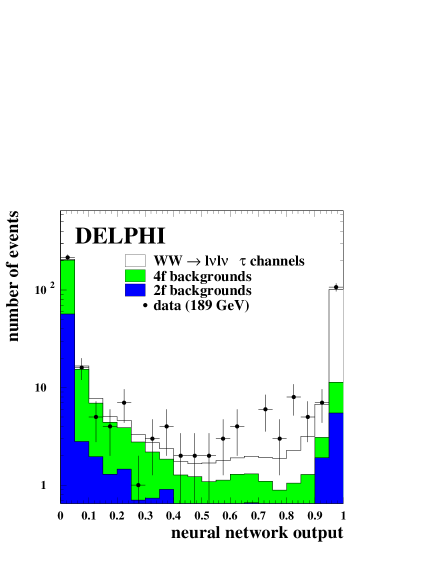
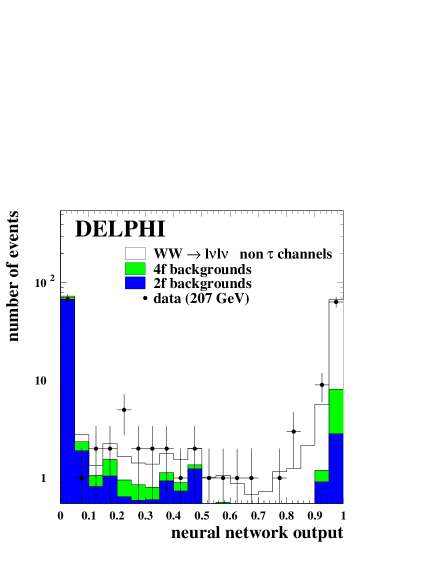
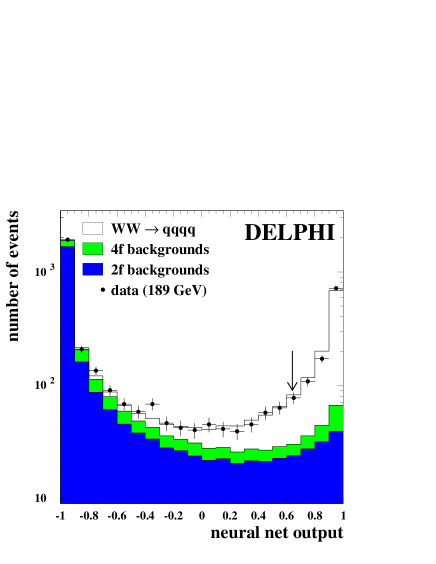
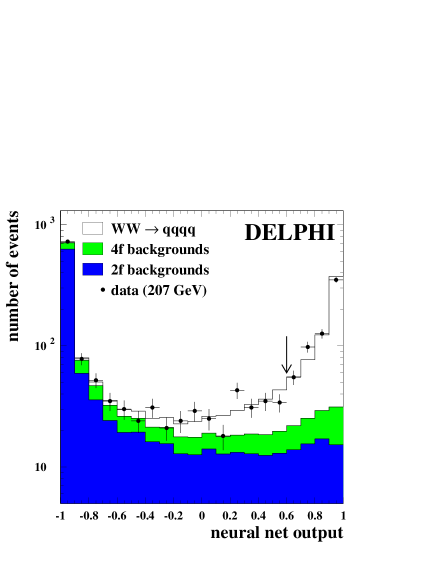
The neural network was trained separately at each energy. Each training was performed with 2500 signal events and 2500 background events. Afterwards the network output was calculated for other independent samples of simulated four-fermion, and events, and for the data. Figure 2 shows distributions of the neural network output for data and simulated events at 189 and 207 GeV.
Events were selected by applying a cut on the NN output variable, chosen to minimise the total error on the measured cross-section including the systematic uncertainty on the two-fermion background with its correlation at all centre-of-mass energies (see Section 6).
5.1.2 Results for fully hadronic final state
The efficiency and background contamination for the hadronic event selections were evaluated independently at the different centre-of-mass energies. The selection performance at = 200 GeV and the total number of events selected in each data sample are reported in Table 2. The efficiencies varied by no more than 4% over the different energy points above 172 GeV. The background is dominated by qq, representing 70-75% of the contamination, decreasing with energy.
| efficiencies for selected channels | ||||
| channel | ||||
| 0.797 | 0.012 | |||
| 0.004 | 0.677 | 0.004 | 0.114 | |
| 0.002 | 0.001 | 0.852 | 0.043 | |
| 0.016 | 0.032 | 0.026 | 0.581 | |
| background (pb) | 1.21 | 0.232 | 0.075 | 0.371 |
| (GeV) | Selected events | |||
| 161 | 15 | 12 | ||
| 172 | 65 | 14 | 17 | 14 |
| 183 | 345 | 94 | 118 | 123 |
| 189 | 1042 | 269 | 336 | 339 |
| 192 | 187 | 42 | 53 | 58 |
| 196 | 532 | 151 | 166 | 164 |
| 200 | 614 | 162 | 190 | 208 |
| 202 | 317 | 94 | 89 | 83 |
| 205 | 657 | 169 | 153 | 174 |
| 207 | 999 | 214 | 259 | 289 |
| All | 4773 | 4054 | ||
At each energy point the cross-section for fully hadronic events was obtained from a binned maximum likelihood fit to the distribution of the NN output variable above the cut value, assuming Poissonian probability density functions for the number of events. The probability is calculated on the basis of the efficiency for being reconstructed in a given bin of the NN output and the expected background in each bin and is a function of the partial cross-section to be measured. For this fit the contamination from other WW channels, with its value fixed to the SM prediction, was considered as a background.
The results for = BR , where BR is the probability for the W-pair to give a purely hadronic final state, are reported in Table 3. Systematic uncertainties were determined as detailed in Section 6.
| (GeV) | (pb) |
|---|---|
| 161 | |
| 172 | |
| 183 | |
| 189 | |
| 192 | |
| 196 | |
| 200 | |
| 202 | |
| 205 | |
| 207 |
5.2 Semi-leptonic final state
5.2.1 Selection of semi-leptonic final state events
Events in which one of the W bosons decays into a lepton and a neutrino and the other one into quarks are characterised by two or more hadronic jets, one isolated lepton (coming either directly from the W decay or from the cascade decay ) or a low multiplicity jet due to a hadronic decay, and missing momentum resulting from the neutrino(s). The major background comes from production and from four-fermion final states containing two quarks and two leptons of the same flavour.
Events were first required to pass a general hadronic preselection:
-
•
at least 5 charged particles;
-
•
energy of charged particles at least 10% of total centre-of-mass energy;
-
•
, where identify the total energy deposited in electromagnetic calorimeters in the forward and backward directions, defined as two 20∘ cones around the beam axes.
A search for leptons was then made. Of the identified electrons with an energy greater than 5 GeV, the one with the highest value of (energy ) 222The isolation angle is defined as the angle made to the closest charged particle with a momentum greater than 1 GeV/c. was considered to be the electron candidate. This candidate was required to have an energy of at least 15 GeV. Of the identified muons with a momentum greater than 5 GeV/c, the one with the highest value of (momentum ) was considered to be the muon candidate. This candidate was required to have a momentum of at least 15 GeV/c. The event was then clustered into jets using the LUCLUS [14] algorithm with a value of 6.5 GeV/c. The resulting jets were trimmed by removing particles at an angle greater than 20∘ to the highest energy particle in the jet. Of these trimmed jets, the one with the smallest momentum–weighted spread 333defined as , where is the angle made by the momentum of the particle in the jet with the total jet momentum was taken to be the tau candidate. Particles with momenta smaller than 1 GeV/c were removed from the candidate jet if they were at an angle greater than 8∘ to the jet axis. At the end of the procedure, this jet was required to still contain at least one charged particle.
An event could have up to three lepton candidates, one of each flavour.
For each lepton candidate, all particles other than the lepton were clustered into two jets using the DURHAM algorithm. These two jets were required to contain at least three particles, at least one of which had to be charged. Additional preselection cuts are listed in Table 4: these reject most events due to photon–photon collisions, some events for which there is no missing energy, and events whose topologies are far from those of WW events.
| / | ||
|---|---|---|
| Transverse energy (GeV) | ||
| Missing momentum (GeV/c) | 10pmis80 | |
| Visible energy/Etrain (%) | 40E/Etrain110 | 35E/Etrain100 |
| Fitted W mass (GeV/c2) |
After these preselection cuts, the final selection was made with an Iterative Discriminant Analysis (IDA) [30]. The standard IDA technique assumes that the signal and background distributions in the multi-observable space have different means but identical shapes. IDA was extended to treat correctly cases when the distributions have different shapes. The input observables were transformed to make their distributions Gaussian. The IDA selection was made in three channels (, and ). The training was performed on Monte Carlo samples: around 50k events each of four-fermion charged and neutral current processes, and 100k events. The IDA was trained at three centre-of-mass energies: 189, 200 and 206 GeV.
The observables used in the discriminants are summarised in Table 5, and can be grouped into four categories:
-
•
event observables such as the multiplicity, visible and transverse energies, aplanarity444the aplanarity is defined as , where is the smallest eigenvalue of the sphericity tensor . The are the 3-momenta of particles in the event, and correspond to the momentum components. and the reconstructed effective centre-of-mass energy () are useful to distinguish between semi-leptonic and other four-fermion events, and to remove events, particularly those in the radiative return peak;
-
•
observables concerned with the charged lepton (energy, isolation angle, tau jet multiplicity) are useful in discriminating between events with primary leptons and those with leptons originating in quark decays or in other processes, such as photon conversion;
-
•
properties of the missing momentum (magnitude and polar angle) make use of the fact that the missing momentum from unseen initial state radiation (ISR in what follows) photons is directed along the beampipe;
-
•
the angles between the lepton and missing momentum, and the fitted W mass from a constrained kinematic fit (imposing four-momentum conservation and the equality of the two W masses in the event) are sensitive to the event topologies expected from semi-leptonic WW decays.
| total multiplicity | X | X | X |
| visible energy | X | X | X |
| transverse energy | X | ||
| aplanarity | X | ||
| / | X | X | X |
| lepton energy | X | X | |
| lepton isolation angle | X | X | X |
| tau jet charged multiplicity | X | ||
| tau jet momentum–weighted spread | X | ||
| magnitude of missing momentum | X | X | X |
| polar angle of missing momentum | X | X | X |
| lepton–missing momentum angle | X | X | |
| Fitted W mass | X | X | X |
The performance of the selection was measured using samples independent from those on which the training was performed. Events were selected with a cut on the output of the IDA, chosen to optimise the product of efficiency and purity for each channel. Events were first passed to the selection; if they were not selected, they were passed to the ; if they were still not selected, they were then finally passed to the selection.
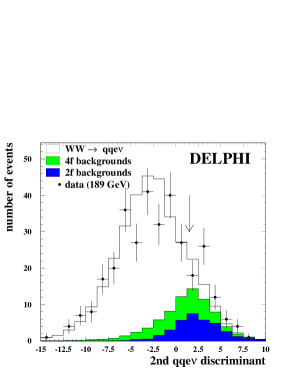
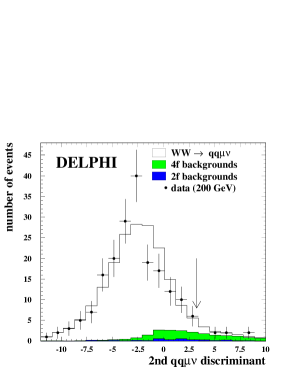
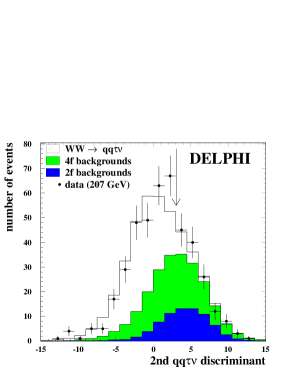
Distributions of discriminants for the semi-leptonic event selection are shown in Figure 3.
5.2.2 Results for semi-leptonic final state
The efficiency matrices and background contaminations for the semi-leptonic event selections were evaluated independently at the different centre-of-mass energies. The efficiencies differed by no more than 2% over the different energy points. The values at 200 GeV, with the number of events observed at each energy point are reported in Table 2. The final efficiencies for identifying , and events with any of the three semi-leptonic selections at 200 GeV were 79.6%, 89.6% and 63.9% respectively. The background in all the channels was composed of two- and four-fermion events in similar proportions.
The number of events observed in the different lepton channels was found to be consistent with lepton universality. With this assumption, likelihood fits to the Poisson probability of the expected number of events, where the contamination of the fully hadronic channel is considered as background, yield the cross-sections reported in Table 6. Systematic uncertainties were determined as detailed in Section 6.
| (GeV) | (pb) |
|---|---|
| 161 | |
| 172 | |
| 183 | |
| 189 | |
| 192 | |
| 196 | |
| 200 | |
| 202 | |
| 205 | |
| 207 |
5.3 Fully leptonic final state
5.3.1 Selection of fully leptonic final state event
Events in which both W bosons decay into are characterised by low multiplicity, a clean two-particle (or jet from decay) topology with two energetic, acollinear leptons of opposite charge, acoplanar with the beam and with large missing momentum and energy. The relevant backgrounds are di-leptons from , Bhabha scattering, two-photon collisions and leptonic final states from Z-pair and single boson production.
The selection was performed in three steps. First a leptonic preselection was made, followed by particle identification. Finally two Neural Networks were used to reject the remaining background.
An initial set of cuts was applied to select a sample enriched in leptonic events. All particles in the event were clustered into “jets” using the LUCLUS algorithm () and only events with two reconstructed jets, containing at least one charged particle each, were retained. A total charged particle multiplicity between 2 and 6 was required and at least one jet had to have only one charged particle. In order to reduce the background from two-photon collisions and radiative di-lepton events, the event acoplanarity, , defined as the acollinearity of the two jet directions projected onto the plane perpendicular to the beam axis, had to be above 3∘. In addition, the total momentum transverse to the beam direction, , had to exceed 2% of the centre-of-mass energy . The associated energy deposited in the electromagnetic calorimeters for both leading particles (the ones with the largest momenta) was required to be less than to reject Bhabha scattering. To reject radiative events further, the energy of the most energetic photon had to be less than and the angle in the plane perpendicular to the beam axis between the charged particles system and the most energetic photon was required to be less than 170∘. Finally, the energy of the charged particles in each jet had to be greater than and the visible energy of the particles with had to exceed .
In events passing this selection each particle was classed as , or hadron. A lepton was identified as a cascade decay from if the momentum was lower than .
After the preselection and the channel identification, two Neural Networks based on the Multi Layer Perceptron (MLP) [31] package were built to reject the remaining background. They consisted of one output layer from 13 input variables, normalised to lie in the region between zero and one.
One of the two Neural Networks was tuned for the channels () and the other for the remaining channels, given the different characteristics of the two samples. This was found to optimise the performance of the selection.
The following variables were used in both Neural Networks:
-
•
the event acoplanarity;
-
•
the event acollinearity;
-
•
the larger of the associated energy from electromagnetic calorimetry of the two leptons;
-
•
the transverse momentum, ;
-
•
the transverse energy;
-
•
the angle in the plane perpendicular to the beam axis between the vector sum of the charged particle momenta and the most energetic photon;
-
•
the absolute value of the cosine of the polar angle of the missing momentum;
-
•
the energy in the calorimeters not associated to charged particles outside two cones of 20∘ around both leading charged particles;
-
•
the larger of the energies of the two jets coming from charged particles;
-
•
the total energy of neutral particles;
-
•
the larger of the invariant masses of the two jets;
-
•
the total visible energy;
-
•
the total energy of charged particles.
Distributions of the Neural Network output variable for the fully leptonic event selection are shown in Figure 4. The cut applied on the Neural Network output was tuned in order to optimise the product of efficiency and purity. The cut was channel dependent, but did not depend on the centre-of-mass energy.
5.3.2 Results for fully leptonic final state
The efficiencies and backgrounds for GeV together with the numbers of selected events at each of the centre-of-mass energies are shown in Table 7. The overall efficiency was 67.3% and the residual background from non-W and single-W events was 0.187 pb. The efficiencies were checked to be constant within 1-2% at the different energy points above 172 GeV. The number of observed events in each subchannel is consistent with the hypothesis of lepton universality. Table 8 presents the values, at each energy, of from maximum likelihood fits to the Poisson probability of the expected number of events. Systematic uncertainties were determined as detailed in Section 6.
| efficiencies for selected channels | ||||||
| channel | ||||||
| 0.272 | 0.087 | 0.077 | 0.004 | 0.008 | 0.006 | |
| 0.068 | 0.462 | 0.005 | 0.044 | 0.049 | ||
| 0.042 | 0.004 | 0.536 | 0.061 | 0.053 | ||
| 0.017 | 0.151 | 0.471 | ||||
| 0.012 | 0.041 | 0.094 | 0.621 | |||
| 0.008 | 0.109 | 0.003 | 0.677 | |||
| background (pb) | 0.030 | 0.046 | 0.023 | 0.042 | 0.019 | 0.027 |
| (GeV) | Selected events | |||||
| 161 | 2 | |||||
| 172 | 8 | |||||
| 183 | 4 | 13 | 10 | 9 | 9 | 14 |
| 189 | 22 | 56 | 43 | 25 | 45 | 38 |
| 192 | 4 | 2 | 14 | 4 | 8 | 7 |
| 196 | 16 | 29 | 19 | 12 | 24 | 7 |
| 200 | 12 | 26 | 28 | 11 | 27 | 13 |
| 202 | 4 | 20 | 13 | 4 | 6 | 9 |
| 205 | 14 | 26 | 22 | 7 | 24 | 10 |
| 207 | 14 | 40 | 41 | 16 | 44 | 16 |
| All | 891 | |||||
| (GeV) | (pb) |
|---|---|
| 161 | |
| 172 | |
| 183 | |
| 189 | |
| 192 | |
| 196 | |
| 200 | |
| 202 | |
| 205 | |
| 207 |
6 Systematic errors
A large variety of systematic effects were taken into account in the cross-section determination. They were due to imperfect modelling of the detector response or of underlying physics in the simulation, or to statistical uncertainties due to the finite size of the simulation samples.
Systematic errors were divided in three classes to facilitate their treatment in the combination of cross-section results from the four LEP experiments [32]: errors correlated between the experiments and between the different centre-of-mass energies (LCEC), typically due to the use of the same models to describe physics effects, errors uncorrelated between the experiments but correlated between centre-of-mass energies (LUEC), which comprise detector-related effects, and errors correlated neither between experiments nor between energies (LUEU) which are mainly due to uncertainties on simulation sample statistics. Correlations between the different channels were also taken into account.
Details of the determination of the systematic contributions are given in the following.
6.1 Estimation of systematic uncertainties
6.1.1 Background cross-sections from four-fermion and two-fermion processes
Theoretical uncertainties in the knowledge of four-fermion cross-sections largely depended on the process, varying from in ZZ processes to in single-boson contributions. Larger uncertainties arose when considering regions of the phase space dominated by collisions [32].
The four-fermion background generation was performed independently for charged and neutral current processes. The latter ones were further divided with phase space cuts to isolate as much as possible the contribution of multiperipheral diagrams, where scattering dominates, and which were generated in a complementary sample [20]. For the selected background from charged current processes, mainly the single-W contribution, a relative uncertainty of was assigned. The same uncertainty was used for the non- neutral current background, with the exception of ZZ contributions where it became . For the remaining neutral current phase space a relative uncertainty was assigned.
The theory errors used for the two-fermion background cross-sections were those reported in [33]. A further uncertainty of was conservatively added to account for ungenerated regions of the phase space in the matching between two-fermion and four-fermion processes, where radiative corrections to could convert into an extra low-mass fermion pair.
The variations of each background were taken as fully correlated in channel and energy and the resulting change in the measured cross-section was quoted as a systematic error.
6.1.2 Modelling of four-jet background from
In the fully hadronic channel the uncertainty on the background from two-fermion production leading to four-jet final states was estimated by comparing simulations with different hadronisation models, ARIADNE, PYTHIA and HERWIG. ARIADNE was chosen as default, because it provided the best description of the four-jet rates observed for the large data set at the Z peak [23] and also at LEP2 energies [34]. For the other models differences of (PYTHIA) and (HERWIG) were obtained for the background computation, and the largest difference of 6% was conservatively chosen as the systematic uncertainty. This estimate was confirmed by fitting all data to signal and background with a free parameter to scale the two-fermion background (ARIADNE), for which a change of was obtained.
6.1.3 Fragmentation modelling
Modelling of the fragmentation in hadronic events could have an impact both on the selection efficiency and on the background level estimated from the Monte Carlo. These effects were evaluated by comparing the performance of the selection algorithms on signal and background samples generated with different hadronisation models.
The PYTHIA hadronisation model, which best described the two-jet fragmentation at the Z peak, was taken as a reference to evaluate efficiencies for all channels and the background for the semi-leptonic channel. It was compared to ARIADNE [15] and HERWIG [16] and the largest deviations were considered to estimate the systematic errors on the cross-sections.
The largest variation in the signal efficiency was 0.58% in the fully hadronic channel and 1% in the semi-leptonic one, while the difference in the background level was found to be 3.2% in the semi-leptonic channel. For the hadronic channel this uncertainty is included in the four-jet modelling.
6.1.4 Final state interactions
At LEP2 energies the decay distance between the W bosons was smaller than the hadronisation scale or the typical radius where Bose-Einstein effects occur. Therefore gluon exchange between quarks from different Ws (known as Colour Reconnection) or Bose-Einstein Correlations between pions were to be expected. These so-called Final State Interactions (FSI) between the decay products of the two different Ws could affect the reconstruction of fully hadronic events only, and their modelling could have an impact on the determination of the selection efficiency.
The effects of Colour Reconnections and Bose-Einstein Correlations were estimated by evaluating the selection efficiency on simulation samples where FSI were modelled using the SK1 algorithm [35] with reconnection probability of 30% for Colour Reconnections and the LUBOEI algorithm [36] for Bose-Einstein Correlations. The full difference between the presence and the absence of these effects was taken as an indication of the systematic error, corresponding to a variation in efficiency of -0.3% and 0.2%, respectively.
6.1.5 Radiative corrections
The correct simulation of radiation in WW production and decay could be relevant for efficiency determination. Since the LEP2 Monte Carlo workshop [4], generators with a more precise calculation of () electroweak corrections to CC03 became available [37, 19]. The theoretical uncertainty on the total cross-section was reduced by almost a factor 4 down to a level of 0.5%, with a change of central value by almost 2% with respect to Gentle2.0 [38], run with parameter settings as described in [39]. Moreover, it was shown that the more correct description of electroweak corrections also had very important effects on differential distributions [40], making its inclusion essential for efficiency determinations.
The YFSWW [19] program was used in the generation for reweighting events according to the procedure described in [20]. In order to estimate the effect that theoretical uncertainty in the description of the radiation had on the selection efficiency, the results obtained in the DELPHI setup were compared with a simulation making use of RacoonWW [37] on the testbench process . The two programs differed in many respects in the treatment of QED radiation: YFSWW was a generator (CC03 diagrams only) with () factorisable electroweak corrections and non-factorisable corrections implemented via the so-called Khoze-Chapovsky ansatz (KC) [41]. It included ISR in leading logarithm approximation (LL) () via YFS exponentiation [42] and final state radiation (FSR) LL () via PHOTOS [43]. On the other hand, RacoonWW was a generator implementing () in Double Pole Approximation (DPA) rigorously, extended to () for collinear ISR via structure functions. It also included real corrections with the exact matrix elements of the CC11 [5] class.
The systematic uncertainty on the cross-section was estimated by comparing results from the two programs: no significant difference was found in the efficiencies, therefore the statistical error on this difference was taken as a conservative estimate of the systematic contribution.
6.1.6 Luminosity determination
The luminosity was determined from a measurement of Bhabha scattering, which was theoretically known to high accuracy. The measurement made use of coincidences in the very forward electromagnetic calorimeters and was affected by the experimental error on the acceptance (). The residual theoretical uncertainty on the cross-section estimate was [44]. These uncertainties were propagated to a systematic error on .
The statistical error on the Bhabha cross-section was included in the statistical error of the W-pair cross-section.
6.1.7 Detector effects
A non-perfect reproduction of track reconstruction and lepton identification efficiencies in the simulation could induce a systematic error on the signal efficiency and the background rejection. This was particularly relevant for semi-leptonic and fully leptonic channels.
These effects were evaluated from a comparison of the simulation with data on high statistics samples of clean two-lepton and two-jet events, which were collected at a centre-of-mass energy of 91.2 GeV. The data were taken with the same detector and trigger configuration and analysed with the same reconstruction software as the high energy data. High energy data samples were also used for the comparison, selecting events with a clean di-lepton and 2- or 3-jet topologies.
From data-simulation comparisons, corrections were deduced for the energies and polar angles of jets, and for the number of charged particle tracks in the endcap region. These led to corrections of the signal efficiency in the hadronic channel of (jets) and (endcap tracks), for which systematic uncertainties of and were assigned.
For lepton identification, the angular averaged difference in the identification efficiency between data and simulation of 0.3% for muons and 1% for electrons was found. The systematic error on the WW cross-section and W branching fractions was determined by randomly changing the lepton identification in the signal and background Monte Carlo according to the discrepancies found. The changes were correlated between the different channels. The effect on the total cross-section was small because most of the events lost as electrons or muons were recovered by the tau selections.
Other possible discrepancies between data and Monte Carlo in the variables used as inputs for the Neural Network in the hadronic channel were taken into account by smearing these variables in the simulation by their experimental resolution.
In total a systematic uncertainty of on the signal efficiency and on the total background was estimated for the hadronic channel. For the semi-leptonic channels the uncertainties on the signal efficiencies were for the and channels, and for the . The variations of the background ranged from 0.6% to 6% according to the channel. The systematic uncertainties in the fully leptonic channel were for the efficiency and 7% for the background.
6.1.8 Detector inefficiencies in a specific period
As mentioned in Section 2, one of the TPC sectors, covering 1/12 of the acceptance, was not operational during the last period of the high energy data taking in the year 2000. These data were analysed separately and then combined with the results from the previous period. The performance of the analyses and the cross-section values were found to be compatible within statistical errors. Additional systematic effects were estimated by comparing data collected at the peak during the period with the TPC sector 6 off with simulation samples produced with the same detector conditions. Both hadronic and leptonic decays were used. The impact on the WW cross-section analysis was conservatively evaluated as an uncertainty on the selection efficiency of in the fully hadronic channel and of 1% in the other channels, which was added to the systematic error. No effects were found on the background level.
6.1.9 Monte Carlo statistics
The uncertainties due to limited statistics of the Monte Carlo samples were at most on the signal efficiency and on the background level for the hadronic channels at energies above 172 GeV. The error on backgrounds in the fully leptonic channels were up to 10 times larger because of the small numbers of accepted events.
| Source | (pb) | (pb) | (pb) | LC | EC |
|---|---|---|---|---|---|
| Four-jet modelling | - | Y | Y | ||
| Background cross-sections | Y | Y | |||
| Fragmentation | - | Y | Y | ||
| Final state interactions | - | - | Y | Y | |
| Radiative corrections | Y | Y | |||
| Luminosity (theor) | Y | Y | |||
| Luminosity (exp) | Y | ||||
| Detector effects | Y | ||||
| Monte Carlo statistics |
Table 9 presents the breakdown of the systematics per channel determined in the way described above for 200 GeV. The classification of the systematics according to their correlations in energy or experiments is also shown.
7 Differential cross-section
Given the high statistics available at LEP2, it is interesting to provide a measurement of differential cross-sections. Particularly relevant are the W polar angle distributions, from which triple gauge coupling limits can be extracted. In what follows the determination of d/dcos is discussed.
The presented differential cross-section refer to CC03 and final states, since they give a clean W charge assignment, and has therefore to be understood as d[(BReν+BRμν)]/dcos, where BRlν is the branching ratio of the decay WW .
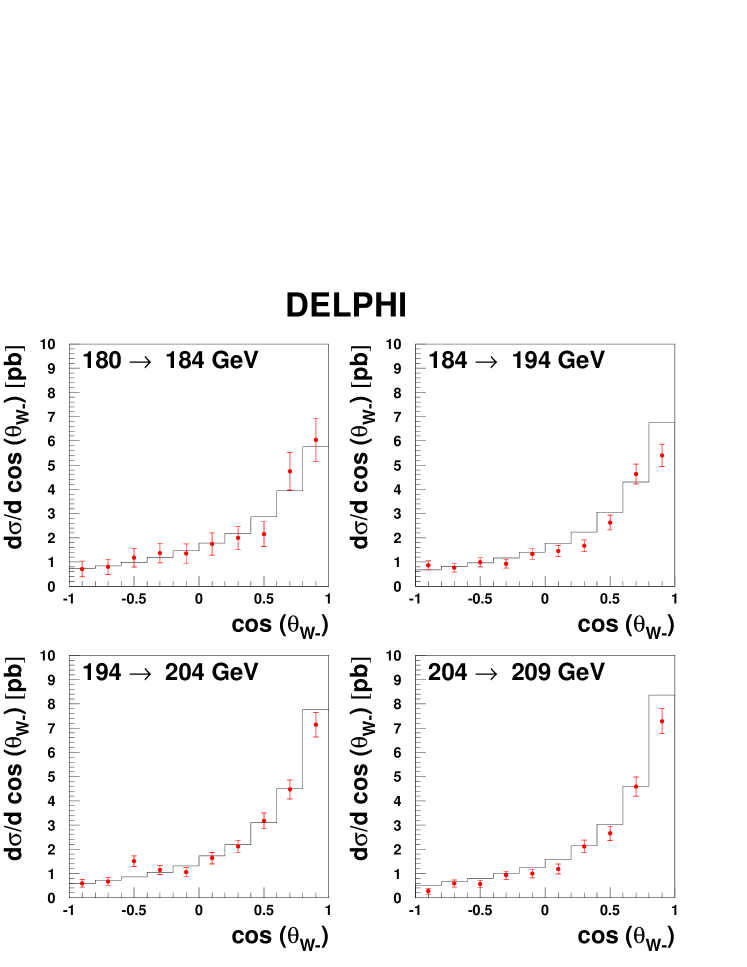
The IDA analysis described in section 5.2.1 was used for the event selection; the W flight direction was determined via a constrained fit of the event which imposed four-momentum conservation and equality of the hadronic and leptonic invariant masses. In order to distinguish between radiation from Ws or from the final state fermions, the photon-to-fermion recombination scheme followed the CALO5 definition adopted in the LEP2 Monte Carlo workshop [4]. To match the detector acceptance best, an additional restriction requiring the charged lepton to be more than 20∘ away from the beam direction was introduced. For the case this additional cut strongly suppressed the contribution of single-W diagrams in the signal definition. The impact of possible systematic effects due to charge misidentification for leptons within the accepted angular region was found to be negligible from studies on dilepton events. To optimise the statistics in each bin, four bins in energy and ten bins in polar angle were chosen. Table 10 reports the energy binning, together with the corresponding luminosity and luminosity weighted centre-of-mass energy. The angular binning was chosen to be significantly bigger than the resolution on , estimated to be about 0.06 from Monte Carlo, in order to minimise bin migration of data. The migration matrix, expressing the probability that an event selected in a certain bin was generated in another one, is reported in Appendix A. No corrections for bin migration were applied to the presented results. All the conventions used for presenting the DELPHI result, including signal and bin definitions, are the ones agreed for the LEP combination.
| Bin (GeV) | -weighted (GeV) | (pb-1) |
|---|---|---|
| 180-184 | 182.65 | 51.63 |
| 184-194 | 189.03 | 178.32 |
| 194-204 | 198.46 | 193.52 |
| 204-210 | 205.91 | 198.59 |
The results at the energies in Table 10 are reported in Figure 5, where data points are superimposed on the expected distributions from WPHACT and YFSWW. The data are in agreement with the expectations in all energy ranges. A systematic deficit of data in the highest cos bin at energies above 184 GeV is observed. As a crosscheck, it was verified that the shape of the angular distributions, for electrons and muons separately, and for positively and negatively charged leptons, were compatible within errors.
The detailed list of results, in terms of measured cross-sections, statistical and systematic errors per bin is reported in Appendix A.
8 Determination of the W branching fractions and of the total WW production cross-section
The total cross-section for WW production and the W leptonic branching fractions were obtained from a likelihood fit based on the probabilities of finding the observed number of events in each final state. The input numbers in the form given in Tables 2 and 7 were used, except for the fully hadronic final state where, for energies above 172 GeV, the binned distribution of the neural network output was used.
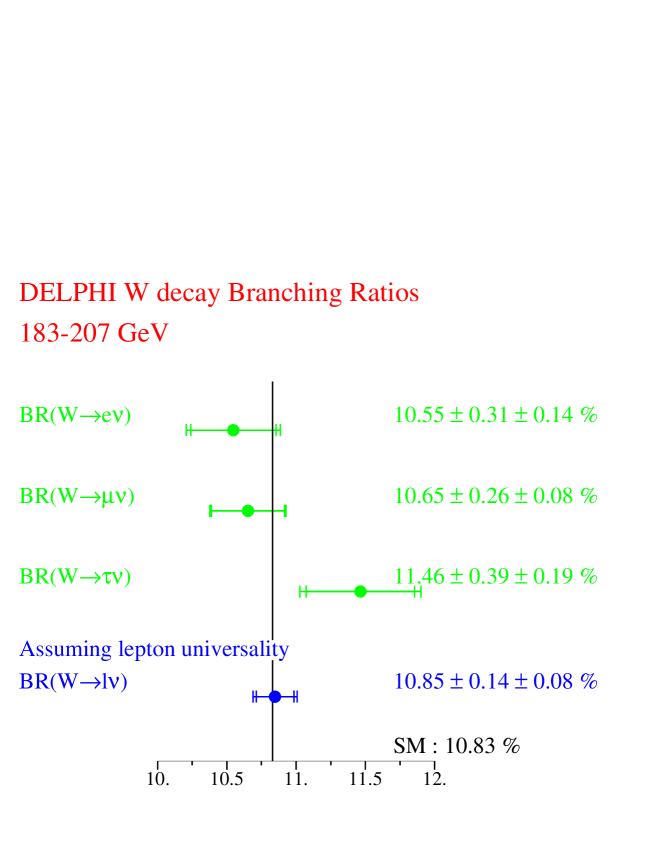
A fit without the assumption of lepton universality, requiring the unitarity of the branching ratios (i.e. BReν + BRμν + BRτν + BR = 1), was performed. The results for all the data above 172 GeV are shown in Table 11. The analyses on the low statistics samples at 161 and 172 GeV used inclusive lepton identification. The correlation matrix is also reported, where both statistical and systematic contributions are included. Since the lepton branching ratios are in agreement, a second fit assuming lepton universality was performed in order to extract BR. The result for this second fit are also reported in Table 11. In Figure 6 the results are compared to the Standard Model predictions. All results are consistent with the expectations and with lepton universality.
| channel | branching fraction | stat. error | syst. error (LU) | syst. error (LC) |
|---|---|---|---|---|
| 0.1055 | 0.0031 | 0.0013 | 0.0005 | |
| 0.1065 | 0.0026 | 0.0006 | 0.0005 | |
| 0.1146 | 0.0039 | 0.0017 | 0.0009 |
| Correlations | |||
|---|---|---|---|
| 1.00 | 0.03 | -0.34 | |
| 0.03 | 1.00 | -0.17 | |
| -0.34 | -0.17 | 1.00 |
| assuming lepton universality | ||||
| channel | branching fraction | stat. error | syst. error (LU) | syst. error (LC) |
| 0.6745 | 0.0041 | 0.0020 | 0.0014 | |
Within the Standard Model, the branching fractions of the W boson depend on the six matrix elements of the Cabibbo–Kobayashi–Maskawa (CKM) quark mixing matrix not involving the top quark. In terms of these matrix elements, the leptonic branching fraction of the W boson BRlν is given by
where is the strong coupling constant. Taking [45], the measured leptonic branching fraction of the W yields
where the first error is due to the uncertainty on the branching fraction measurement and the second to the uncertainty on . Using the experimental knowledge [45] of the sum , the results of Table 11 can be interpreted as a measurement of which is the least well determined of these matrix elements:
where the uncertainties on the SM parameters are included in the systematic error.
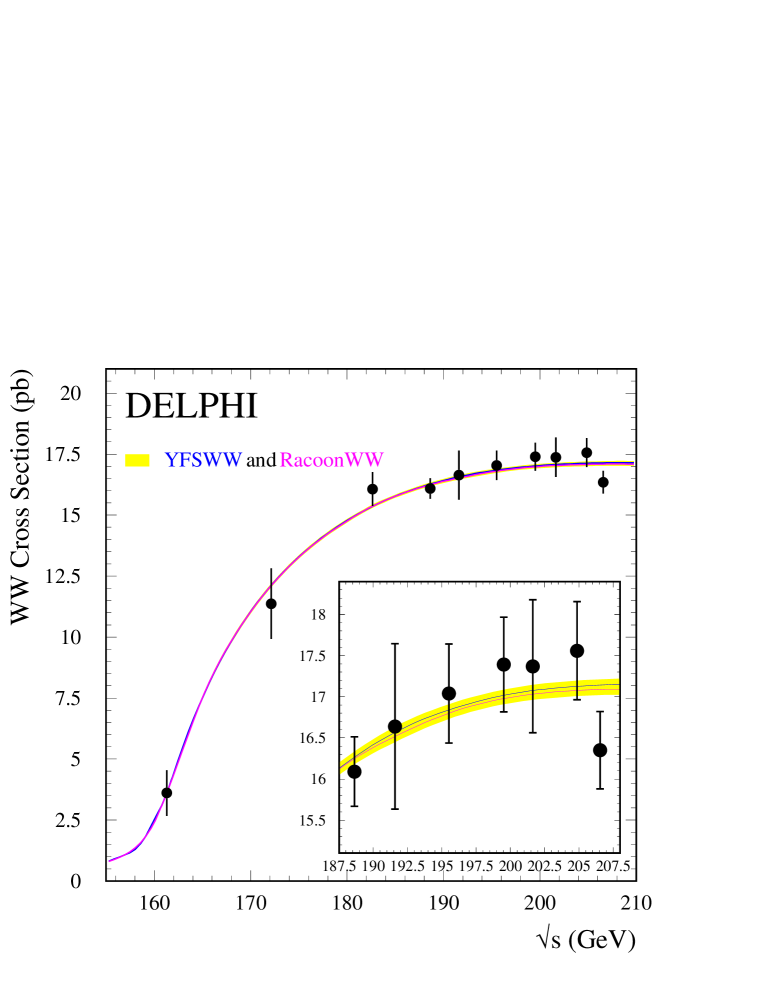
If the SM values of the W branching ratio [45] are assumed, the fitting procedure can be repeated with the total WW production cross-sections as the only free parameter. The results obtained from all the data samples are reported in Table 12. In this table the breakdown of the systematic contributions into the correlation categories defined in Table 9 is also shown. Correlations between the different channels were also taken into account.
| (GeV) | (pb) | (syst.) (pb) | ||
|---|---|---|---|---|
| LCEC | LUEU | LUEC | ||
| 161 | 0.039 | 0.182 | 0.037 | |
| 172 | 0.115 | 0.288 | 0.095 | |
| 183 | 0.100 | 0.044 | 0.126 | |
| 189 | 0.094 | 0.028 | 0.127 | |
| 192 | 0.103 | 0.040 | 0.131 | |
| 196 | 0.100 | 0.033 | 0.133 | |
| 200 | 0.102 | 0.029 | 0.135 | |
| 202 | 0.107 | 0.030 | 0.136 | |
| 205 | 0.107 | 0.039 | 0.136 | |
| 207 | 0.103 | 0.051 | 0.128 | |
A comparison of the results with the most recent calculations in the Double Pole Approximation from RacoonWW and YFSWW is shown in Figure 7. As DPA computations are not reliable close to the WW threshold, the predictions below 168 GeV were obtained running those programs in the Improved Born Approximation (IBA), which only accounts for initial state radiation and Coulomb corrections. The shaded region represents the theoretical uncertainty of the calculations and was obtained by an analytic parametrisation of the relative uncertainty given in [4]. This led to an accuracy on the theoretical curves of about at 168 GeV and of at 200 GeV. The uncertainties from RacoonWW and from YFSWW were merged into a single error band.
The measurements are in very good agreement with the Standard Model expectations.
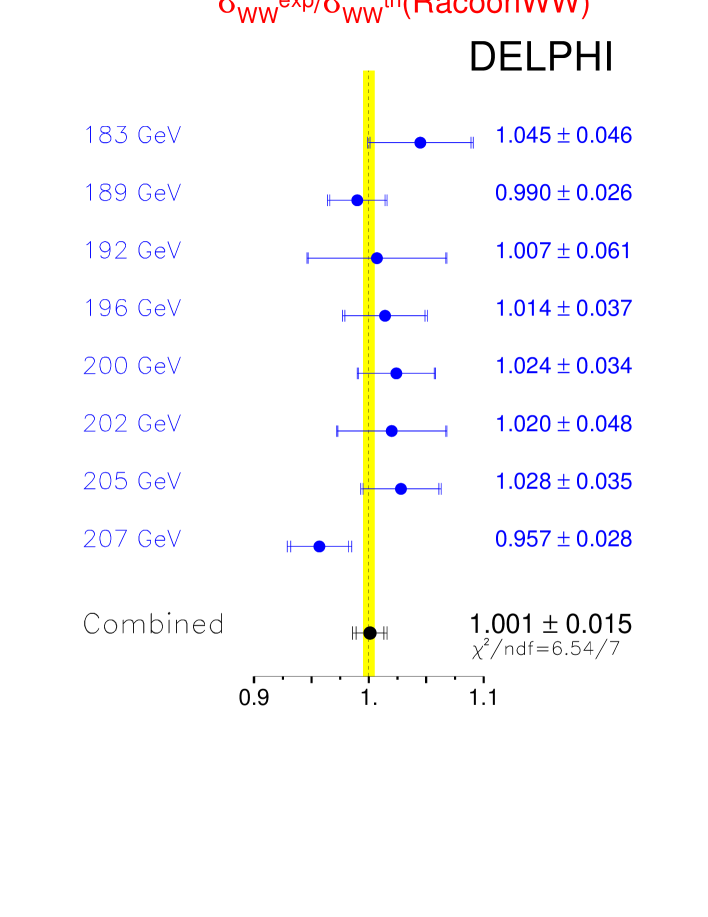
9 Determination of
The cross-section measurements for different energies can be combined into a single value to quantify the overall agreement with theoretical predictions. is defined as the ratio between the experimentally determined cross-section and the theoretical expectations. This procedure was used to compare the measurements at the eight energies between 183 and 207 GeV to the predictions of Gentle, KoralW, YFSWW and RacoonWW. The measurements at 161 and 172 GeV were not used because of the high sensitivity of the cross-section to the value of the W mass at these energies.
For each calculation, the cross-sections were converted into ratios by dividing them by the corresponding theoretical predictions, and combined taking into account the energy correlation of the systematics.
The theoretical errors on the calculations, due to both physical and technical precision of the generators used, were also propagated to the ratios.
| Theoretical prediction | |
|---|---|
| Gentle2.0 | 0.974 0.015 (exp) 0.019(theo) |
| KoralW | 0.979 0.015 (exp) 0.010(theo) |
| YFSWW | 0.999 0.015 (exp) 0.005(theo) |
| RacoonWW | 1.001 0.015 (exp) 0.005(theo) |
The values of at the various centre-of-mass energies are presented in Figure 8 for the RacoonWW calculation. The band on the figure represents the theoretical error on the prediction, where its dependence on energy is ignored for simplicity. The values from the combination of all the data using different theoretical calculations are shown in Table 13. Both statistical and systematic contributions are indicated. It is worth noting how the estimated theory error (taken from [4], page 34) decreases from Gentle to RacoonWW and that the final experimental precision on with the DELPHI data at LEP2 approaches , to be compared with from the best theory computations. The data favour the more complete inclusion of radiative corrections in the calculation at the level of 1.5 .
10 Conclusions
The WW production cross-section from annihilations has been measured at ten centre-of-mass energies between 161 and 209 GeV with the DELPHI experiment at LEP. The data correspond to a total integrated luminosity of about 670 pb-1.
The results are in agreement with the predictions of the most recent CC03 cross-section calculations and test them to an accuracy of about 1.5%.
Differential distributions in the polar angle of the reconstructed W are also measured in the semileptonic channels.
The W branching fractions are measured with an uncertainty of less than for individual leptons and about for hadrons. They also agree with the Standard Model expectation. From the leptonic branching fraction a precise determination of is derived.
Acknowledgements
We are greatly indebted to our technical
collaborators, to the members of the CERN-SL Division for the excellent
performance of the LEP collider, and to the funding agencies for their
support in building and operating the DELPHI detector.
We acknowledge in particular the support of
Austrian Federal Ministry of Education, Science and Culture,
GZ 616.364/2-III/2a/98,
FNRS–FWO, Flanders Institute to encourage scientific and technological
research in the industry (IWT), Federal Office for Scientific, Technical
and Cultural affairs (OSTC), Belgium,
FINEP, CNPq, CAPES, FUJB and FAPERJ, Brazil,
Czech Ministry of Industry and Trade, GA CR 202/99/1362,
Commission of the European Communities (DG XII),
Direction des Sciences de la Matire, CEA, France,
Bundesministerium fr Bildung, Wissenschaft, Forschung
und Technologie, Germany,
General Secretariat for Research and Technology, Greece,
National Science Foundation (NWO) and Foundation for Research on Matter (FOM),
The Netherlands,
Norwegian Research Council,
State Committee for Scientific Research, Poland, SPUB-M/CERN/PO3/DZ296/2000,
SPUB-M/CERN/PO3/DZ297/2000 and 2P03B 104 19 and 2P03B 69 23(2002-2004)
JNICT–Junta Nacional de Investigação Científica
e Tecnolgica, Portugal,
Vedecka grantova agentura MS SR, Slovakia, Nr. 95/5195/134,
Ministry of Science and Technology of the Republic of Slovenia,
CICYT, Spain, AEN99-0950 and AEN99-0761,
The Swedish Natural Science Research Council,
Particle Physics and Astronomy Research Council, UK,
Department of Energy, USA, DE-FG02-01ER41155,
EEC RTN contract HPRN-CT-00292-2002.
Appendix A: Results on W polar angle measurements
The details of the results for the measurement of the W- polar angle differential cross-section are reported in Table 14. For convenience the integrated luminosities and the lumosity-weighted centre-of-mass energies in each of the energy bins defined in the text are also provided.
Table 15 presents the signal event migration matrix determined from the Monte Carlo. The Standard Model W polar angle differential distribution is therefore implicitly assumed.
| 180-184 GeV | 184-194 GeV | 194-204 GeV | 204-210 GeV | ||||||
| (pb-1) | 51.63 | 178.32 | 193.52 | 198.59 | |||||
| weighted (GeV) | 182.65 | 189.03 | 198.46 | 205.91 | |||||
| [-1,-0.8) | 0.715 | 0.865 | 0.600 | 0.275 | |||||
| (meas) | (exp) | 0.320 | 0.320 | 0.180 | 0.165 | 0.155 | 0.150 | 0.120 | 0.145 |
| (back) | (eff) | 0.045 | 0.020 | 0.040 | 0.020 | 0.025 | 0.015 | 0.020 | 0.015 |
| [-0.8,-0.6) | 0.795 | 0.760 | 0.675 | 0.590 | |||||
| (meas) | (exp) | 0.315 | 0.315 | 0.170 | 0.170 | 0.160 | 0.160 | 0.145 | 0.150 |
| (back) | (eff) | 0.025 | 0.025 | 0.020 | 0.020 | 0.015 | 0.020 | 0.015 | 0.020 |
| [-0.6,-0.4) | 1.175 | 0.990 | 1.510 | 0.575 | |||||
| (meas) | (exp) | 0.380 | 0.350 | 0.185 | 0.180 | 0.215 | 0.170 | 0.140 | 0.160 |
| (back) | (eff) | 0.020 | 0.035 | 0.020 | 0.035 | 0.015 | 0.030 | 0.010 | 0.025 |
| [-0.4,-0.2) | 1.365 | 0.930 | 1.150 | 0.930 | |||||
| (meas) | (exp) | 0.400 | 0.370 | 0.180 | 0.200 | 0.190 | 0.180 | 0.170 | 0.175 |
| (back) | (eff) | 0.015 | 0.035 | 0.015 | 0.035 | 0.015 | 0.035 | 0.010 | 0.035 |
| [-0.2,0) | 1.350 | 1.330 | 1.055 | 1.000 | |||||
| (meas) | (exp) | 0.400 | 0.405 | 0.215 | 0.215 | 0.185 | 0.200 | 0.175 | 0.195 |
| (back) | (eff) | 0.015 | 0.040 | 0.015 | 0.040 | 0.015 | 0.035 | 0.015 | 0.035 |
| [0,0.2) | 1.745 | 1.460 | 1.635 | 1.190 | |||||
| (meas) | (exp) | 0.450 | 0.450 | 0.225 | 0.240 | 0.225 | 0.230 | 0.195 | 0.220 |
| (back) | (eff) | 0.025 | 0.085 | 0.020 | 0.085 | 0.015 | 0.085 | 0.010 | 0.085 |
| [0.2,0.4) | 1.995 | 1.675 | 2.115 | 2.120 | |||||
| (meas) | (exp) | 0.485 | 0.505 | 0.240 | 0.270 | 0.255 | 0.260 | 0.255 | 0.250 |
| (back) | (eff) | 0.015 | 0.050 | 0.015 | 0.050 | 0.010 | 0.045 | 0.010 | 0.045 |
| [0.4,0.6) | 2.150 | 2.630 | 3.175 | 2.655 | |||||
| (meas) | (exp) | 0.510 | 0.580 | 0.300 | 0.320 | 0.320 | 0.310 | 0.290 | 0.300 |
| (back) | (eff) | 0.015 | 0.065 | 0.015 | 0.060 | 0.015 | 0.055 | 0.010 | 0.055 |
| [0.6,0.8) | 4.750 | 4.635 | 4.470 | 4.585 | |||||
| (meas) | (exp) | 0.775 | 0.695 | 0.405 | 0.385 | 0.385 | 0.380 | 0.385 | 0.380 |
| (back) | (eff) | 0.030 | 0.095 | 0.025 | 0.100 | 0.025 | 0.105 | 0.020 | 0.110 |
| [0.8,1] | 6.040 | 5.400 | 7.140 | 7.290 | |||||
| (meas) | (exp) | 0.895 | 0.850 | 0.455 | 0.490 | 0.500 | 0.505 | 0.505 | 0.520 |
| (back) | (eff) | 0.035 | 0.075 | 0.035 | 0.085 | 0.030 | 0.100 | 0.030 | 0.110 |
| gen 1 | gen 2 | gen 3 | gen 4 | gen 5 | gen 6 | gen 7 | gen 8 | gen 9 | gen 10 | |
|---|---|---|---|---|---|---|---|---|---|---|
| sel 1 | 71.8 | 13.4 | 2.1 | 1.3 | 0.5 | 0.4 | 0.1 | 0.5 | 1.8 | 8.0 |
| sel 2 | 11.4 | 61.7 | 15.4 | 2.7 | 2.1 | 0.8 | 0.6 | 0.7 | 2.4 | 2.2 |
| sel 3 | 1.5 | 12.2 | 57.2 | 16.7 | 4.2 | 1.5 | 1.4 | 1.8 | 2.1 | 1.3 |
| sel 4 | 0.8 | 1.9 | 11.7 | 58.9 | 16.8 | 4.1 | 2.6 | 1.5 | 0.9 | 0.8 |
| sel 5 | 0.2 | 0.5 | 1.7 | 12.8 | 56.4 | 18.9 | 5.0 | 2.4 | 1.1 | 1.0 |
| sel 6 | 0.2 | 0.2 | 0.4 | 1.8 | 12.9 | 58.8 | 18.7 | 3.9 | 1.9 | 1.3 |
| sel 7 | 0.1 | 0.1 | 0.4 | 0.6 | 1.7 | 12.0 | 59.8 | 19.9 | 4.0 | 1.5 |
| sel 8 | 0.0 | 0.1 | 0.1 | 0.3 | 0.5 | 1.7 | 11.6 | 63.3 | 19.4 | 3.2 |
| sel 9 | 0.1 | 0.0 | 0.1 | 0.1 | 0.2 | 0.4 | 0.9 | 9.9 | 70.7 | 17.6 |
| sel 10 | 0.1 | 0.0 | 0.0 | 0.0 | 0.1 | 0.1 | 0.2 | 0.7 | 7.4 | 91.4 |
References
- [1]
- [2]
- [3]
- [4] M. Grünewald et al., Four-Fermion Production in Electron-Positron Collisions, in Report of the Working Groups on precision calculations for LEP2 physics, ed. S. Jadach et al., CERN 2000-009 (2000) 1 [hep-ph/0005309].
- [5] W. Beenakker, F. A. Berends et al., WW Cross-Section and Distributions, Physics at LEP2, eds. G. Altarelli, T. Sjöstrand and F. Zwirner, CERN 96-01 (1996) Vol. 1, 79.
-
[6]
DELPHI Collaboration, P. Aarnio et al.,
Nucl. Instr. and Meth. A303 (1991) 233;
DELPHI Collaboration, P. Abreu et al., Nucl. Instr. and Meth. A378 (1996) 57. - [7] The DELPHI trigger group, A. Augustinus et al., CERN-EP 2002-082, submitted to NIM A.
- [8] The DELPHI Silicon Tracker Group, P. Chochula et al., Nucl. Instr. and Meth. A412 (1998) 304.
- [9] S. J. Alvsvaag et al., Nucl. Instr. and Meth. A425 (1999) 106.
- [10] DELPHI Collaboration, P. Abreu et al., Phys. Lett. B479 (2000) 89.
- [11] DELPHI Collaboration, P. Abreu et al., Phys. Lett. B456 (1999) 310.
-
[12]
DELPHI Collaboration, P. Abreu et al., Eur. Phys. J. C2 (1998) 581;
DELPHI Collaboration, P. Abreu et al., Phys. Lett. B397 (1997) 158. -
[13]
E. Accomando and A. Ballestrero, Comp. Phys. Comm.
99 (1997) 270;
E. Accomando, A. Ballestrero and E. Maina, Comp. Phys. Comm. 150 (2003) 166. -
[14]
T. Sjöstrand, PYTHIA 5.719 / JETSET 7.4,
Physics at LEP2, eds. G. Altarelli,
T. Sjöstrand and F. Zwirner, CERN 96-01 (1996) Vol. 2, 41;
T. Sjöstrand et al., Comp. Phys. Comm. 135 (2001) 238. - [15] L. Lönnblad, Comp. Phys. Comm. 71 (1992) 15.
- [16] G. Corcella et al., Comp. Phys. Comm. 67 (1992) 465.
- [17] F.A. Berends, P.H. Daverveldt and R. Kleiss, Comp. Phys. Comm. 40 (1986) 285.
- [18] F.A. Berends, P.H. Daverveldt and R. Kleiss, Comp. Phys. Comm. 40 (1986) 271.
- [19] S. Jadach, W. Placzek, M. Skrzypek, B.F.L. Ward and Z. Was, Comp. Phys. Comm. 140 (2001) 432.
- [20] A. Ballestrero, R. Chierici, F. Cossutti and E. Migliore, Comp. Phys. Comm. 152 (2003) 175.
- [21] S. Jadach, B.F.L. Ward and Z. Was, Comp. Phys. Comm. 130 (2000) 260.
- [22] S. Jadach, B.F.L. Ward and Z. Was, Comp. Phys. Comm. 79 (1994) 503.
- [23] DELPHI Collaboration, P. Abreu et al., Zeit. Phys. C73 (1996) 11.
- [24] S. Jadach, W. Placzek and B.F.L. Ward, Phys. Lett. B390 (1997) 298.
- [25] S. Catani et al., Phys. Lett. B269 (1991) 432.
- [26] P. Abreu et al, Nucl. Instr. and Meth. A427 (1999) 487.
- [27] C. Peterson, T. Rögnvaldsson, L. Lönnblad, Comp. Phys. Comm. 81 (1994) 185.
- [28] K.-H. Becks, J. Drees, U. Flagmeyer and U. Müller, Nucl. Instr. and Meth. A426 (1999) 599.
- [29] G.C. Fox and S. Wolfram, Nucl. Phys. B149 (1979) 413; Erratum-ibid. B157 (1979) 543.
- [30] T.G.M. Malmgren, Comp. Phys. Comm. 106 (1997) 230.
- [31] MLPfit, written by J. Schwindling, B. Mansoulié and O. Couet. More information in http://schwind.home.cern.ch/schwind/MLPfit.html
- [32] The LEP WW Working Group, LEPEWWG/2002-02, available from http://lepewwg.web.cern.ch/LEPEWWG/Welcome.html.
- [33] F. Boudjema, B. Mele et al., Standard Model Processes, Physics at LEP2, eds. G. Altarelli, T. Sjöstrand and F. Zwirner, CERN 96-01 (1996) Vol. 1, 207.
- [34] U.Flagmeyer et al, Contributed paper for EPS HEP 2001 (Budapest) and LP01 (Rome), DELPHI 2001-059 CONF 487 (2001), publication in preparation.
- [35] T. Sjöstrand and V.A. Khoze, Z. Phys. C62 (1994) 281.
- [36] L.Lönnblad, T.Sjöstrand, Eur. Phys. J. C2 (1998) 165.
- [37] A. Denner et al., Phys. Lett. B475 (2000) 127.
- [38] D. Bardin et al., Comp. Phys. Comm. 104 (1997) 161.
- [39] D. Bardin, R. Kleiss et al., in Physics at LEP2, G. Altarelli, T. Sjöstrand and F. Zwirner eds., CERN 96-01 (1996), Vol. 2, pg 3. hep-ph/9709270
- [40] R. Chierici and F. Cossutti, Eur. Phys. J. C23 (2002) 65.
- [41] A.P. Chapovsky and V.A. Khoze, Eur. Phys. J. C9 (1999) 449.
- [42] D. R. Yennie, S. C. Frautschi, H. Suura, Annals of Phys. 13, (1961) 379.
-
[43]
E. Barberio, B. van Eijk and Z Was, Comput. Phys. Commun.
66 (1991) 115,
E. Barberio and Z. Was, Comp. Phys. Comm. 79 (1994) 291. - [44] W. Placzek et al., CERN-TH 99-07 and hep-ph/9903381.
- [45] K. Hagiwara et al., Phys. Rev. D66, (2002) 010001.

|
 |
 |
|---|