E787 Collaboration
Further search for the decay in the momentum region
Abstract
We report the results of a search for the decay in the kinematic region with momentum MeV/c using the data collected by the E787 experiment at BNL. No events were observed. When combined with our previous search in this region, one candidate event with an expected background of events results in a 90% C.L. upper limit of on the branching ratio of . We also report improved limits on the rates of and where are hypothetical, massless, long-lived neutral particles.
pacs:
13.20.Eb, 12.15.Hh, 14.80.MzThe decay is a flavor changing neutral current process which is highly suppressed at tree level by the Glashow-Iliopoulos-Maiani mechanism GIM ; however, the breaking of flavor symmetry, which results in differences in the quark masses, allows this decay to proceed at a very small rate at the loop level. The large top quark mass results in dominance of the top quark contribution, making this decay very sensitive to the coupling of the top quark to the down quark, , in the Cabibbo-Kobayashi-Maskawa mixing matrix. The branching ratio for this rare decay has been measured to be based on the observation of three events in the momentum phase space region (Region 1) pnn1_e949 , using the data collected by the E787 pnn1 ; nim1 ; nim ; ccd ; ec ; utc ; td ; pnn195 and E949 pnn1_e949 ; e949 experiments at the Alternating Gradient Synchrotron (AGS) of Brookhaven National Laboratory. The standard model (SM) predicts the branching ratio for this decay mode to be smp1 . Physics beyond the SM involving new heavy particles can interfere with the SM diagrams and alter the decay rate and the kinematic spectrum smp1 ; bsmp ; bs . It is therefore important to obtain higher statistics for this decay and to extend the measurement to other regions of phase space. In an earlier paper pnn2_96 , we reported the results from the kinematic search region below the peak with momentum, (MeV/c) (Region 2), using the data collected by the E787 experiment during the 1996 run. In this letter, we present results for the same kinematic region from additional data collected during the 1997 run.
![[Uncaptioned image]](/html/hep-ex/0403034/assets/x1.png)
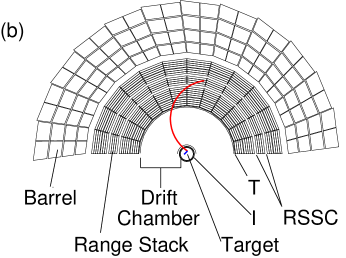
Event recognition for must rely on the detection of the incoming kaon and the outgoing pion only, since the two neutrinos are undetectable. Kaons were produced by 24 GeV protons from the AGS impinging on a 6 cm long platinum target. The beam was then transported, purified, and momentum selected using electrostatic separators, two dipole magnets, several focussing magnets and collimators nim . The resulting beam contained kaons and pions in the ratio of 4:1. The incoming beam particles were identified by a Čerenkov detector and wire chambers and were slowed down by a passive BeO degrader and a lead-glass detector. The cylindrical lead-glass detector, which operated as a Čerenkov light radiator (11.2 cm diameter and 10 cm long or 3.5 radiation lengths) was designed to detect incoming pions as well as electromagnetic showers from kaon decays, while being insensitive to the incident kaons. Čerenkov light from the lead-glass was collected from the sides of the cylinder by a 1 cm thick Lucite sleeve coupled with silicone gel. The Lucite sleeve was glued to 16 azimuthally segmented trapezoidal lead-glass pieces. Each of these pieces was instrumented with a fine-mesh photo-multiplier tube (PMT) which was operated in the 1 T magnetic field. The PMTs were located in a ring surrounding the BeO degrader and were read out by TDCs. Kaons were stopped in the target consisting of 413 long plastic scintillating fibers, packed axially to form a 12 cm diameter cylinder. Each fiber was read out by a PMT. Gaps in the outer edges of the target were filled with 3.5 mm, 2 mm, and 1 mm fibers which were connected to PMTs in groups. The PMTs were read out by ADCs, TDCs, and 500 MHz transient digitizers based on GaAs charge-coupled devices (CCDs)ccd . The location, trajectory and momentum of the outgoing charged particles were measured by a drift chamber utc . The range () and kinetic energy () of the charged particles were measured in a 21 layer Range Stack of plastic scintillator and the target. The signals from the PMTs mounted on the Range Stack were recorded by ADCs and by 500 MHz transient digitizers (TDs) td . The TDs had the ability to record pulses for 6.4 microseconds after the event trigger, which enabled the observation of the decay sequence, in the Range Stack. An electromagnetic calorimeter consisting of a 14-radiation length lead/scintillator barrel detector and 13.5-radiation length endcaps of undoped CsI crystals ec was used to veto photons. Also, two collar counters composed of lead/scintillator with a total thickness of 4.6 radiation lengths and a microcollar detector composed of plastic scintillator fibers and lead foil stacked around the beamline with a radial thickness of 0.7 radiation length were used to detect photons which traveled at small angles relative to the beamline and thereby missed the barrel detector and the endcap detector. Fig. 1 shows schematic side and end views of the E787 detector.
The data were obtained with a flux of kaons per 1.6 s long spill (period of 3.6 s) and with incident kaon momenta of 710 MeV/c or 670 MeV/c mom . A multilevel trigger ensured that a kaon entered the target and decayed at rest, with an outgoing particle identified as a pion by the decay sequence observed in the TD read-out of the Range Stack, and with no other accompanying particles such as photons. In addition to the trigger, several monitor triggers with variable pre-scale factors were used to accumulate events from () and decays. A total of about 100 events per spill were written to data storage devices.
To eliminate possible selection bias, a “blind” analysis technique was used, which required the background sources to be identified a priori and the signal region to be pre-defined. The events in the signal region were not counted or examined until the cuts and the background estimates were final. At least two uncorrelated cuts with high rejection were designed for most of the backgrounds. Each of these cuts was independently reversed to create high statistics background samples to study the rejection power of the other cut. To minimize bias in the background measurements, the data were divided into one-third and two-third samples selected uniformly from the entire data set. Cuts were designed and optimized on the one-third sample and the background was then measured on the two-third sample.
As discussed in pnn2_96 , the background in Region 2 was found to be dominated by events in which the charged pion underwent a nuclear interaction near the kaon decay vertex, most probably on a carbon nucleus in the target plastic scintillator. The scattering of the pion reduced its kinetic energy into the signal region and removed the directional correlation with the photons from the decay, most of which would otherwise be detected by the barrel detector. The limited efficiency of the photon detectors along the beam axis enhanced this background. During the 1997 run the lead-glass detector efficiency was improved in order to further suppress this background; however, most of the electromagnetic showers detected in the lead-glass detector were also observed in the endcap detector so that no additional background rejection was achieved. The improved efficiency of the lead-glass detector did, however, enable an increase in the photon veto efficiency by about 10% with respect to the 1996 data analysis.
The two sets of analysis tools for suppressing the scattered background were the detection of photons from the decay and the identification of the scattering in the target. The signatures for scattering included kinks in the pattern of target fibers attributed to the outgoing pion, tracks that did not point back to the fiber in which the kaon decayed, energy deposits inconsistent with the ionization energy loss for a pion of the measured momentum, extra deposited energy at the time of the outgoing pion in one of the target fibers traversed by the kaon. The extra energy left by pions in fibers traversed by the kaon was identified by examining the pulse shapes recorded in the CCDs for each kaon fiber using a fit. Events were rejected in which an overlapping second pulse, coincident in time with the pion, was found to have energy larger than 1.5 MeV cut_96 . Improved calibration of the target CCDs as well as this higher energy threshold for the second pulse energy resulted in about 7% more acceptance with the same level of background reduction in the 1997 data set as compared to the 1996 data set bipul .
| Process | Background |
|---|---|
| Beam | |
| CEX | |
| Total |
| Acceptance factors | |
|---|---|
| stopping efficiency | 0.708 |
| Time consistency cuts | 0.672 |
| phase space | 0.345 |
| Geometry | 0.311 |
| nucl. int. and decay in flight | 0.708 |
| Reconstruction efficiency | 0.943 |
| Kinematic cuts | 0.697 |
| decay chain | 0.490 |
| Beam and Target analysis | 0.494 |
| CCD acceptance | 0.431 |
| Photon veto efficiency | 0.390 |
| Total acceptance | |
| Total number of stopped | |
| Single Event Sensitivity |
The other backgrounds in the search for in Region 2 were , , , (), scattered beam pions, and charge exchange (CEX) reactions resulting in decays , where or . The contribution from these processes to the total background was small compared to scattered decays. The techniques used to measure these backgrounds were discussed in pnn2_96 . Table 1 summarizes the contribution from each background process. The uncertainty in the background estimate due to scattered events was dominated by the systematic uncertainty of the photon veto efficiency. This systematic uncertainty was estimated by measuring the photon veto efficiency on several sets of scattered events; each set was tagged by a different signature for the scattering in the target bipul . The background estimates from the other processes were limited by statistics of the data samples. Table 2 shows the acceptance factors and single event sensitivity. We gained about 6% acceptance in the stopping efficiency due to the lower beam momentum during the 1997 run; another 14% gain in acceptance was achieved by better optimization of cuts on the relative times of signals from the beam and target detectors. However, we lost about 11% in acceptance in the detection of the decay sequence due to a fault in the trigger during the 1997 run. The effective branching ratio of the background is measured to be , which remains unchanged from the analysis of the 1996 data set pnn2_96 . The analysis and detector improvements described in this paper led to an acceptance increase of about 27% from the previous analysis pnn2_96 .
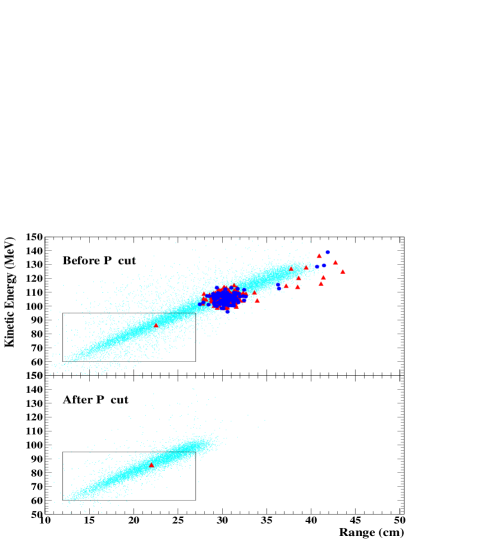
Once the background estimates were finalized, the signal region (Region 2) was examined. No events were observed in the 1997 data set. The observation of one candidate event in the combined 1996-97 data set is consistent with the total background estimate of . Fig. 2 shows the kinematics of the remaining events before and after the cut on momentum ( MeV/c) for the combined data set. The event, reported in pnn2_96 , has , , and with a kaon decay time of 17.7 ns.

The total numbers of stopped in the target were and for the 1996 and 1997 data sets, respectively. Using the combined exposure, the acceptances of from the 1996 data set pnn2_96 and that reported in Table 2, and the observation of one event in Region 2, we calculated the upper limit of (90% C.L.) feldman . This result is a factor of two smaller than the result reported in pnn2_96 .
For non-standard scalar and tensor interactions in the process of , where and are hypothetical, massless, long-lived neutral particles, we set upper limits on their branching ratios at and , respectively (90% C.L.) feldman ; scaler .
This measurement is also sensitive to , where is a hypothetical long-lived weakly interacting particle, or system of particles. Fig. 3 shows the 90% C.L. upper limits on together with the previous limit from pnn2_96 .
The search for in Region 2 was background limited and another factor of five in background reduction is needed to achieve a signal to noise ratio of one with the measured branching ratio in pnn1_e949 . New data from experiment E949 e949 , an upgraded version of E787, will provide further information in both phase space regions.
Acknowledgement
We gratefully acknowledge the dedicated efforts of the technical staff
supporting this experiment and the Brookhaven AGS Department.
This research was supported in part by the U.S. Department of Energy
under Contracts No. DE-AC0298CH10886, and grant
DE-FG02-91ER40671, by the Ministry of Education,
Culture, Sports, Science and Technology
of Japan through the Japan-US Cooperative Research
Program in High Energy Physics and under the Grant-in-Aids for Scientific
Research, encouragement of Young Scientists and for JSPS Fellows, and by
the Natural Sciences and Engineering Research Council and the National
Research Council of Canada.
References
- (1) S. L. Glashow, J. Iliopoulos, and L. Maiani, Phys. Rev. D2, 1285 (1970).
- (2) V. V. Anisimovsky et al. [arXiv:hep-ex/0403036], To be published in Phys. Rev. Lett. .
- (3) S. Adler et al., Phys. Rev. Lett. 88, 041803 (2002).
- (4) M.S. Atiya et al., Nucl. Instrum. Meth. Phys. Res. A321, 129 (1992).
- (5) J. Doornbos et al., Nucl. Instrum. Meth. A444 546 (2000).
- (6) D.A. Bryman et al., Nucl. Instrum. Meth. A396 394 (1997).
- (7) E.W. Blackmore et al., Nucl. Instrum. Meth. Phys. Res. A404, 295 (1998).
- (8) M.S. Atiya et al., Nucl. Instrum. Meth. Phys. Res. A279, 180 (1989).
- (9) I-H. Chiang et al., IEEE Trans. Nucl. Sci. NS-42, 394 (1995). T.K. Komatsubara et al., Nucl. Instrum. Meth. A404, 315 (1998).
- (10) S. Adler et al., Phys. Rev. Lett. 79, 2204 (1997).
- (11) B. Bassalleck et al., E949 Proposal, BNL-67247, TRI-PP-00-06 (1999).
- (12) A.J. Buras et al. [arXiv:hep-ph/0405132].
- (13) G. Isidori, in Kaon Physics, edited by J. L. Rosner and B. D. Winstein (The University of Chicago Press, Chicago, 2001), p.355.
- (14) S. Bertolini and A. Santamaria, Nucl. Phys. B315, 558 (1989).
- (15) S. Adler et al., Phys. Lett. B537, 211 (2002).
- (16) The beam momentum was lowered from 710 MeV/c to 670 MeV/c roughly in the middle of the 1997 run.
- (17) This energy threshold was set at 1 MeV for the 1996 data set.
- (18) B. Bhuyan, Ph. D. Thesis, University of Delhi (2003).
- (19) Review of Particle Physics, Eur. Phys. Jour. 15, 201 (2000). G. J. Feldman and R. D. Cousins, Phys. Rev. D57, 3873 (1998). We have used the 90% C.L. upper limit of 3.14 for one observed event with expected background of 1.22.
- (20) For non-standard scalar and tensor interactions, the single event sensitivites were and , respectively from the combined 1996-97 data set.