on leave from ]Fermi National Accelerator Laboratory, Batavia, Illinois 60510
on leave from ]Nova Gorica Polytechnic, Nova Gorica The Belle Collaboration
Measurement of the Branching Fractions for and
.
C. H. Wang
National United University, Miao Li
K. Abe
High Energy Accelerator Research Organization (KEK), Tsukuba
K. Abe
Tohoku Gakuin University, Tagajo
N. Abe
Tokyo Institute of Technology, Tokyo
T. Abe
High Energy Accelerator Research Organization (KEK), Tsukuba
I. Adachi
High Energy Accelerator Research Organization (KEK), Tsukuba
H. Aihara
Department of Physics, University of Tokyo, Tokyo
M. Akatsu
Nagoya University, Nagoya
T. Aso
Toyama National College of Maritime Technology, Toyama
V. Aulchenko
Budker Institute of Nuclear Physics, Novosibirsk
T. Aushev
Institute for Theoretical and Experimental Physics, Moscow
S. Bahinipati
University of Cincinnati, Cincinnati, Ohio 45221
A. M. Bakich
University of Sydney, Sydney NSW
Y. Ban
Peking University, Beijing
S. Banerjee
Tata Institute of Fundamental Research, Bombay
S. Blyth
Department of Physics, National Taiwan University, Taipei
A. Bondar
Budker Institute of Nuclear Physics, Novosibirsk
A. Bozek
H. Niewodniczanski Institute of Nuclear Physics, Krakow
M. Bračko
University of Maribor, Maribor
J. Stefan Institute, Ljubljana
T. E. Browder
University of Hawaii, Honolulu, Hawaii 96822
Y. Chao
Department of Physics, National Taiwan University, Taipei
K.-F. Chen
Department of Physics, National Taiwan University, Taipei
B. G. Cheon
Sungkyunkwan University, Suwon
R. Chistov
Institute for Theoretical and Experimental Physics, Moscow
S.-K. Choi
Gyeongsang National University, Chinju
Y. Choi
Sungkyunkwan University, Suwon
A. Chuvikov
Princeton University, Princeton, New Jersey 08545
S. Cole
University of Sydney, Sydney NSW
M. Danilov
Institute for Theoretical and Experimental Physics, Moscow
L. Y. Dong
Institute of High Energy Physics, Chinese Academy of Sciences, Beijing
S. Eidelman
Budker Institute of Nuclear Physics, Novosibirsk
V. Eiges
Institute for Theoretical and Experimental Physics, Moscow
T. Gershon
High Energy Accelerator Research Organization (KEK), Tsukuba
B. Golob
University of Ljubljana, Ljubljana
J. Stefan Institute, Ljubljana
J. Haba
High Energy Accelerator Research Organization (KEK), Tsukuba
N. C. Hastings
High Energy Accelerator Research Organization (KEK), Tsukuba
H. Hayashii
Nara Women’s University, Nara
M. Hazumi
High Energy Accelerator Research Organization (KEK), Tsukuba
L. Hinz
Swiss Federal Institute of Technology of Lausanne, EPFL, Lausanne
T. Hokuue
Nagoya University, Nagoya
Y. Hoshi
Tohoku Gakuin University, Tagajo
W.-S. Hou
Department of Physics, National Taiwan University, Taipei
Y. B. Hsiung
[
Department of Physics, National Taiwan University, Taipei
H.-C. Huang
Department of Physics, National Taiwan University, Taipei
T. Iijima
Nagoya University, Nagoya
K. Inami
Nagoya University, Nagoya
A. Ishikawa
High Energy Accelerator Research Organization (KEK), Tsukuba
R. Itoh
High Energy Accelerator Research Organization (KEK), Tsukuba
H. Iwasaki
High Energy Accelerator Research Organization (KEK), Tsukuba
M. Iwasaki
Department of Physics, University of Tokyo, Tokyo
J. H. Kang
Yonsei University, Seoul
J. S. Kang
Korea University, Seoul
P. Kapusta
H. Niewodniczanski Institute of Nuclear Physics, Krakow
N. Katayama
High Energy Accelerator Research Organization (KEK), Tsukuba
H. Kawai
Chiba University, Chiba
T. Kawasaki
Niigata University, Niigata
H. Kichimi
High Energy Accelerator Research Organization (KEK), Tsukuba
H. J. Kim
Yonsei University, Seoul
J. H. Kim
Sungkyunkwan University, Suwon
S. K. Kim
Seoul National University, Seoul
P. Koppenburg
High Energy Accelerator Research Organization (KEK), Tsukuba
S. Korpar
University of Maribor, Maribor
J. Stefan Institute, Ljubljana
P. Križan
University of Ljubljana, Ljubljana
J. Stefan Institute, Ljubljana
P. Krokovny
Budker Institute of Nuclear Physics, Novosibirsk
Y.-J. Kwon
Yonsei University, Seoul
G. Leder
Institute of High Energy Physics, Vienna
S. H. Lee
Seoul National University, Seoul
T. Lesiak
H. Niewodniczanski Institute of Nuclear Physics, Krakow
J. Li
University of Science and Technology of China, Hefei
A. Limosani
University of Melbourne, Victoria
S.-W. Lin
Department of Physics, National Taiwan University, Taipei
D. Liventsev
Institute for Theoretical and Experimental Physics, Moscow
J. MacNaughton
Institute of High Energy Physics, Vienna
G. Majumder
Tata Institute of Fundamental Research, Bombay
F. Mandl
Institute of High Energy Physics, Vienna
T. Matsumoto
Tokyo Metropolitan University, Tokyo
W. Mitaroff
Institute of High Energy Physics, Vienna
K. Miyabayashi
Nara Women’s University, Nara
H. Miyata
Niigata University, Niigata
D. Mohapatra
Virginia Polytechnic Institute and State University, Blacksburg, Virginia 24061
G. R. Moloney
University of Melbourne, Victoria
T. Mori
Tokyo Institute of Technology, Tokyo
T. Nagamine
Tohoku University, Sendai
Y. Nagasaka
Hiroshima Institute of Technology, Hiroshima
E. Nakano
Osaka City University, Osaka
M. Nakao
High Energy Accelerator Research Organization (KEK), Tsukuba
Z. Natkaniec
H. Niewodniczanski Institute of Nuclear Physics, Krakow
S. Nishida
High Energy Accelerator Research Organization (KEK), Tsukuba
O. Nitoh
Tokyo University of Agriculture and Technology, Tokyo
S. Ogawa
Toho University, Funabashi
T. Ohshima
Nagoya University, Nagoya
T. Okabe
Nagoya University, Nagoya
S. Okuno
Kanagawa University, Yokohama
S. L. Olsen
University of Hawaii, Honolulu, Hawaii 96822
W. Ostrowicz
H. Niewodniczanski Institute of Nuclear Physics, Krakow
H. Ozaki
High Energy Accelerator Research Organization (KEK), Tsukuba
H. Palka
H. Niewodniczanski Institute of Nuclear Physics, Krakow
C. W. Park
Korea University, Seoul
H. Park
Kyungpook National University, Taegu
N. Parslow
University of Sydney, Sydney NSW
L. E. Piilonen
Virginia Polytechnic Institute and State University, Blacksburg, Virginia 24061
A. Poluektov
Budker Institute of Nuclear Physics, Novosibirsk
M. Rozanska
H. Niewodniczanski Institute of Nuclear Physics, Krakow
H. Sagawa
High Energy Accelerator Research Organization (KEK), Tsukuba
Y. Sakai
High Energy Accelerator Research Organization (KEK), Tsukuba
O. Schneider
Swiss Federal Institute of Technology of Lausanne, EPFL, Lausanne
J. Schümann
Department of Physics, National Taiwan University, Taipei
S. Semenov
Institute for Theoretical and Experimental Physics, Moscow
K. Senyo
Nagoya University, Nagoya
V. Sidorov
Budker Institute of Nuclear Physics, Novosibirsk
J. B. Singh
Panjab University, Chandigarh
N. Soni
Panjab University, Chandigarh
R. Stamen
High Energy Accelerator Research Organization (KEK), Tsukuba
S. Stanič
[
University of Tsukuba, Tsukuba
M. Starič
J. Stefan Institute, Ljubljana
K. Sumisawa
Osaka University, Osaka
T. Sumiyoshi
Tokyo Metropolitan University, Tokyo
S. Suzuki
Yokkaichi University, Yokkaichi
O. Tajima
Tohoku University, Sendai
F. Takasaki
High Energy Accelerator Research Organization (KEK), Tsukuba
N. Tamura
Niigata University, Niigata
M. Tanaka
High Energy Accelerator Research Organization (KEK), Tsukuba
Y. Teramoto
Osaka City University, Osaka
T. Tomura
Department of Physics, University of Tokyo, Tokyo
T. Tsukamoto
High Energy Accelerator Research Organization (KEK), Tsukuba
S. Uehara
High Energy Accelerator Research Organization (KEK), Tsukuba
K. Ueno
Department of Physics, National Taiwan University, Taipei
T. Uglov
Institute for Theoretical and Experimental Physics, Moscow
S. Uno
High Energy Accelerator Research Organization (KEK), Tsukuba
G. Varner
University of Hawaii, Honolulu, Hawaii 96822
C. C. Wang
Department of Physics, National Taiwan University, Taipei
M.-Z. Wang
Department of Physics, National Taiwan University, Taipei
Y. Watanabe
Tokyo Institute of Technology, Tokyo
B. D. Yabsley
Virginia Polytechnic Institute and State University, Blacksburg, Virginia 24061
Y. Yamada
High Energy Accelerator Research Organization (KEK), Tsukuba
A. Yamaguchi
Tohoku University, Sendai
Y. Yamashita
Nihon Dental College, Niigata
M. Yamauchi
High Energy Accelerator Research Organization (KEK), Tsukuba
H. Yanai
Niigata University, Niigata
J. Ying
Peking University, Beijing
Y. Yusa
Tohoku University, Sendai
C. C. Zhang
Institute of High Energy Physics, Chinese Academy of Sciences, Beijing
Z. P. Zhang
University of Science and Technology of China, Hefei
D. Žontar
University of Ljubljana, Ljubljana
J. Stefan Institute, Ljubljana
Abstract
We report improved measurements of branching fractions for
charmless hadronic two-body B meson decays containing
an meson in the final state. The results are
based on a data sample of 78 fb-1 collected on
the resonance by the Belle
detector. We measure the branching fractions and
We give 90% confidence upper limits for
and
We also
obtain the partial rate asymmetries for
and for
pacs:
13.25.Hw, 14.40.Nd
††preprint:
I Introduction
Charmless hadronic decays play an important role in the
understanding of CP violation in the system. These decays
proceed primarily through interfering loop penguin diagrams and tree spectator diagrams.
Studies of , where denotes , ,
, and , are important examples of such
decays. Charge conjugates are implied unless otherwise stated.
We also assume equal production of and
pairs from the .
Table 1: Measurements of branching fractions for and from CLEO, BaBar and Belle. The
units are .
Table 1 lists the branching fractions from previous
measurementsCLEO1 ; CLEO2 ; BaBar ; BaBar1 ; Belle , which indicate
some discrepancies for .
Naive factorization and QCD factorization
approaches theory ; theory1
yield values of consistent
with the experimental results. However, these approaches predict
to be a factor of two larger
than , which is not supported by
Belle’s previous experimental results that were based on a fb-1
data sample Belle .
In this paper, we update our previous measurements
on and
with a 78.1 fb-1 data sample. We also
report measurements of and
decay modes.
II Apparatus and Data Set
The data sample used was collected with the Belle detector at the
KEKB asymmetric energy collider kekb , which
collides 8.0 GeV and 3.5 GeV beams at
a small crossing angle ( mrad).
The data sample contained pairs produced
at the resonance. A 8.8 fb-1 data sample
taken at a center-of-mass energy 60 MeV below the
is used to characterize continuum background.
In order to establish the event selection criteria, we use a
Monte Carlo (MC) generator qq to generate signal, generic
, and other charmless rare B decays.
The GEANT3 package geant is used for detector simulation.
The Belle detector measures charged particles and
photons with high efficiency and precisionNIM .
Charged particle tracking is provided
by a silicon vertex detector (SVD) and a central drift chamber
(CDC) that surround the interaction region. The charged particle
acceptance covers the laboratory polar angle region between
and . Charged hadrons are distinguished by combining the
responses from an array of silica aerogel Čerenkov counters
(ACC), a barrel-like array of 128 time-of-flight scintillation
counters (TOF), and measurements in the CDC. The combined
response provides separation of at least for
laboratory momentum up to 3.5 GeV/. Electromagnetic showers are
detected in an array of 8736 CsI(Tl) crystals (ECL) located inside
the magnetic volume, which covers the same solid angle as the
charged particle tracking system.
The magnet return yoke consists of alternating layers
of resistive plate counters and 4.7 cm thick steel plates for
detecting ’s and identifying muons.
III Event Selection
Hadronic events are selected using criteria based on the charged track
multiplicity and total visible energy sum; the efficiency is
greater than 99% for generic events trig . All primary
charged tracks must satisfy quality
requirements based on their impact parameters relative
to the run-dependent interaction point (IP).
The deviation from the IP position is required
to be within cm in the transverse direction and
cm in the longitudinal direction.
Charged particle identification
is based on the ratio KID/(),
where and are
likelihoods for and hypotheses.
A higher value of KID indicates a more kaon-like particle.
meson candidates are reconstructed from pairs of photons,
each consisting of energy clusters greater than 50 MeV, with
invariant mass within (
MeV/) of the mass. meson candidates
are reconstructed using pairs of oppositely charged particles
that have an invariant mass in the range
480 MeV/ 516 MeV/.
The vertex of the candidate is required to be well
reconstructed and displaced from the interaction point, and the
momentum direction must be consistent with the
flight direction.
Candidate decays are reconstructed
from charged pions with KID and s with center-of-mass
frame momentum greater than 0.35 GeV/.
The meson candidates are required
to have an invariant mass within MeV/ of the nominal
value .
IV Reconstruction
meson candidates are formed by combining an meson
with either a kaon (, ) or a pion (, ).
We require KID and KID for and ,
respectively. Studies from
decays give
particle identification efficiencies,
and with
misidentification rates, and
, respectively.
meson candidates are then identified using
the beam constrained mass = and the energy difference , where GeV, and , are the
momentum and energy of the candidate in the rest
frame. For the calculation, the kaon in candidate
decays is assigned
a pion mass so that and
can be fit simultaneously.
For events with multiple candidates, the best candidate is
selected using the quality of the vertex fit.
According to signal MC,
the resolutions for and are 3 MeV/ and 24 MeV respectively
for , and decays.
For the decay , the resolutions are 3.5 MeV/
for and 55 MeV for .
The candidates are required to be within the rectangular region in the
- plane, GeV/ GeV/ and
GeV. Signal regions of
GeV/ GeV/ and GeV are used
to display fit projections. Sideband
regions are defined
as GeV/ GeV/ with GeV for , and
GeV/ with GeV GeV for .
Since is a decay,
where means vector and means pseudo-scalar particles,
the meson is polarized. The
helicity angle, , is defined as the angle
between the flight direction and the vector perpendicular to the
decay plane in the rest frame.
Further background suppression is achieved using the helicity and
the quality of the vertex fit .
V Background suppression
Backgrounds from decays and the feed-across from other
charmless rare decays are found to be negligible using MC
simulations that assume the best known branching fraction for each decay.
The dominant backgrounds arise from
the (, , or )
continuum process, which has a jet-like event topology in contrast to
the spherical events.
Several event-shape variables are used to distinguish between
decays and continuum background. The thrust angle
is defined as the angle between the primary decay daughter
and the thrust axis formed by all the particles from
the other . is the scalar sum of the
transverse momenta of all particles outside a cone
around the primary decay daughter direction divided by the
scalar sum of their momenta. In addition to these, a set of
variables derived from Fox-Wolfram moments fw are used. The
moments are defined by
and
where stands for particle momentum, and is the
Legendre polynomial. There are two groups of particles that go into this
summation. The index refers to (neutral or charged) particles from the
candidate, while and refer to other particles not from
that candidate. , and are not
used because of their strong correlation with . To optimize the
discrimination, the remaining 5 variables () are combined
with and to form a Fisher discriminant
fisher ; etapk . The cosine of the angle
between the flight direction and the beam axis
(), and are found to be independent,
and their probability density functions (PDFs) are obtained by
using MC samples for signal, and off-resonance data for continuum
background. The variables and are
then combined to form a likelihood ratio , where is the product of signal () PDFs.
A selection requirement is imposed on to reject
continuum background.
A typical cut is and retains approximately
of the signal candidates while reducing the
background by approximately .
VI Analysis
Signal yields are obtained using and
as independent variables in an extended unbinned
maximum likelihood (ML) fit after restrictions are imposed
on the variables ,
and .
These
are: for , for , for
and . For input
candidates, the likelihood is
defined as
where the index runs over each event,
and are the probability densities as
functions of and for signal
and background, respectively. This method treats the extracted
yields for signal and background according to
Poisson statistics
and constrains their sum to the observed number of candidates
at the maximum likelihood.
The signal PDFs are determined from signal MC
while the continuum background PDFs are derived from
the off-resonance data. The background shapes are
verified using data from the sideband region. The PDF
for the background is modeled by a second-order
polynomial function.
The PDF for the background distribution is modeled with
a smooth function with
parameters determined from off-resonance data argus . To
model the low energy tail, the signal PDFs use
a “Crystal Ball” line shape function CBLINE with parameters
determined by fits to signal MC. The PDFs are
the sum of two Gaussian functions with different widths, which were
obtained by fits to signal MC. Studies of and decays were used to fix the
mean . Differences between widths obtained in these
studies and those from the signal MC are regarded as
systematic uncertainties.
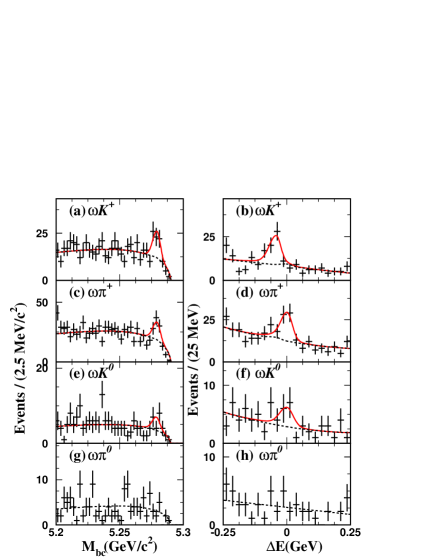
Figure 1: Signal region projections of (left) and
(right) for , , and
. The solid curves show the results
of the 2D fits with the background components represented
as dashed curves. Small background enhancements near
MeV in (b) and MeV in (d) are from misidentified
and decays.
The overall reconstruction efficiencies, ,
are the products of detection efficiencies,
determined from MC with no KID requirements,
and KID efficiencies determined from
, events in the data.
The statistical significance () is
defined as ,
where is the maximum likelihood at the
nominal signal yield and is the likelihood with
the signal fixed at zero. The 90% confidence level upper limit is calculated
from the equation
where only the statistical uncertainties are considered. For the final
upper limit, the above limit is increased by one standard
deviation of the systematic error.
Table 2: Signal yields(), efficiencies() including
secondary decay branching fractions, fit
significances(), branching fractions(),
and confidence level upper limits (UL)
on the branching fractions for and .
Mode
UL
8.1
-
8.7
-
3.3
7.6
5.2
-
-
1.9
VII Measurements of Branching Fractions
The results from the fits are shown in
Table 2.
Figure 1 shows the and
distributions, where events in the () plots are
required to be in the signal region after
all selection criteria. The signal yields from the fits are
, and
(statistical errors only).
No signal is observed for .
For and , the
feed-across is not negligible and its level is fixed in the ML fit.
For , the contribution is estimated by using
yields from the fitted
candidate events assuming no feed-across from ,
dividing by the kaon efficiency
and multiplying by the kaon mis-identification probability.
The result is events
from in the
signal.
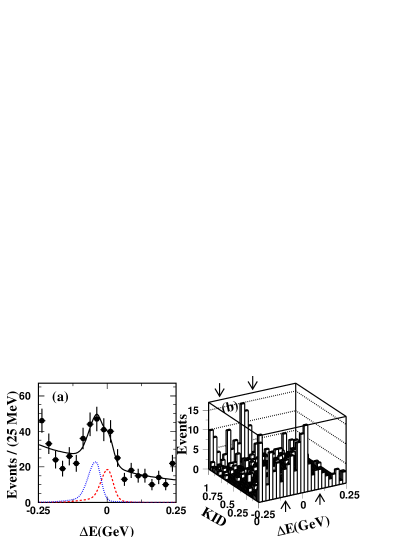
Figure 2: a): distributions without
KID requirements in the signal region.
Dotted(dashed) curves indicate the signal components
() obtained from the
fit to the candidate
events.
The solid curve shows the sum of signal and continuum background
components.
b): KID distributions in
the signal region.
Arrows show the signal region with
for and for .
This value is consistent with the level determined by repeating
the fit for with
the level of feed-across left as a free
parameter: events.
This difference is assigned to the systematic
error of feed-across for decay.
A similar procedure is used to determine
the contamination in the
yield. Here
the feed-across is found to be events.
The final measurements of branching fractions are listed in
Table 2.
Because of the assignment of the pion mass to the kaon, the
signal peaks at MeV,
which provides some discrimination from
events, which peak at MeV. We use this to provide
a consistency check of the and yields
by fitting to the
distribution for candidates with no
KID requirements applied.
The signal yields are and
events for and , respectively, which
are consistent with the results using the KID, where
the efficiency-corrected yields
are events for and
events for .
Figure 2 shows the results of this fit
and a lego plot of KID versus .
From the lego plot, there is a clear separation in the KID distribution
between and signal yields, which also provides
a consistency check.
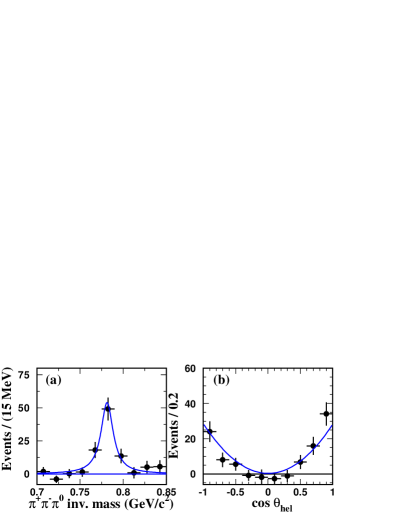
We also examine the properties of
candidates in our fit sample. The clear mass peak and
polarized distribution shown in
Fig. 3(a) and (b) confirm our fitted signals are from
mesons with no significant non-resonant
contribution. Several other consistency checks have also been
performed including tightening requirements,
and performing 1-D ML fits to and .
All studies yield consistent results.
Figure 3: Fitted yields in bins of (a)
invariant mass and (b) cosine of helicity angle for
and . Solid curves show the distribution
from signal MC normalized to the results
from the fits.
Systematic uncertainties for each mode are presented in
Table 3, with contributions arising from the background
suppression, reconstruction and the fitting function variations.
The systematic errors from the MC modeling of the and
requirements are studied with
and decays,
which are for and for .
We study the systematic error associated with the
polarization ()
requirement
by comparing the MC distributions
with the fitted yields distribution(Fig. 3).
We assign a systematic error.
Table 3: Systematic errors for . Feed-across means
for decay.
The unit is in percent .
Mode
Background suppression
4.4
4.4
4.4
4.4
Reconstruction
8.0
8.0
9.5
9.4
Fit
-
Feed-across
-
-
1
1
1
1
0.8
0.8
0.8
0.8
Sum
The total systematic error from background suppression is .
The systematic error due to uncertainties in the reconstruction
is determined from detailed studies of the charged particle
tracking, mass resolution, KID and detection.
For charged tracking and detection, the decay modes
and
are used.
By comparing results in data and MC,
we assign a relative error of for charged track reconstruction,
for mass cut, for detection.
The total reconstruction systematic error ranges between
and . The mean and width
differences of and distributions between data and
MC from decays are included in the
systematic errors from fitting.
The systematic uncertainty on the branching fraction of
is
obtained from the PDG tables PDG .
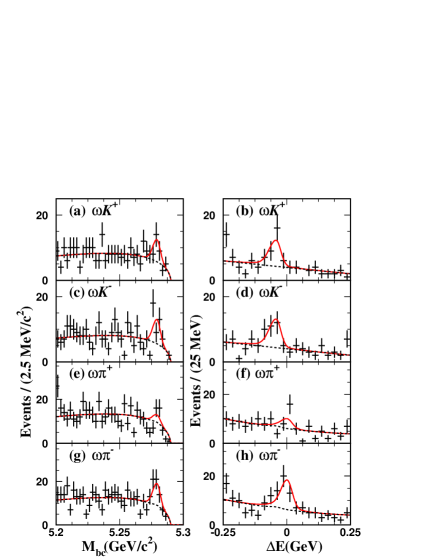
VIII Measurements
We determine partial rate asymmetries
defined as
The values of were measured for
the modes and
by performing 2D fits to the and
separately, as shown in Fig. 4.
The number of signal events in the , and modes are , and
for decays, and , and
for decays, respectively.
The corresponding partial rate asymmetry values are for and for . The
systematic error in comes mainly from the reconstruction
efficiency of high momentum charged particles and the fitting
functions. The latter is measured by varying the parameters of the
fitting functions. The asymmetry in reconstruction
efficiency is studied with an inclusive charged kaon sample.
In the confidence level calculation, we expand the interval
determined solely from the statistical error by one
standard deviation of the systematic error.
The 90% confidence
level interval corresponds to
for and for .
IX Discussion and Conclusion
In summary, we have searched for exclusive two-body charmless
hadronic decays with an meson in the final state using
a data sample of 78.1 fb-1 collected
on the resonance.
We find () =
and () = , where the first error is statistical and the second
systematic. Our results confirm our previous measurement of a
large branching fractions for , which cannot be
easily accommodated by the factorization approach and might
indicate the presence of a large non-factorizable contribution or
other penguin related processes ntheory .
An signal is
obtained for decay with significance
while no excess is observed for
decay. The results correspond to 90% confidence level upper limits of
()
and () .
We also search for partial rate asymmetries
in and .
We find for and for .
These correspond to 90% confidence
level intervals of
for
and
for .
Our results indicate the possibility of non-zero
for with confidence level,
equivalent to significance for Gaussian errors.
Figure 4: Projections of the 2D
and for
and decays.
Solid curves show the fit results.
The dashed curves indicate the backgrounds.
X Acknowledgements
We wish to thank the KEKB accelerator group for the excellent
operation of the KEKB accelerator.
We acknowledge support from the Ministry of Education,
Culture, Sports, Science, and Technology of Japan
and the Japan Society for the Promotion of Science;
the Australian Research Council
and the Australian Department of Education, Science and Training;
the National Science Foundation of China under contract No. 10175071;
the Department of Science and Technology of India;
the BK21 program of the Ministry of Education of Korea
and the CHEP SRC program of the Korea Science and Engineering Foundation;
the Polish State Committee for Scientific Research
under contract No. 2P03B 01324;
the Ministry of Science and Technology of the Russian Federation;
the Ministry of Education, Science and Sport of the Republic of Slovenia;
the National Science Council and the Ministry of Education of Taiwan;
and the U.S. Department of Energy.
References
(1)CLEO Collaboration, T. Bergfeld et al,
Phys. Rev. Lett. 81,272 (1998).
(2)CLEO Collaboration, C.P. Jessop et al,
Phys. Rev. Lett. 85,2881 (2000).
(3)BABAR Collaboration, B. Aubert et al,
Phys. Rev. Lett. 87,221802 (2001).
(4)
BABAR Collaboration, B. Aubert et al.,
Phys. Rev. Lett. 92,061801 (2004).
(5)Belle Collaboration, R.S. Lu et al,
Phys. Rev. Lett. 89,191801 (2002).
(6)A. Ali, G. Kramer, and C.D. Lu, Phys. Rev.D58,
094009 (1998); Y.H. Chen, H.Y. Cheng, B Tseng, and K.C. Yang,
Phys. Rev.D60, 094014 (1999)
(7)D.S. Du, H.J. Gong, J.F. Sun,
and G.H. Zhu, Phys. Rev.D65, 094025 (2002);
C.D. Lu and M.Z. Yang, Eur. Phys. J. C23, 275 (2002).
(8)
S.Kurokawa and E.Kikutani, Nucl. Inst. Meth. A 499, 1
(2003).
(9)The QQ B meson decay event generator was developed
by the CLEO Collaboration.
(10)R. Brun et al., GEANT 3.21,
CERN Report DD/EE/84-1, 1984.
(11)
Belle Collaboration, K. Abashian et al.,
Nucl. Inst. Meth. A 479, 117 (2002).
(12)
Belle Collaboration, K. Abe et al.,
Phys. Rev. D 64, 072001 (2001).
(13)
G. Fox and S. Wolfram, Phys. Rev. Lett 41, 1581 (1978).
(14)
R.A. Fisher, Annals of Eugenics, 7, 179 (1936).
(15)
K. Abe et al, Phys. Lett. B 517, 309 (2001).
(16)
H. Albrecht et al., Phys. Lett. B 241, 278 (1990).
(17)
J.E. Gaiser et al., Phys. Rev. D 34, 711 (1986).
(18)
K. Hagiwara et al. (Particle Data Group),
Phys. Rev. D 66, 010001 (2002).
(19)
R. Aleksan et al., Phys. Rev. D 67, 094019 (2003).